Computer aided mammography
Zhang, Z, Lu, J and Yip, YJ
Title
Computer aided mammography
Authors
Zhang, Z, Lu, J and Yip, YJ
Type
Conference or Workshop Item
URL
This version is available at: http://usir.salford.ac.uk/23114/
Published Date
2008
USIR is a digital collection of the research output of the University of Salford. Where copyright
permits, full text material held in the repository is made freely available online and can be read,
downloaded and copied for noncommercial private study or research purposes. Please check the
manuscript for any further copyright restrictions.
Computer Aided Mammography
Zhiyong Zhang, Joan Lu and Jim Yip
University of Huddersfield, Queensgate, Huddersfield HD1 3DH, UK
ABSTRACT
This research investigated the state of art of computer aided detection systems for digital mammograms, and evaluated the related techniques in image pre-processing, feature extraction and classification of digital mammograms. Furthermore, this paper explored the further research directions for next generation CAD for mammograms. It was identified that computer-aided detection techniques for masses and microcalcifications have been extensively studied, but the detection techniques for architectural distortion and asymmetry in mammograms still are challenges.
Keywords: digital mammography, CAD, breast cancer
1.0 INTRODUCTION
Breast cancer is the most common cancer for women. X-Ray mammography is an effective way to detect breast cancer. A typical mammogram contain various information that represents tissues, vessels, ducts, chest skin, breast edge, the film, and the X-ray characteristics. The computer aided systems for mammograms can be divided in two categories: computer aided detection system (CADe) and computer aided diagnosis system (CAD). CADe is able to identify the Regions of Suspicion (ROS), but CAD can make a decision whether a ROS is benign or malignant. The general process of CAD for mammograms refers to image pre-processing, defining ROS, extracting features and classifying a ROS into benign, malignant or normal.
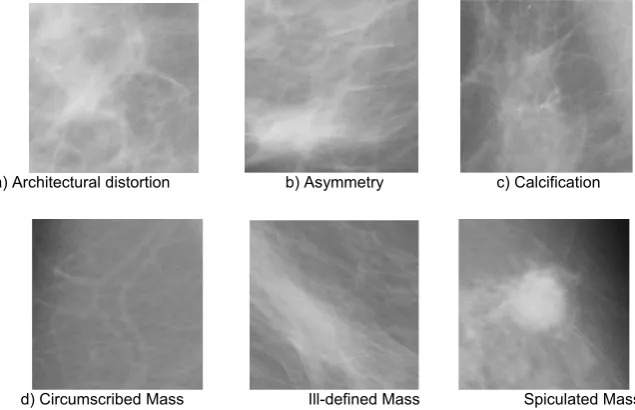
In mammograms, clustered micro-calcifications, mass lesions, distortion in breast architecture, and asymmetry between breasts have been proved that those are linked to breast cancer (see Figure 1). The appearances of microcalcifications are small bright arbitrarily shaped regions. The appearances of mass lesions are dense regions of different size and properties, which can further described by circumscribed, speculated or ill-defined. [1, 2]
At present. the detection of microcalcifications is still difficult because of their fuzzy nature, low contrast and low distinguish-ability from the ROS. The sizes of microcalcifications are in the range of 0.1-1.0 mm and the average size is 0.3 mm. The shapes, distributions and sizes of microcalcifications are tremendously various. On the other hand, it is difficult to segment microcalcifications because tissues surround them. [3]
Masses are groups of cell that are clustered together, and they have strong density than the surrounded area. The characteristics of size, homogeneity, position of masses are various [4] Christoyianni et al. pointed out that the main obstacle of mass detection is the great variability of mass appearance with other abnormalities. Asymmetry and architectural distortion are also hard to detect [1]. Therefore, the method for detecting all breast abnormalities still is a challenge [5, 6]. The techniques of detection, classification and annotation can benefit to the research of computer aided mammography.
Various researchers have conducted related research for various types of breast abnormalities for more than two decades. Currently, computer aided detection systems for mammograms for mass or microcalcification have been used in clinical routine, such as ImageChecker and SecondLook. [6]
The research of computer aided mammography continues to be developed. For the mass lesions of breast, [7] presents a tool system in 2006, including imaging segmentation of ROI, extracting ROI characterization “by means of textural features computed from the gray tone spatial dependence matrix (GTSDM), containing second-order spatial statistics information on the pixel gray level intensity”, and classify ROI with neural network. In 2008, Pal et al. used 24 kinds of features for four types of window sizes to detect microcalcification, which resulted in computing 87 features for each pixel. [8]
2.0 Analysis of techniques for mammograms
2.1 Pre-processing
Image pre-processing is a necessary step to improve the image quality of mammograms. The general methods of image pre-processing can be divided into: denoising, enhancement of structure, and enhancement of contrast. The methods of denoising refer to mean filters, median filters, Laplacian filters and Gaussian filters, the methods of enhancing the edges of image structures include unsharping and wavelet transform, and the method of enhancing image contrast can be histogram equalization.[9]
The pre-processing of digital mammograms refers to the enhancement of mammograms intensity and contrast manipulation, noise reduction, background removal, edges sharpening, filtering, etc. Cheng et al.[10] summarised the three kinds pre-processing techniques for digital mammograms: global histogram modification approach, Local-processing approaches, and multiscale processing approach. Cheng et al. [10] also pointed out the global approach is not suitable for mammograms, local enhancement methods don’t lead to the enhancement of objects and multiscale processing approaches is flexible to enhance local features. Table 1 summarise current enhancement techniques for mammograms.
2.2 Segmentation and detection
The segmentation techniques are important to separate suspicious areas of masses or microcalcifications from the background texture. The objective of segmentation of suspicious areas is to get the location and classify suspicious into benign or malignant [3]. The suspicious area of a mass has almost uniform intensity, higher than the surrounding, and a regular shape with various size and fuzzy boundaries [11]. The area growing, edge detection, wavelet, statistical methods, Mathematical morphology, the fractal model, Fuzzy approaches have been applied to segment a ROS in digital mammograms.
As the nature of scatted or clustered microcalcification, a range of segmentation techniques have been developed, such as: area growing, edge detection, wavelet, statistical methods, Mathematical morphology, the fractal model, Fuzzy approaches, have been applied to segment a ROI (area of interest) of microcalcification in digital mammograms. The researchers also developed various segmentation techniques for detecting masses. Some of them are similar to the segmentation techniques for microcalcifications, such as threshold-holding, multiscale analysis, fuzzy technique, MRF, region growing. On the other hand, the nature of masses is different from microcalcification. The suspicious area of a mass has almost uniform intensity, higher than the surrounding, and a regular shape with various size and fuzzy boundaries[11]. Some segmentation techniques have been developed especially for detecting masses, such as Bilateral image subtraction (also called asymmetry approach), template matching and model-based segmentation. Based on the research of [3] and [10], Table 3 summaries current main segmentation techniques in the field of computer aided mammography.
2.3 Feature extraction
Many features have been extracted for the abnormalities of mammograms. For the features extraction of masses, [10] summarised the features into three categories, intensity features, shape features and texture features. [1] mentioned the wavelet, fractal, statistical, and vision-models-based features for detecting masses. On the other hand, [3] summarised the features for detecting microcalcification into individual microcalcification features, statistical texture features, multi-scale texture features and fractal dimension features.
The extraction methods of texture feature play very important role in detecting abnormalities of mammograms because of the nature of mammograms. Texture analysis approaches can be summarised into three broad categories: statistical, model-based, and signal processing techniques [12]. There are four texture modelling methods: statistical methods, geometrical methods, model based methods and signal processing methods [13]. The first-order spatial statistics describe the properties of individual pixel values rather than “the interaction of or co-occurrence of neighbouring pixel values” [13]. The second-order spatial statistics is used to describe “properties of pairs of pixel values” [13].
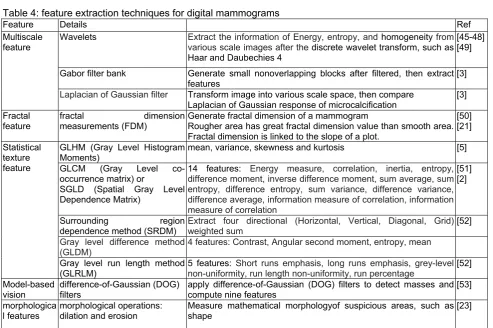
fractal analysis and mathematical morphology also contribute the detection of abnormalities of mammograms. Table 4 shows the feature extraction techniques in digital mammograms.
2.4 Classification
The classification methods for classify suspicious areas of mammograms into benign, malignant or normal tissue. The current classification techniques in digital mammograms are very common and same with the classification methods in other fields, such as neural networks, Bayesian belief network, and K-nearest neighbor.One issue is how to select the extracted features to fit various classifiers. Table 2 shows the common classification techniques and their related features in digital mammograms. [10] pointed out that the LDA and ANN (artificial neural network) work well in classifying masses.
3.0 Discussion
The research of computer aided mammography play significant role to detect the early abnormalities of breast cancer. Although the related researches have been developed for more than two decades, there are still some challenges in segmenting, detecting and classifying masses or microcalcifications. The main reason is that masses or microcalcifications are very small, and vary in size, shape, and appearance. It is very difficult to recognise those abnormalities from the background. Therefore, the most important thing for computer-aided mammograms is how to enhance the features of ROS in the background, how to segment ROS from the background, how to represent ROS, and how to classify ROS. In each area, new and robust algorithms need to be developed.
4.0 Conclusion
The computer aided mammography has been extensively studied. The related research mainly is related to detect and classify masses and microcalcifications. The techniques in the field of computer-aided mammography include pre-processing, segmenting suspicious areas, extracting features of ROS, and classifying ROS into benign, malignant or normal tissue. The different techniques or algorithms has been proposed or extended for digital mammograms. However, the reliable detection of masses or microcalcifications is still a challenge. The research for other abnormalities of breast cancer, such as architectural distortion and asymmetry, has not been developed well. For the future research, the two important topics are how to improve the accuracy and reliability of computer aided mammography for masses and microcalcifications, and how to develop new techniques to detect full abnormalities of breast cancer.
References
1. Christoyianni, I., et al., Computer aided diagnosis of breast cancer in digitized mammograms. Computerized Medical Imaging and Graphics, 2002. 26(5): p. 309-319.
2. Wei, C.-H., C.-T. Li, and R. Wilson. A General Framework for Content-Based Medical Image Retrieval with its Application to Mammograms. in Proc. SPIE Int'l Symposium on Medical Imaging. 2005.
3. Cheng, H.D., et al., Computer-aided detection and classification of microcalcifications in mammograms: a survey. Pattern Recognition, 2003. 36(12): p. 2967-2991.
4. Suliga, M., R. Deklerck, and E. Nyssen, Markov random field-based clustering applied to the segmentation of masses in digital mammograms. Computerized Medical Imaging and Graphics, 2008. 32: p. 502-512.
5. Christoyianni, I., E. Dermatas, and G. Kokkinakis. Neural classification of abnormal tissue in digital mammography using statistical features of the texture. in The 6th IEEE International Conference on Electronics, Circuits and Systems. 1999. apos. 6. Rangayyan, R.M., F.J. Ayres, and J.E. Leo Desautels, A review of computer-aided diagnosis of breast cancer: Toward the
detection of subtle signs. Journal of the Franklin Institute, 2007. 344: p. 312-348.
7. Bellotti, R., A completely automated CAD system for mass detection in a large mammographic database. Medical Physics, 2006. 33(8): p. 3066-75.
8. Pal, N.R., et al., A multi-stage neural network aided system for detection of microcalcifications in digitized mammograms.
Neurocomputing, 2008. 71: p. 2625-2634.
9. Russ, J.C., The Image Processing Handbook. 1992, Boca Raton, FL: CRC.
10. Cheng, H.D., et al., Approaches for automated detection and classification of masses in mammograms. Pattern Recognition, 2006. 39: p. 646-668.
11. Lai, S.M., X. Li, and W.F. Biscof, On techniques for detecting circumscribed masses in mammograms. IEEE Trans. Med. Imaging, 1989. 18(4): p. 377-386.
12. Liapis, S., E. Sifakis, and G. Tziritas, Colour and texture segmentation using wavelet frame analysis, deterministic relaxation, and fast marching algorithms. J. Vis. Commun. Image, 2004. 15: p. 1-26.
13. Tuceryan, M. and A.K. Jain, Texture analysis, in The Handbook of Pattern Recognition and Computer Vision (2nd Edition). 1998, World Scientific Publishing Co. p. 207-248.
14. Chan, H.P., et al., Digital mammography: ROC studies of the eIects of pixel size and unsharp-mask filtering on the detection of subtle microcalcifications. Invest. Radiol. , 1987. 22(7): p. 581-589.
15. Ji, T.L., M.K. Sundareshan, and H. Roehrig, Adaptive image contrast enhancement based on human visual properties. IEEE Trans. Med. Imaging, 1994. 13(4): p. 573-586.
17. Gordon, R. and R.M. Rangayyan, Feature enhancement of film mammograms using fixed and adaptive neighborhoods. Appl. Opt., 1984. 23(4): p. 560-564.
18. Dhawan, A.P., G. Buelloni, and R. Gordon, Enhancement of mammographic features by optimal adaptive neighborhood image processing. IEEE Trans. Med. Imag. , 1986. 5(1): p. 8-15.
19. Ericksen, J.P., S.M. Pizer, and J.D. Austin. MAHEM: a multiprocessor engine for fast contrast limited adaptive histogram equalization. in Proc. SPIE 1233. 1990.
20. Laine, A.F., et al., Mammographic feature enhancement by multiscale analysis. IEEE Trans. Med. Imag., 1994. 13(4): p. 7250-7260.
21. Li, H., R. Liu, and S. Lo, Fractal modeling and segmentation for the enhancement of microcalcifications in digital mammograms. IEEE Trans Med Imaging, 1997. 16(6): p. 785-798.
22. Li, H., et al., Markov random field for tumor detection in digital mammography. IEEE Trans Med Imaging, 1995. 14(3): p. 565-576.
23. Halkiotis, S., T. Botsis, and M. Rangoussi, Automatic detection of clustered microcalcifications in digital mammograms using mathematical morphology and neural networks. Signal Processing, 2007. 87: p. 1559-1568.
24. Dhawan, Y., C. Chitre, and B.K. W. Radial-basis-function based classification of mammographic microcalcifications using texture features. in Proceedings of the 17th Annual International Conference of the IEEE Engineering in Medicine and Biology Society. 1995.
25. Woods, K., Automated image analysis techniques for digital mammography. 1994, University of South Florida.
26. Ozekes, S., O. Osman, and A. Çamurcu, Mammographic Mass Detection Using a Mass Template. Korean J Radiol, 2005. 6: p. 221-228.
27. Kramer, D. and F. Aghdasi. Classification of microcalcifications in digitised mammograms using multiscale statistical texture analysis. in Proceedings of the South African Symposium on Communications and Signal Processing. 1998. 28. Zadeh, H.S., S.P. Nezhad, and F.R. Rad. Shape-based and texture-based feature extraction for classification of
microcalcification in mammograms. in Proc. SPIE 4322. 2001.
29. Bankman, I.N., et al., Segmentation algorithms for detecting microcalcifications in mammograms. IEEE Trans. Inform. Technol. Biomed. , 1997. 1(2): p. 141-149.
30. Shen, L., R.M. Rangayyan, and J.E.L. Desautels, Detection and classification of mammographic calcifications. Int. J. Pattern Recogn. Artif. Intell. , 1993. 7(6): p. 1403-1416.
31. Kim, J.K., et al., Detection of clustered microcalcifications on mammograms using surrounding region dependence method and artificial neural network. J. VLSI Signal Process, 1998. 18: p. 251-262.
32. Davies, D.H. and D.R. Dance, The automatic computer detection of subtle calcifications in radiographically dense breasts.
Phys. Med. Biol., 1992. 37: p. 1385-1390.
33. Karssemeijer, N., Adaptive noise equalization and image analysis in mammography, Information Processing in Medical Imaging, in 13th International Conference IPMI ’93. 1993: AZ, USA. p. 472-486.
34. Mossi, J.M. and A. Albiol, Improving detection of clustered microcalcifications using morphological connected operators, in
1999 IEEE Image Processing and its Applications. 1999. p. 498-501.
35. Zhao, D., M. Shridhar, and D.G. Daul, Morphology on detection of calcifications in mammograms, in IEEE International Conference on Acoustics, Speech and Signal Processing. 1992. p. 129-132.
36. Dengler, J., S. Behrens, and J.F. Desaga, Segmentation of microcalcifications in mammograms. IEEE Trans. Med. Imag. , 1993. 12(4): p. 634-642.
37. Qian, W., et al., Tree-structured nonlinear filters in digital mammography. IEEE Trans. Med. Imag., 1994. 13(1): p. 25-36. 38. Strickland, R.N. and H.I. Hahn, Wavelet transforms for detecting microcalcifications in mammograms. IEEE Trans. Med.
Imag., 1996. 15(2): p. 218-229.
39. Netsch, T. and H.O. Peitgen, Scale-space signatures for the detection of clustered microcalcifications in digital mammograms. IEEE Trans. Med. Imag. , 1999. 18(9): p. 774-786.
40. Yoshida, H., et al. Optimizing wavelet transform based on supervised learning for detection of microcalcifications in digital mammograms. in Proceedings of the IEEE International Conference on Image Processing. 1995. Washington, DC.
41. Strickland, R.N. and H.I. Hahn. Wavelet transforms for detecting microcalcifications in mammography. in Proceedings of the International Conference on Image Processing. 1994. Austin, TX.
42. Cheng, H.D., Y.M. Lui, and R.I. Freimanis, A novel approach to microcalcification detection using fuzzy logic technique.
IEEE Trans. Med. Imag. , 1998. 17(3): p. 442-450.
43. Zheng, B., Y.H. Chang, and D. Gur, Computerized detection of masses from digitized mammograms: comparison of singleimage segmentation and bilateral-image subtraction. Assoc. Univ. Radiologists, 1995. 2(12): p. 1056-1061. 44. Li, H., et al., Computerized radiographic mass detection C part I: lesion site selection by morphological enhancement and
contextual segmentation. IEEE Trans. Med. Imaging, 2001. 20(4): p. 289-301.
45. Liu, S., The Analysis of Digital Mammograms: Spiculated Tumor Detection and Normal Mammogram Characterization, in
School of Electrical and Computer Engineering. 1999, Purdue University.
46. Rashed, E.A. and M.G. Awad, Neural networks approach for mammography diagnosis using wavelets features, in First Canadian Student Conference on Biomedical Computing. 2006.
47. Qian, W., L. Li, and L. Clarke, Image feature extraction for mass detection in digital mammography: influence of wavelet analysis. Med Phys, 1999. 26(3): p. 402-408.
48. Chen, C. and G. Lee, Image segmentation using multiresolution wavelet analysis and expectation-maximization (EM) algorithm for digital mammography. Int J Imaging Syst Technol, 1997. 8(5): p. 491-504.
49. Wang, T. and N. Karayiannis, Detection of microcalcifications in digital mammograms using wavelets. IEEE Trans Med Imaging, 1998. 17(4): p. 498-509.
50. Lefebvre, F., H. Benali, and E. Kahn, Fractal analysis of clustered microcalcifications in mammograms. Acta Stereol, 1992. 11: p. 611-616.
51. Haralick, R.M. Statistical and structural approaches to texture. in Proceedings of the IEEE. 1979.
53. Polakowski, W., et al., Computer-aided breast cancer detection and diagnosis of masses using difference of Gaussians and derivativebased feature saliency. IEEE Trans Med Imaging, 1997. 16(6): p. 811-819.
a) Architectural distortion b) Asymmetry c) Calcification
[image:6.595.132.450.116.321.2]
d) Circumscribed Mass Ill-defined Mass Spiculated Mass
[image:6.595.54.552.392.542.2]Figure 1: Abnormal mammograms are classified into calcification, architectural distortion, asymmetry, circumscribed masses, speculated masses, and ill-defined masses. Source: [2]
Table 1: mammographic enhancement techniques
Enhancement Methods Details Ref. Global based Unsharp masking Remove low frequency information to
enhance ROI
[14]
Adaptive unsharp masking Use local statistical analysis to enhance ROI [15] Region based Region-based enhancement Use region growing to enhance ROI [16] Local based Adaptive neighbourhood contrast enhancement
(ANCE) Enhance a small fixed neighbour area [17] Optimal adaptive enhancement Use local statistical information [18] Contrast-limited adaptive histogram equalization limit the maximum slope in the transformation
function to improve local contrast [19] Feature based Multiscale analysis: dyadic wavelet transform,
φ-transform, Hexagonal wavelet transform Increase the contrast of suspicious areas [20]
fractal modelling remove the background structures and noise
from foreground
[21]
Table 2: Classification techniques and features for mammograms
Categories Details References
Markov random field
models Statistical classification model using the statistical and contextual information for masses, based on K-means cluster scheme [22] [4] ANN A multi-stage neural network, [8]
Radial basis function neural networks (RBFNN) and GLHM, SGLD features [1] [23] [24] Pattern matching Use mass template to check if a area is mass [25, 26] Bayesian Belief
Network (BBN) In the “acyclic” graph, each node represents a variable, and merge the extracted features [3] K-nearest neighbor
(KNN) co-occurrence features, wavelet features and shape features [27, 28] Linear Discriminant
[image:6.595.50.554.568.717.2]Table 3: segmentation techniques for mammograms
categories Rational Methods Ref.
Region growing Use homogenous gray level information to detect the potential areas
region-growing-based algorithm [29]
multi-tolerance region growing [30] Surrounding region dependence [31]
Statistical analysis Use statistical analysis to get global and local
threshold Histogram threshold-holding [32] Model spatial relation by maximizing estimation Markov random field model [33] Morphology
modeling Use morphological adaptive threshold to get morphological skeleton information Top-hat [34] Use the morphological operation, Erosion, to
produce skeleton information Erosion [35] Use morphological filter to generate edge
information Morphological filter [36] Multiscale analysis After transform, use coefficient information to
reconstruct images and separate microcalcifications from the background, and various coefficient information represent coarse features and finer features
Multichannel wavelet transform, B-spline function, Multiresolution statistics analysis, Multiscale analysis, Decimated wavelet transform, Undecimated biorthogonal transform, two-stage wavelet transforms, Discrete wavelet transform (DWT)
[37] [38] [39] [40] [41]
Fractal model Use fractal objects to model images Fractal model [21] Fuzzy approach Use fuzzy rules and properties to separate Fuzzy logic [42] Information
difference
Use the difference of a pair of mammograms to detect ROI of masses
Bilateral image subtraction [43]
Model-based Use a range of sizes for the templates to match Template matching [11]
uses a constrained stochastic relaxation algorithm to match
stochastic relaxation [44]
Table 4: feature extraction techniques for digital mammograms
Feature Details Ref
Multiscale feature
Wavelets Extract the information of Energy, entropy, and homogeneity from various scale images after the discrete wavelet transform, such as Haar and Daubechies 4
[45-48] [49]
Gabor filter bank Generate small nonoverlapping blocks after filtered, then extract
features [3]
Laplacian of Gaussian filter Transform image into various scale space, then compare
Laplacian of Gaussian response of microcalcification [3] Fractal
feature
fractal dimension measurements (FDM)
Generate fractal dimension of a mammogram
Rougher area has great fractal dimension value than smooth area. Fractal dimension is linked to the slope of a plot.
[50] [21]
Statistical texture feature
GLHM (Gray Level Histogram
Moments) mean, variance, skewness and kurtosis [5] GLCM (Gray Level
co-occurrence matrix) or
SGLD (Spatial Gray Level Dependence Matrix)
14 features: Energy measure, correlation, inertia, entropy, difference moment, inverse difference moment, sum average, sum entropy, difference entropy, sum variance, difference variance, difference average, information measure of correlation, information measure of correlation
[51] [2]
Surrounding region
dependence method (SRDM) Extract four directional (Horizontal, Vertical, Diagonal, Grid) weighted sum [52] Gray level difference method
(GLDM) 4 features: Contrast, Angular second moment, entropy, mean
Gray level run length method (GLRLM)
5 features: Short runs emphasis, long runs emphasis, grey-level non-uniformity, run length non-uniformity, run percentage
[52]
Model-based vision
difference-of-Gaussian (DOG) filters
apply difference-of-Gaussian (DOG) filters to detect masses and compute nine features
[53]
morphologica l features
morphological operations: dilation and erosion
Measure mathematical morphologyof suspicious areas, such as shape