www.arpnjournals.com
PERFORMANCE EVALUATION OF VOICE OVER IP USING MULTIPLE
AUDIO CODEC SCHEMES
L. Audah
1, A.A.M. Kamal
1, J. Abdullah
1, S.A. Hamzah
1and M.A.A. Razak
21Optical Communication and Network Research Group (OpCon), Faculty of Electrical and Electronic Engineering,
Universiti Tun Hussein Onn Malaysia, Parit Raja, 86400 Batu Pahat, Johor, Malaysia.
2Faculty of Electrical Engineering, Universiti Teknologi Malaysia, 81310 Johor Bahru, Malaysia.
E-Mail: 1{hanif, jiwa, shipun}@uthm.edu.my, 1[email protected], 2[email protected]
ABSTRACT
The evolution of Voice over IP (VoIP) has made it one of the most popular applications over the wired/wireless Internet system due to its flexibility in technology integration and low cost of services. Telco and service operators have used the communication resources to optimize the VoIP architecture in order to provide better quality of service (QoS) to end consumers. The VoIP is a delay-sensitive traffic which requires minimum delay for general applications and minimum loss ratio for specific applications as the key QoS performance parameters. This paper compares the end-to-end (e2e) QoS performance parameters of VoIP codec schemes against multiple traffic connections transmitted over the Internet system. Background traffics are included in the simulations to closely match the real-world Internet scenario. Simulations analysis of bidirectional VoIP communications are done from the network layer perspective to compare the QoS performances of G.711, G.729A, G.723.1 and GSM.AMR codec schemes against the incremental of active connections in the network system. The results show that the G.729A produces at least 2.81% better in term of average accumulative e2e delay. The G.711 produces at least 21.89% better in term of average accumulative e2e jitter but produces the worst e2e packet loss ratio. In addition, GSM.AMR shows the best e2e effective transmission rate ratio ranges between 42.67% and 89.82%. This study has investigated the QoS performance variations of VoIP codecs so that the results could be used as guidelines to estimate the optimal network resources for various traffic requirements as early as in the design stage. As for future works, this study suggests the adaptive priority queue and packet scheduling at Internet getaway to regulate the traffic based on per flow QoS requirements.
Key words: VoIP Audio Codecs QoS Internet Simulation NS-2
INTRODUCTION
Voice over IP (VoIP) applications have been very popular among the millions of Internet users for audio communications. The packet based framework of VoIP and low cost of packet data usage have made it the most preferable choice of future Internet communications to replace the conventional circuit switch telephone network. The flexibility of VoIP application to be implemented as software/hardware based and the ability to connect multiple devices simultaneously through wired/wireless channels have become one of the hot topics in the realm of Internet of Things (IoT). Big players from the telco operators and service providers have participated in the billion dollars market opportunities of VoIP applications for future smart-home and smart-cities.
In order to optimize the VoIP applications in future communications, various research works have been done from the physical to application layers. Previous research paper by (El-brak et al., 2011) has compared the VoIP performance over small mobile as-hoc network (MANET) using a pair of source and destination nodes. Besides that, (Ashouri et al., 2014) has analyzed the performance of VoIP using different encryption methods over a local wireless network. Moreover, (Kim et al., 2014) has studied the performance of VoIP QoS over long term evolution (LTE) system from the user perspective by varying the speed, distance and number of mobile nodes. In addition, research by (Cocker et al., 2014) has analyzed from the transport layer perspective for the buffer requirements over time and path taken by VoIP traffic over the Internet system. None of
the related research has compared the QoS performance of VoIP codec schemes from the network layer perspective and its robustness against various competing traffics. This paper analyzes and compares the e2e QoS performance parameters of bidirectional VoIP (i.e. delay, jitter, loss ratio and throughput) using different types of audio codecs mainly used for VoIP applications (i.e. G.711, G.729A, G.723.1 and GSM.AMR). Simulations analyses have been done from the network layer perspective using multiple connections of VoIP and background traffics to closely match the real-world Internet system scenario. The simulation results provide insight on the performance comparison of each VoIP codec used for audio communication over the Internet system. The remainder of this paper is organized as follows: Section II explains the NS-2 simulation configuration. The results and analysis are discussed on Section III. Finally, Section IV concludes the findings and suggests future research works.
SIMULATION SETUP
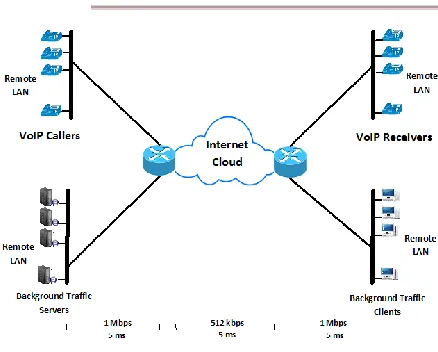
The simulation setup characterizes a simple ubiquitous e2e Internet system as depicted in Figure 1. The network simulations were done using NS-2.34 and AWK programming tools. The next subsections explain the details of network elements parameters involved in the simulations.
Network configuration
The NS-2 network configurations consist of 2 VoIP remote
Figure 1: NS-2 network simulation scenario.
connected via the Internet. Each remote LAN was connected to the Internet getaway router via 1 Mbit/s full-duplex link with 5 ms of link delay. The Internet network cloud was represented with a 512 kbit/s full-duplex link and also 5 ms of link delay. Each link interface contains a simple Droptail queue with a 50 packet buffer size.
The link bandwidths were set to such small scale values to represent a much larger broadband network system because of the computer hardware/software and NS-2 simulations time limitations. The network system design does not include the bit-error-rate (BER) for link error model because it was assumed that the BER for wired broadband network was very low and could be neglected.
APPLICATION MODELLING
There are 2 types of application services used in the NS-2 simulations which were the bidirectional VoIP with multiple codec schemes and also the background traffic. Multiple connections were generated from each traffic type during 500 s of a simulation time. The simulations were done separately for 5 different VoIP codec which are the GSM.AMR, G.711, G.723.1 and G.729A. Simulations for each VoIP codec were done for 10 times with incremental of VoIP and background traffic connections. The VoIP connections were increased by 50 between 50 and 500 connections while the background traffic increased by 5 between 5 and 50 connections for the simulations of each VoIP codec type. Details of VoIP and background traffic configurations will be explained in the next subsections.
Bidirectional VoIP
The bidirectional VoIP application system model as in (Bacioccola et al., 2007) and (Andreozzi et al., 2010) was used for the simulations in NS-2. Standard codec type like GSM.AMR (Sjoberg et al., 2007), G.711 (ITU-T G.711, 1988), G.723.1 (ITU-T G.723.1, 2006) and G.729A (ITU-T G.729, 2012) were used at the source side to encode the Voice Activity Detection (VAD) (e.g. talkspurt and silence events) into a few chunk of bytes before sending the data over the Internet network using UDP transport protocol (Schulzrinne and Casner, 2003). The talkspurt and silence events between the communicating VoIP clients were not independent and modelled using modified Brady’s model. The bidirectional audio streams between caller and lister can be in in any of four states which are single talk, double
talk, short silence and mutual silence (Bacioccola et al., 2007) and (Andreozzi et al., 2010).
Table 1 shows the codec’s sample size and bit rate used in the simulations as suggested in (Schulzrinne and Casner, 2003). The VoIP sample size data are excluding the IP/UDP/RTP headers size which approximately 40 bytes. At the receiver side, the transmitted audio packets were demultiplexed and inserted into a H.323 playout buffer to ensure that the packets are decoded at the same interval at which they were generated by the encoder. The H.323 protocol provides real-time audio communications on point-to-point, multipoint or broadcast network configurations (ITU-T H.323, 2009).
Background traffic
Multiple connections of the background traffic were used in the NS-2 simulations to represent the other types of Internet applications that shared the network resources with VoIP application. The background traffic was modelled as in (Harfoush, 2000) by using a Pareto On/Off UDP source. The Pareto shape parameter (α) was set to 1.2. The traffic was generated using constant packet size of 200 bytes with 2 s of burst time and 1 s of idle time. The packets were transmitted at 3.6 kbit/s bit rate.
RESULTS AND ANALYSIS
Each NS-2 simulation was carried out for the duration of 10 minutes. The simulations were done 10 times (i.e. 10 average values of new VoIP connection inter-arrival time) for each VoIP codec. The simulations results and analysis were divided into 4 QoS categories which are the average e2e delay, jitter, packet loss ratio and throughput. The QoS parameters were calculated based on each simulation output trace file using AWK programming script and then presented in the form of graphs as shown in the next sub-sections.
Average end-to-end delay
Average e2e delay is the common QoS parameter used to describe the level of service interactivity and smooth playback. The estimated e2e delay (one-way) for a VoIP connection could be estimated using Equation (1).
Dt ≈ Dp +Dq + Dn (1)
where Dt is the one way packet delay from VoIP caller to
receiver, Dp is the one way propagation time, Dq is the queuing delay and Dn is the additional delay due to traffic
[image:2.595.327.534.678.765.2]and other network factors.
Table 1: VoIP codec sample size and bit rate.
Codec Type Sample Size
(Bytes) Bit Rate (kbit/s) GSM.AMR 32 4.75 – 12.2;
Toll quality speech = 7.4
G.723.1 24 6.3
G.711 80 64
The one way propagation delay (Dp) could be estimated by
summing up all links delays from caller to receiver. Based on the simulation scenario in Figure 1, the one way propagation delay from caller to receiver is 15 ms (i.e delay from caller to Internet getaway + propagation delay within the Internet network cloud + delay from the internet getaway to receiver). The queuing delay in this case mainly occurs at the Internet getaway which was calculated using equation (2).
l q
B P N
D
8 (2)where N is the current total number of packets in queue buffer, P parameter refers to the packet size in bytes while
Bl is the link bandwidth measured in bit per second (bit/s).
Dqparameter for each of the Internet getaway was 1.56NP x
10-5 second depending on codec types for N and P
parameters if we includes the Internet link bandwidth of 512 kbit/s. In addition, the Dnparameter is the delay due to the
packet transmission time and also the network dynamic factors like congestion and link failure.
The average e2e delays for all VoIP connections in a simulation, D was then calculated by summing up all of the one way connection delay and then divides with the total number of established VoIP connections (i.e. n parameter) during the simulation time as shown in Equation (3).
n D
D
n i
i i t
1)
(
(3)
Figure 2 shows the average end-to end delay against average number of established VoIP connections in a simulation. The lower the delay the better would be the transmitted voice quality across the network system. The delays are proportional to the increment of average VoIP connections. The more new connections established between caller and receiver, the higher would be the delay for each type of VoIP codec. The average delays for all VoIP codecs except G.711 remain below 25 ms if the average generated VoIP connections within the network system are between 50 and 150. After that, the delays increased and reach the maximum for approximately 121 ms. In contrast, the maximum delay for G.711 VoIP codec is 244 ms.
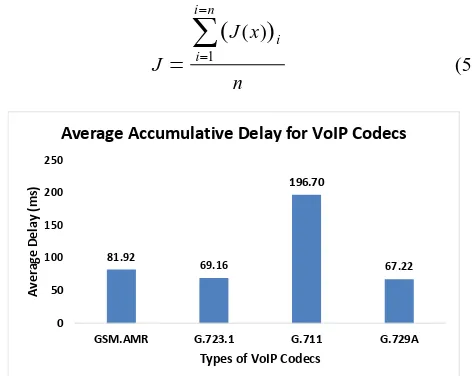
The average accumulative delays for GSM.AMR, G.723.1, G.711 and G.729A codecs are 81.92 ms, 69.16 ms, 196.7 ms and 67.22 ms respectively as shown in Figure 3. All VoIP codecs satisfy the International Telecommunication Union (ITU) delay recommendation to be less than 150 ms for best audio reception quality except G.711 codec (Demichelis and Chimento, 2002). One of the main reasons is that the sample size for G.711 is 80 bytes excluding the 40 bytes of IP/UDP/RTP headers.
[image:3.595.311.544.58.222.2]This codec sample size is approximately 2.5 times more than the others. The other reason is that the G.711 codec utilizes A-law/µ-law companding algorithm with low compression rate which eventually accommodate larger link bandwidth fraction compared to the other codecs.
Figure 2: Average e2e delay.
Average end-to-end jitter
Jitter is the e2e one way delay variation between packets transmitted from caller to receiver by ignoring any lost packets (Szigeti and Hattingh, 2014). Jitter causes the packets to arrive at different timing and possibly in different order. At certain level, jitter may cause audio anomalies like stuttering, uneven audio and abnormal speech rhythm. Equation (4) is the general equation used to calculate jitter per connection.
( 1) ( 1)
() ()
) ( ) 1
(i J i R i S i R i S i
J (4)
where
S(i) – Time at which packet ‘i’ was transmitted from the caller.
R(i) – Time at which packet ‘i’ was received at the receiver.
The average e2e jitter for all VoIP connections in a simulation, J was then calculated by summing up all of the one way connection jitter and then divide with the total number of established VoIP connections (i.e. n parameter) during the simulation time as shown in Equation (5).
n x J
J
n i
i
i
1)
(
( ) [image:3.595.312.548.522.710.2](5)
Figure 3: Average accumulative e2e delay of VoIP codecs.
The average jitters shown in Figure 4 are steadily increased between 50 and 250 VoIP connections for all codec types. After that the values maintain between 4.0 ms and 5.3 ms except for G.711 which decrease and maintain between
81.92
69.16
196.70
67.22
0 50 100 150 200 250
GSM.AMR G.723.1 G.711 G.729A
Av
e
ra
ge
Dela
y
(ms
)
Types of VoIP Codecs
Average Accumulative Delay for VoIP Codecs 0
50 100 150 200 250
50 100 150 200 250 300 350 400 450 500
Av
era
ge
De
la
y
(ms
)
Average VoIP Connections
Average Delay vs Average VoIP Connections
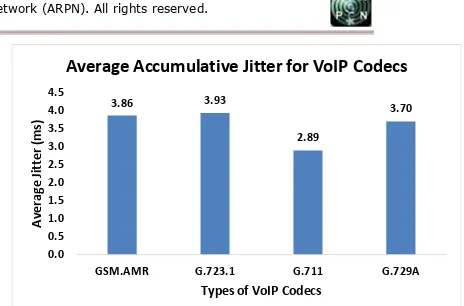
2.2 ms and 2.3 ms after 300 VoIP connections. Besides that, the average accumulative jitter for GSM.AMR, G.723.1, G.711 and G.729A codecs are 3.86 ms, 3.93 ms, 2.89 ms and 3.70 ms respectively as shown in Figure 5.
There are no specific VoIP jitter limitation specified by the ITU but it is strongly advisable to be less than 30 ms for one way e2e average jitter when designing the VoIP communications over LAN, WAN and VPN systems (ITU-T G.114, 2003). In the simulations results as in Figure 4, the networks becomes congested and saturated with many competing VoIP and background traffics after 300 VoIP connections. The decrement of jitter values for G.711 codec after 300 connections is because too many packets have been dropped in congested links as the network moves towards saturation point and the jitter counted in the simulations ignored the loss packets. In addition, larger packet size as in G.711 codecs has severely affected by network dynamics compare to smaller packets size like in the other codec types. Although playout buffer is used in this VoIP system to dampen the jitter and rearrange the out order packets but the severity of congestion at the bottleneck link has degraded the jitter performance.
Average end-to-end packet loss ratio
The average e2e packet loss ratio over the Internet system is another important QoS performance parameters for VoIP. Packet loss ratio is the ratio of total packet loss over total packet sent from caller to receiver. The average packet loss ratio for all VoIP connections in a simulation was measured as in equation (6).
k zk k s y j
j j l
P P
i L
1 1
)
(
)
(
)
( (6)
where ∑Pl is the total packets loss and ∑Ps is the total
[image:4.595.310.542.57.210.2]sending packets from the caller during a VoIP connection session. By considering all generated VoIP connections (n) in a simulation run time, the average e2e packet loss ratio was calculated as in equation (7).
Figure 4: Average e2e jitter.
Figure 5: Average accumulative e2e jitter of VoIP codecs.
n i L
L
n i
i
1) (
(7)
Figure 6 shows the average e2e packet loss ratio against average VoIP connections generation in a simulation run time for all codec types. The average e2e packet loss ratio is proportional to the increment of average generated VoIP connections in the network system. The lower the loss ratio the better would be the transmitted audio quality. The average e2e packet loss ratio for all codec types except G.711 and G.723.1 remain almost constant below 1.2 % for average connection between 50 and 150 depending on the codec types.
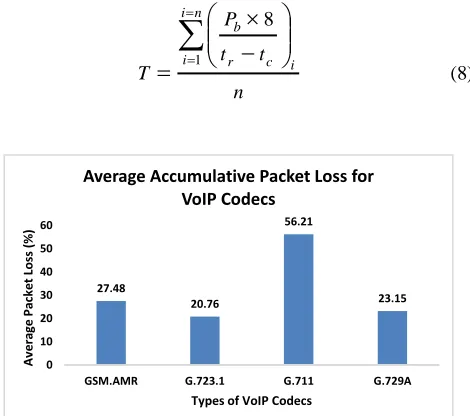
Only the G.723.1 codec successfully maintains packet loss ratio below 1% until 250 connections while the G.711 suffers packet losses between 1% and 64.7%. After that, all codecs shows rapid increment of packet loss between 250 and 450 connections and then remains almost constant between 48.4% and 79.0%. In addition, the average accumulative packet loss ratio as shown in Figure 7 for GSM.AMR, G.723.1, G.711 and G.729A are 27.48%, 20.76%, 56.21% and 23.15% respectively.
The packet loss occurs when the queue buffer on network link becomes overflow as the results of network congestion. The packet loss event is not a critical factor for the delay-sensitive traffic like VoIP compared to the throughput-sensitive traffic. However, in order to transmit high quality audio over the network system it is necessary to keep the losses at minimum. The ITU does not specifically mentioned the standard of maximum packet loss for VoIP. However, the ITU has suggested that the loss ratio should be less than 1% for a VoIP connection in order to achieve the best audio quality (ITU-T G.114, 2003). If the loss ratio is much higher, the VoIP connections may experience audio anomaly like echo, stuttering and etc. The G.723.1 could achieve that goal for average connections below 250 while the others except G.711 only below 150. The G.711 codec transmission must maintain below 50 connections in order to achieve best audio quality.
0 1 2 3 4 5 6
50 100 150 200 250 300 350 400 450 500
Av
era
ge
J
itte
r
(ms
)
Average VoIP Connections
Average Jitter vs Average VoIP Connections
GSM.AMR G.723.1 G.711 G.729A
3.86 3.93
2.89
3.70
0.0 0.5 1.0 1.5 2.0 2.5 3.0 3.5 4.0 4.5
GSM.AMR G.723.1 G.711 G.729A
Av
er
ag
e
Ji
tter
(m
s)
Types of VoIP Codecs
[image:4.595.51.283.585.717.2]Figure 6: Average e2e packet loss ratio.
Apart from the network dynamic conditions, packet loss occurs because of the VoIP codec unique characteristics. The good performance of G.723.1 in this network simulation scenario is also due to high packet compression ratio, low transmission bit rate and lossy companding algorithm utilization. In contrast, the low performance of G.711 codec might be due to its built in framework design which utilizes the A-law/µ-law companding algorithm in order to deliver precise speech transmission. The codec also produce higher bit rate compare to the others which is about 64 kbit/s. However, the codec is more sensitive towards packet losses due to poor packet loss interpolation.
Average end-to-end throughput
The e2e throughput concludes the previous QoS performance parameters as it measures the rate of successfully received packets at the receiver. The throughput might not be as critical as the delay and jitter QoS parameters for the delay sensitive traffic like VoIP but it may provide references in designing the e2e network system with QoS to accommodate high quality voice traffics.
The average e2e throughput in bit/s for all VoIP connections (n) in a simulation is calculated using Equation (8).
n t t
P
T
n i
i r c i
b
18
(8)
Figure 7: Average accumulative e2e packet loss ratio of VoIP codecs.
where Pb is the total received packets at the receiver in
bytes, tr is the packet received time and tc is the packet
sending time from the caller for a VoIP connection
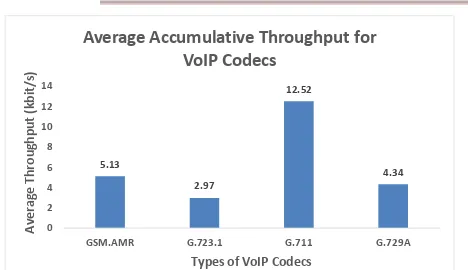
Figure 8 shows the average e2e throughput for average VoIP connections between 50 and 500. The throughput values for all VoIP codecs except G.711 remain almost constant between 3.6 kbit/s and 6.6 kbit/s for average connections between 50 and 250 depending on codec types. After that, the throughputs slightly decrease and then remain almost constant again between 2.0 kbit/s and 3.68 kbit/s for average VoIP connections between 400 and 500. In contrast, the G.711 codec shows rapid decrement from 28.0 kbit/s to 7.5 kbit/s between 50 and 300 average connections and then remain almost constant between 6.0 kbit/s and 6.97 kbit/s. In addition, the average accumulative throughput as in Figure 9 for GSM.AMR, G.723.1, G.711 and G.729A codec types are 5.13 kbit/s, 2.97 kbit/s, 12.52 kbit/s and 4.34 kbit/s respectively. The G.711 codec achieved the highest average throughputs for all VoIP connections while the G.723.1 codec achieved the lowest compare to the others.
[image:5.595.51.286.531.739.2]The average e2e throughput patterns are inversely proportional to the increment of average VoIP connections. There are 2 main factors that affecting the throughput which are the delay and packet losses. The delay and packet loss results for all codec types except G.711 have shown significant increment after 200 average VoIP connections generated within the network during a simulation time. Consequently, the throughputs show significant decrement and then remain almost constant until 500 connections depending on the codec types. Since the new VoIP connections are continuously generated without waiting for the previous connections to be completed, more VoIP connections will compete with the background traffic to access the network in best-effort manner. At certain point of time, the network becomes congested and then the packets need to queue for network access which eventually increases the delay. When the buffer is full, the packets start to be dropped and reduce the number of successful received packets. As for the G.711 codec, the rapid decrements of throughput between 50 and 300 connections not only due to the delay and packet loss effects but also due to the codec’s unique specification with larger codec sample size, short interval time between packets and also lossless data compression method utilization. Simulations results have shown that those characteristics severely degrade the G.711 codec performances in certain high density network traffic system.
Figure 8: Average e2e throughput.
0 5 10 15 20 25 30
50 100 150 200 250 300 350 400 450 500
Av
er
ag
e
Th
ro
u
gh
p
u
t
(kb
it/
s)
Average VoIP Connections
Average Throughput vs Average VoIP Connections
GSM.AMR G.723.1 G.711 G.729A 27.48
20.76
56.21
23.15
0 10 20 30 40 50 60
GSM.AMR G.723.1 G.711 G.729A
Av
er
ag
e
Pa
cke
t
Lo
ss
(
%)
Types of VoIP Codecs
Average Accumulative Packet Loss for VoIP Codecs
0 20 40 60 80 100
50 100 150 200 250 300 350 400 450 500
Av
er
ag
e
Pa
cke
t
Lo
ss
(
%)
Average VoIP Connections
Average Packet Loss vs Average VoIP Connections
[image:5.595.313.542.644.775.2]Figure 9: Average accumulative e2e throughput of VoIP codecs.
Table 2. VoIP codec effective transmission rate ratio.
Codec Type Effective Transmission Rate Ratio Min (%) Max (%)
GSM.AMR 46.72 89.82
G.723.1 32.11 60.54
G.711 9.43 43.79
G.729A 38.72 68.10
This paper also estimates the effective transmission rate as the ratio of measured throughput over source bit rate in term of percentage. Table 2 shows the range of minimum and maximum effective transmission rate ratios for all codec types. The minimum and maximum throughput data were collected from the NS-2 simulations and then compare against the codec source bit rate. The highest range of values is achieved by GSM.AMR codec which are between 46.72% and 89.82% while the lowest is G.711 codec which are between 9.43% and 43.79%. The effective transmission rate does not dictate that certain VoIP codec are the best or the worst but rather provides information to decide on which application does the codec can be used optimally (e.g. wired or wireless network, high or low audio quality, broadband or narrowband applications, etc.).
CONCLUSION AND FUTURE WORKS
The simulations study shows the e2e QoS performances for 5 different VoIP codec types transmitted over the best effort network system. The network scenario was designed with the standard parameters without specific QoS improvement modifications in order to closely match the real-world VoIP applications (i.e. multiple VoIP and background traffic connections are transmitted over the network system to produce more realistic services behaviors.
Firstly, the study shows that the G.729A produces the best performance in term of lower average accumulative e2e delays while the G.711 codec shows the opposite. All codec types except G.711 produce delays below 150 ms for all generated VoIP connections as recommended by the ITU for high quality audio communications. The G.711 mouth-to-ear delays are within the acceptable range and below the upper bound of 400 ms for general network planning. Secondly, the study shows that the G.723.1 produce the least jitter at lower average e2e VoIP connections and the highest jitter after 250 generated VoIP connections while the G.711 shows the opposite. The jitters for all codec types
are below the recommended 30ms of acceptable audio quality. Thirdly, the e2e loss ratios for all codec types except G.711 are less than 1% for average VoIP connections below 150. The G.723.1 codec shows the lowest of overall losses while the G.711 shows the highest after 50 average connections. For high quality audio quality transmission, it is recommended to keep the packet loss ratio to be below than 1%.
Fourthly, the G.711 codec shows the highest e2e throughput while the G.723.1 shows the opposite. The G.711 is mostly affected by the increment of VoIP connections while others show slow variation. This might be due to the differentiation of codec’s source bit rate characteristic. In term of average throughput over bit rate ratio, the GSM.AMR shows the highest performance which is between 46.72% and 89.82% of minimum and maximum values respectively. Fifthly, the overall QoS performances of G.729A in term of average e2e delay, jitter and loss ratio are better than the GSM.AMR in most cases of network dynamics.
This paper does not dictate the best VoIP codec for all types of applications but rather to provide a guideline for future researchers to design better QoS performances of VoIP system application. The future works aims at designing a QoS aware routing, scheduling and queuing schemes for Next Generation Internet (NGI) network system that can adaptively maintains each traffic type QoS requirements at optimum level. In addition, the VoIP protocols could also be enhanced with adaptive coding and modulation to suite with the network dynamic characteristics.
ACKNOWLEDGEMENT
The authors would like to thank the Ministry of Education Malaysia for the generous financial support under Research Acculturation Grant Scheme (R054).
REFERENCE
Andreozzi, M.M., Migliorini, D., Stea, G. and Vallati, C. (2010). Ns2Voip++, an adhanced module for VoIP simulations. Proceedings of 3rd International ICST
Conference on Simulation Tools and Technique, SIMUTools ’10, Malaga, Spain, article no. 50.
Ashouri, S., Khosraviroshkhari, H., Seno, S.A.H and
Moghaddam, M.H.Y. (2014). VoIP performance
comparison in wireless networks with different encryption methods. Proceedings of the 4th International Conference
on Computer and Knowledge Engineering (ICCKE 2014), Mashhad, Iran, pp. 753-757.
Bacioccola, A., Cicconetti, C. and Stea, G. (2007). User-level performance evaluation of VoIP using ns-2.
Proceedings of 2nd Performance Evaluation Methodologies
and Tools, ValueTools ‘07, Nantes, France, article no. 20.
Cocker, E., Ghazzi, F., Speidel, U., Dong, M.C., Wong, V., Vink, A.J.H., Yamamoto, H., Yokoo, H., Morita, H., Ferreira, H., Emleh, A., McFadzein, R., Palelei, S. and Eimann, R. (2014). Measurement of buffer requirement trends for real time traffic over TCP. Proceedings of the 15th
5.13
2.97
12.52
4.34
0 2 4 6 8 10 12 14
GSM.AMR G.723.1 G.711 G.729A
Av
er
ag
e
Th
ro
u
gh
p
u
t
(kb
it/
s)
Types of VoIP Codecs
[image:6.595.50.284.72.207.2]IEEE International Conference on High Performance Switching and Routing (HPSR 2014), Vancouver. Canada, pp.120-124.
Demichelis, C. and Chimento, P. (2002). IP packet delay variation metric for IP performance metrices (IPPM). RFC 3393.
El-brak, S., Bouhorma, M., and. Boudhir, A.A. (2011). VoIP over MANET (VoMAN): QoS & performance analysis of routing protocols for different audio codecs.
International Journal of Computer Applications, vol. 36, no. 12, pp. 22-26.
Harfoush, K., Bestavros, A. and Byers, J. (2000). Robust identification of shared losses using end-to-end unicast probe. Proceedings of the 8th IEEE International
Conference on Network Protocols, ICNP 2000, Osaka, Japan, pp. 22-33.
ITU-T Recommendation G.114 (2003). One-way
transmission time.
ITU-T Recommendation G.711 (1988). Pulse code modulation (PCM) of voice frequencies.
ITU-T Recommendation G.723.1 (2006). Dual rate speech coder for multimedia communications transmittingat 5.3 and 6.3kbit/s.
ITU-T Recommendation G.729 (2012). Coding of speech at 8 kbit/s using conjugate-structure algebraic-code-excited linear prediction (CS-ACELP).
ITU-T Recommendation H.323 (2009). Packet-based multimedia communications systems.
Kim, J., Niyaz, Q. and Javaid, A.Y. (2014). Performance evaluation of VoIP broadcasting over LTE for varying speeds and distances of mobile nodes. Proceedings of the IEEE International Symposium on Broadband Multimedia Systems and Broadcasting (BMSB 2014), Beijing, China, pp. 1-5.
Schulzrinne, H. and Casner, S. (2003). RTP profile for audio and video conferences with minimal control. RFC 3551.
Sjoberg, J., Westerlund, M., Lakaniemi, A. and Xie, Q. (2007). RTP payload format for the adaptive multi-rate (AMR) and adaptive multi-rate wideband (AMR-WB) audio codecs. RFC 4867.
Szigeti, T. and Hattingh, C. (2014). QoS design overview.