Journal of Chemical and Pharmaceutical Research, 2014, 6(2):695-699
Research Article
CODEN(USA) : JCPRC5
ISSN : 0975-7384
Uniform design and regression analysis for preparation of sodium
percarbonate by ethanol solventing-out process at room temperature
Chunhua Du
College of Chemistry & Pharmacy, Qingdao Agricultural University, Qingdao, People’s Republic of China
_____________________________________________________________________________________________
ABSTRACT
An efficient route to manufacture sodium percarbonate by using ethanol as the solventing-out agent is researched. The process conditions were optimized by means of multiindex uniform design and multiple regression method. Two models to express the effect of factors on active oxygen and yield of sodium percarbonate were established,
respectively. The final optimized conditions are as follows: temperature 20℃, reaction time 1h, mole ratio of
H2O2:Na2CO3 1.4, stabilizer molar ratio of sodium silicate: Ethylenediaminetetraacetic acid disodium salt 2:1,
amount of stabilizer 1%. IR and XRD identification denote that the major component of the prepared product is
Na2CO3·1.5H2O2. The photomicrograph indicates a majority of the obtained product crystals are club-shaped.
Keywords: sodium percarboante; solventing-out; uniform design; regression
_____________________________________________________________________________________________
INTRODUCTION
Sodium percarbonate (SPC) is a benign, water-soluble, and crystalline peroxygen compound, which is presented by the composition formula Na2CO3·1.5H2O2 or 2Na2CO3·3H2O2. It has a theoretical active oxygen concentration (AO) of 15.28% by weight. Sodium carbonate and hydrogen peroxide are released as SPC is dissolved in water. Owing to this characteristic, SPC finds widespread applications as disinfector[1], germicidal agent[1], moss and liverwort controlling agent[2], oxygen producing agent[3] ,bleaching agent[3], oxidizing agent[4], and so on.
The preparation methods of SPC, normally employing a reaction between hydrogen peroxide and sodium carbonate, are often classified as “dry process” and “wet process” and the latter is more widely used[3,5] .
Industrial sodium carbonate usually contains metals such as Fe, Mn, and Cu, which accelerate the decomposition of hydrogen peroxide. To restrain the catalytic effects of these metals, stabilizing agents are usually introduced into the reaction system. According to several published researches [5-7], sodium sulphate or sodium chloride is usually used as salting-out agents to obtain more SPC from the reaction system, which usually makes the product contain a quantity of sodium sulphate or sodium chloride.
Ethanol was used as solventing-out agent to obtain SPC without contaminated by chloride or sulphate in this work. This process doesn’t involve low temperature reacting and separating operations which are usually employed in traditional “wet process”. Multiindex uniform design and multiple regression was use to optimizing process conditions.
EXPERIMENTAL SECTION
Materials and Instrumentation
Kigaku, Japan) and FT-IR (FT-IR1730, Perkin-Elmer, America).
Preparation of SPC
To a solution of 100 ml hydrogen peroxide solution, a certain quantity of ethanol and stabilizers were introduced. The mixture was stirred until the stabilizers had been dissolved entirely. Then, 16.7g sodium carbonate was added into the reaction system every 10 minutes until the total amount attained to 66.8g. The reaction time was defined as the time from feeding end to settlement start. After settling for 1h, the wet SPC product was obtained from the reaction slurry by vacuum filtration and then was dried in a vacuum oven at 50 under the pressure of 160 mmHg. The yield (mass, g) and AO value of SPC are used to evaluate the experimental performance. The results of tentative experiments indicated that the SPC product with high AO value could be prepared in satisfying availability ratios of H2O2 and Na2CO3, under the following conditions: reaction temperature, 20 ; molar ratio of H2O2:Na2CO3, 1.4:1; stabilizer molar ratio, sodium silicate: Ethylenediaminetetraacetic acid disodium salt,2:1. These factors were fixed at corresponding levels.
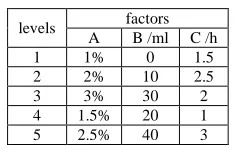
[image:2.595.247.365.330.405.2]In this work, the U5(53) uniform table[8] is employed to investigate the following three factors: (A) amount of stabilizers (wt %, counted by the mass of sodium carbonate) , (B) amount of solventing-out agent (ml), (C) reaction time (h). The factor and level settings are shown in Table 1. The experiment conditions and results are listed in Table 2. The significance tests of regression and factors on yield and AO are evaluated by means of the F-test, and the final optimized conditions are determined by regression equation analysis and multi-index comprehensive evaluation method[8].
Table 1. Experimental factors and levels
levels factors A B /ml C /h 1 1% 0 1.5 2 2% 10 2.5 3 3% 30 2 4 1.5% 20 1 5 2.5% 40 3
Analysis for SPC
The AO of SPC was titrated using potassium permanganate standard solution (with a mass fraction uncertainty of 0.2%). The carbonate was determined by sulfuric acid solution using phenolphthalein solution as the indicator as before (with a mass fraction uncertainty of 1.2%).
RESULTS AND DISCUSSION
Preparation of SPC
The uniform design scheme, experimental results and the consequences of regression analysis for yield and AO indexes are presented in Table 2-4, respectively.
Table 2. Results of U5(53) uniform experiments
no
factors yield /g
AO /%
Na2CO3 /% mole ratio of H2O2:Na2CO3
utilization rate / % A(1) B(2)/ml C(3)/h
x1 x2 x3 y1 y2 H2O2 Na2CO3
1 1 (1%) 2 (10) 4 (1) 75.16 14.09 68.08 1.37 75.01 76.60 2 2 (2%) 4 (20 ) 3 (2) 83.72 14.19 67.71 1.39 84.15 84.86 3 3 (3%) 1 (0 ) 2 (2.5) 59.51 13.93 67.70 1.36 58.72 60.31 4 4 (1.5%) 3 (30 ) 1 (1.5) 91.97 13.57 68.47 1.31 88.40 94.27 5 5 (2.5%) 5(40) 5 (3) 94.33 12.52 68.28 1.21 83.66 96.42
The yield of obtained SPC appears to vary markedly from 59.51 to 94.33g. The data were regressed in the model of y1=a+b1x1+b2x2+b3x3, y1=a+b2x2+b3x3, y1=a+b22x2
2
+b3x3, y1=a+b2x2+ b22x2 2
[image:2.595.97.515.558.637.2]Table 3. Results of regression on yield index
analysis of variance for multiple regression
variance source degree of freedom sum of square mean square F F0.01(3,1) significance F Significance testa
regression 3 801.321 267.107 19497 5403 0.00527 ** residual error 1 0.0137 0.0137
sum 4 801.335
analysis multiple correlation coefficients
variable coefficient P-value Significance testa
intercept 63.7208 0.003206
x2 1.4430 0.04892 *
x22 -0.01384 0.008643 **
x3 -1.6707 0.02385 *
regression equation (Ⅰ) y1 = 63.7208 + 1.4430x2 - 0.01384x22 - 1.6707x3
a If a regression or a variable is significant at the confidence level of 0.99 or 0.95 (that is , at the significance level of 0.01 or 0.05), the significance symbol of ** or * is given, respectively.
Table 4. Results of regression on AO index
analysis of variance for multiple regression
variance source degree of freedom sum of square mean square F F0.05(2,2) significance F Significance testa
regression 2 1.8198 0.9099 68.46 19.00 0.01440 * residual error 2 0.02658 0.01329
sum 4 1.8464
analysis multiple correlation coefficients
variable coefficient P-value Significance testa
intercept 13.8794 6.11E-05
x2 0.05631 0.04834 *
x22 -0.00224 0.01836 *
regression equation (Ⅱ) y2 = 13.8794 + 0.05631 x2- 0.00224x2
2
a If a regression or a variable is significant at the confidence level of 0.99 or 0.95 (that is , at the significance level of 0.01 or 0.05), the significance symbol of ** or * is given, respectively.
The AO value of obtained SPC appears to vary markedly from 12.52% to 14.19%. The data were fitted in the model of y2=a+b1x1+b2x2+b3x3, y2=a+b1x1+b2x2, y2=a+b2x2+b22x22, y2=a+b2x2+b22x22+b3x3 and other forms. Finally, the model in the form of y2=a+b2x2+b22x22was proved to be of significance at the confidence level of 0.95 and all the variable items (x2, x2
2
) were significant at the confidence level of 0.95. The amount of stabilizers and reaction time, that is, factor A and factor C, haven’t significant effect on AO index. Considering the production cost, they can be chosen as 1% and 1h, respectively. The regression analysis results are summarized in Table 4.
According to the above analysis, the obtained equations (Ι) and (II) can be used to predict the yield and AO value, respectively. It should be noted that the equations were obtained under above mentioned conditions: reaction temperature, 200C; molar ratio of H2O2:Na2CO3, 1.4:1; stabilizer molar ratio, sodium silicate: Ethylenediaminetetraacetic acid disodium salt , 2:1. According to equation (I), the yield of SPC declines with the increase of reaction time, and thus the feasible reaction time can be taken as the lowest value, that is, 1h. Thus, equation (I) can be simplified as equation (III) .
y1 = 62.0501 + 1.4430x2 - 0.01384x22 (III)
-5 0 5 10 15 20 25 30 35 40 45
12.0 12.2 12.4 12.6 12.8 13.0 13.2 13.4 13.6 13.8 14.0 14.2 14.4 active oxygen yield
amount of ethanol /g
60 65 70 75 80 85 90 95 100 y ie ld / g
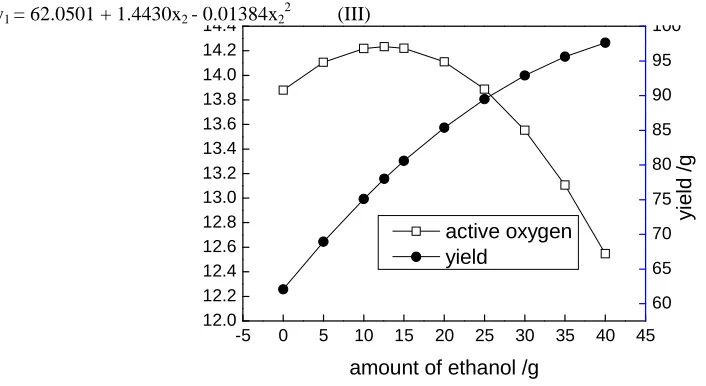
[image:3.595.75.428.551.744.2]According to equations (II) and (III), the predicted yield and AO values are shown in Figure 1. It can be seen that, in the beginning, the yield of SPC grows with the increase of the ethanol amount, but the increase trend is weaker when the amount attains to 30%. The AO value has a slightly increase when the amount of ethanol is slow. However, the AO value decreases sharply when the amount is higher than 20%. Based on these analyses, the amount of ethanol can be chosen as 30% or a slightly higher amount.
According to the above analysis, the final optimized conditions are as follows: temperature 20 ℃, reaction time 1h, mole ratio of H2O2:Na2CO3 1.4, stabilizer molar ratio of sodium silicate: Ethylenediaminetetraacetic acid disodium salt 2:1, amount of stabilizer 1%.
Under the optimized conditions, 92.17g SPC was obtained with the AO value of 13.62%. The product was used for micrography, IR and XRD identification.
Identification of SPC product
It is can be seen from Figure 2, a majority of obtained SPC crystals appear to be club-shaped.
Figure 2. Photomicrograph of sodium percarbonate product
IR spectra of the sample was investigated in KBr pellets and recorded in the range of 450-4000cm-1. The absorbed bands of the sample at 697,715,858 and 1447 cm-1 can be appointed to the CO32-. The absorbed bands at 871, 880, 957, 990, 1552, 2345, 2500, 2900 and 3050 cm-1 can be appointed to the H2O2. These observed bands are in agreement with the values of Na2CO3·1.5H2O2 published by Jones and Griffith[9].
The d values of eight most intense peaks and maximum d value at scattering angles (2θ) of 34.94o, 37.09o, 32.64o, 32.85o, 45.72o, 26.51o, 23.58o, 24.57o, and 11.22o, are 2.56, 2.42, 2.75, 2.73, 1.98, 3.37, 3.78, 3.63, and 7.91, respectively, which are in relative agreement with the data reported by PDF card (no 11-656) corresponding to Na2CO3·1.5H2O2.
According to the above discussion, the major component of the sample is Na2CO3·1.5H2O2 and a majority of crystals are club-shaped.
CONCLUSION
An efficient route to manufacture sodium percarbonate by using ethanol as a solventing-out agent instead of sodium sulphate or sodium chloride is researched. The process conditions were optimized by means of multiindex duniform design. Two models to express the effect of factors on active oxygen and yield of sodium percarbonate were established by multiple nonlinear regression. The final optimized conditions are as follows: temperature 20 ℃, reaction time 1h, mole ratio of H2O2:Na2CO3 1.4, stabilizer molar ratio of sodium silicate: Ethylenediaminetetraacetic acid disodium salt 2:1, amount of stabilizer 1%. IR and XRD identification denote that the major component of the prepared product is Na2CO3· 1.5H2O2. The photomicrograph indicates the obtained product crystals are club-shaped, in the main.
Acknowledgements
21346010, 50874099 and 29966002).
REFERENCES
[1] YY Chen, XC Wu, J Gu. Chin. J. Disinfection,1999,12(2):109-111(In Chinese) [2]RA Larose. Process for controlling moss and liverwort. USP 7368121 B2, 2008-05-06 [3] XM Chen, DZ Chen. Chem. Ind. Eng. Prog, 2009,28(2):292-296. (In Chinese) [4] MV Gómez, R Caballero, E Vázquez, et al. Green chem, 2007,9,331-336 [5] KS Zhang, FC Zeng F. Inorg. Chem. Ind, 2005,37(6):18-20. (In Chinese) [6] HK Zhao, C. Tang, DS Zhang, et al. J. Chem. Eng. Data,2006, 51:676–679.. [7] HK Zhao, C. Tang, DS Zhang, et al. J. Chem. Eng. Data,2006, 51: 1567–1570.
[8] YY Li, CR Hu . Experiment Design and Data Processing, 1st Edition, Chemical Industry Press, Beijing, 2009, 89-100,162-169(In Chinese).