Open Access
Research article
The association between renal function and structural parameters:
a pig study
Anders B Lødrup
†1,2, Kristian Karstoft
†1,2, Thomas H Dissing
3,
Jens R Nyengaard
2and Michael Pedersen*
1,3Address: 1MR Research Center, Aarhus University, Aarhus, Denmark, 2Stereology and Electron Microscopy Research Laboratory and MIND Centre,
Aarhus University, Aarhus, Denmark and 3Institute of Clinical Medicine, Aarhus University, Aarhus, Denmark
Email: Anders B Lødrup - [email protected]; Kristian Karstoft - [email protected]; Thomas H Dissing - [email protected]; Jens R Nyengaard - [email protected]; Michael Pedersen* - [email protected]
* Corresponding author †Equal contributors
Abstract
Background: The objective was to investigate the association between renal structural parameters and renal function. The structural parameters were renal cortical volume, total renal volume, number of glomeruli, and total glomerular volume, and renal function was expressed by the single kidney GFR (skGFR). Investigations were performed using both healthy and chronically diseased kidneys. We investigated which of the structural parameters showed the best correlation to renal function and evaluated the possibility of predicting the renal function from structural parameters.
Methods: Twenty-four pigs, twelve with healthy kidneys and twelve with diseased kidneys, underwent skGFR measurements. Nephrectomies were performed and structural parameters were estimated using stereological procedures. The correlation between the structural parameters and skGFR was analysed by Pearson's correlation test. The prediction of skGFR from structural parameters was analysed by a linear regression test.
Results: In general, we demonstrated a good correlation between structural parameters and skGFR. When all kidneys were evaluated together Pearson's correlation coefficient between skGFR and any stereological parameter was above 0.60 and highly significant (p < 0.001), and with r-values ranging from 0.62 regarding number of glomeruli, to 0.78 regarding cortical volume. The best correlation was found between cortical volume and skGFR. Prediction of single kidney GFR from any structural parameter showed to be quite imprecise.
Conclusion: The observed correlations between structural parameters and renal function suggest that these parameters may potentially be useful as surrogate markers of the renal function. At present, however, precise prediction of renal function based on a single structural parameter seems hard to obtain.
Published: 23 December 2008
BMC Nephrology 2008, 9:18 doi:10.1186/1471-2369-9-18
Received: 19 August 2008 Accepted: 23 December 2008
This article is available from: http://www.biomedcentral.com/1471-2369/9/18 © 2008 Lødrup et al; licensee BioMed Central Ltd.
Background
The pathology of chronic kidney disease usually involves structural and functional changes, often interconnected, and according to the hyperfiltration theory, as proposed by Brenner et al, a reduction in the number of glomeruli (N(glom)) leads to hemodynamic changes associated with glomerular hypertension, hyperfiltration and pro-teinuria [1].
The relationship between renal structural and functional parameters is still not fully understood. Widjaja et al con-cluded that three-dimensional structural parameters such as total kidney volume (V(total)) correlates better to the kidney function than two-dimensional structural parame-ters [2]. Volume of cortex (V(cor)) has been shown to diminish over time in patients with chronically injured kidneys [3]. N(glom) has been shown to determine the long time allo-graft outcome [4] and the renal filtration capacity in diabetic patients has been shown to correlate to the total surface area of the glomerular capillaries in the kidney [5]. In a study involving renal allograft biopsies from lean and obese donors, the latter presented a greater glomerular volume (V(glom)) and an increased GFR, sug-gesting a correlation between the two parameters [6]. In patients with insulin-dependent diabetes mellitus (IDDM) and albuminuria, V(glom) was significantly increased, something not seen in IDDM patients without albuminuria [7]. In accordance with this, a negative corre-lation has been demonstrated between N(glom) and severe diabetic glomerulonephropathy [8].
Hence, different studies have described the relationship between renal structural parameters and kidney function, but to our knowledge, no studies have evaluated which of the above mentioned structural parameters shows the best correlation to kidney function.
In this study the objective was to investigate the correla-tion between the quantitative parameters V(cor), V(total), N(glom), and V(glom) and the renal function for healthy as well as chronically diseased pig kidneys, and, in rela-tion to this, determine which of the structural parameters showed the best correlation to renal function. Secondly, the objective was to evaluate the possibility of predicting skGFR from structural parameters.
Our choice of methods was determined by the need for reproducible, valid and unbiased results. Total unilateral ureteral obstruction followed by relief (UUO) was per-formed in some pigs, and the obstructed kidneys (UUOipsi) as well as the opposite kidneys (UUOcontra) were analysed. In addition, kidneys from healthy pigs were analysed (Controls). Kidney function was estimated as single kidney GFR (skGFR) by direct determination of clearance of 51chromium ethylenediaminetetraacetic acid
(Cr-EDTA). The structural parameters V(cor), V(total), N(glom) and V(glom) were estimated by the use of design-based stereology (stereological parameters).
Methods
Animal handling
Danish Landrace female pigs (n = 24) weighing 29.5 ± 2.3 kg were included in the study. Premedication was at all experimental days given using an im injection of keta-mine (10 mg/kg) and midazolam (0.5 mg/kg). The pigs were then intubated with a cuffed endotracheal tube and ventilated using a volume-controlled Servo-ventilator (Siemens, Solna, Sweden) with a gaseous mixture of N20 and 02 (2:1). Anaesthesia was maintained with isoflurane (1.5%) throughout the entire experimental procedure. The animals were allocated into two groups subjected to either UUO (n = 12) or no surgical procedure (Controls) (n = 12).
Surgical procedures
Pigs subjected to UUO underwent the following experi-mental procedure: MRI and serum creatinine analysis was performed to ensure that the animal did not present renal abnormalities. The surgical procedures were then advanced by a 4–7 cm subcostal flank incision randomly on the left (n = 6) or right (n = 6) side, the muscle layers were divided, and the ureter was found retroperitoneally. Obstruction was performed using a silicone tube (duode-nal feeding tube CH 14, ∅ = 3.0 mm) cut to a length of 3 cm, wrapped around the proximal part of ureter and fix-ated using ligatures. Seven days later UUO was verified with ultrasonography, showing the presence of hydrone-phrosis. After that, the obstruction was relieved: The flank incision was opened, the muscle layers were divided, the ligations of the tube were cut through, and the tube was removed. Seven weeks later, each animal underwent skGFR-measurements followed by laparotomic operation including biopsy withdrawel and nephrectomy. Subse-quently, the pig was sacrificed. Pigs in the control group underwent investigations equivalent to the procedure for the UUO pigs at the last examination day. The establish-ment and removal of UUO was performed under sterile conditions.
The study complied with the national regulations for care and use of experimental animals, and the Danish national board regarding animal experiments approved the proto-col.
skGFR measurements
to catheterize the ureter. A ligature was placed around ure-ter and the tube in order to obtain patent drainage by the tube. This procedure was performed bilaterally. An arterial entrance was achieved in the profound (deep) femoral artery using an arterial sheath (Radiofocus Introducer II; Terumo, Leuven, Belgium) a.m. Seldinger for blood sam-pling and monitoring of arterial blood pressure.
Clearance of Cr-EDTA was used to measure skGFR. 3 MBq was injected as a bolus, followed by continuous infusion (2 MBq/h). The following hour was considered as a load-ing phase to stabilize the plasma concentration of Cr-EDTA. After this, urine was collected every 30 min for 2 h. A blood sample (4 ml) was taken every time a new collec-tion of urine started, and by the end of the last urine col-lection. Blood samples were taken in a heparinized glass and centrifuged to isolate plasma. The mass of urine was estimated for each sample, and the volume was calculated using the assumption that the density of urine was 1 g/ml. Respective 2 ml of plasma and 0.1 ml of urine were diluted with 1.9 ml isotonic saline and analysed with a gamma counter (Packard Cobra II; Perkin-Elmer, Salem, MA). skGFR were calculated using the equation:
skGFR = (Flowurine·Curin)/Cplasma (1)
Stereological procedures
Nephrectomy was performed, and the kidney was per-fusion-fixed through the renal artery. First, the kidney was flushed with 200 ml of phosphate buffer to drain blood from the kidney. Secondly, the kidney was flushed with phosphate-buffered formaldehyde (4%) using a peristal-tic pump (250 ml/min) for approximately 5 min. The kid-ney was then immersion-fixed in phosphate-buffered formaldehyde (4%).
Estimation of kidney volumes
Each kidney was transversally cut into slabs of 3 mm with a random initial cutting location, and every fifth slab was sampled with a random start to prevent bias (between 6 and 8 slices were sampled per kidney). A transparent point grid was put on top of each slab, and the number of points (P) hitting cortex/whole kidney was noted for all slabs. Cortex was defined macroscopically, and renal vol-umes (V(cor) and V(total)) were estimated by Cavalieri's principle using the following equation:
V(cor or total) = Σ P(cor or total)·a(point)·t (2)
where a(point) is the area pr. point and t is the slice thick-ness [9].
N(glom) by physical fractionator
Kidney slabs were cut into blocks (1–16) from which one was sampled and embedded in plastic. Two slices, 30 μm
thick, was cut from each block and put on glass slides and stained with Mayers haematoxylin. The slices made up a fraction of 1/41 of a block due to shrinkage during plastic embedding. For sampling of glomeruli we used the anal-ysis software CAST (Visiopharm, Hørsholm, Denmark) and an Olympus BX50 microscope with a SIS-1 digital camera (Olympus Soft Imaging Solutions GmbH, Mün-ster, Germany) and ×90 magnification. The microscope stage could be moved by a motor in predetermined, equi-distant steps in two orthogonal directions, allowing the counting frame to cover a known fraction of the two slices, denoted the sampling section and the look-up section. Knowing the area of the counting frame, a(frame), and the length of the equidistant steps, dx and dy, the area sam-pling fraction (ASF) could be estimated as:
where a(frame) = 291·104 μm2, dx and dy = 4500 μm,
resulting in ASF = 1/7. The total number of' glomeruli in one kidney was calculated as the sum of sampled glomer-uli from all blocks multiplied with the inverse fractions:
Where ∑Q
-block is the number of glomeruli sampled from
all blocks. Since glomeruli were sampled from both sam-ple- and look-up section the area of the actual counting frame was 2·a(frame), and therefore ∑Q
-block was divided
with 2. The fraction 1/5 refers to the sampling of every fifth kidney slab, [1/1–1/16] to the sampling of kidney blocks (causing variable sampling fractions), 1/41 to the sampling of kidney slices and 1/7 to the sampling of area (using the counting frame).
V(glom) by test point system, V(glom)TPS
We estimated the volume density of glomeruli, Vv(glom/ cor), by point counting on 3 μm thick slices of renal cor-tex. Using the software CAST a test point system was dis-played on a computer monitor together with live images of the slices, sampled by SURS. Test points hitting glomer-ular tuft, P(glom), and cortex (glomeruli included), P(cor), were sampled, and Vv(glom/cor) could be calcu-lated as:
where p(glom) and p(cor) were number of test points per field-of-view used to sample glomeruli and cortex and were 30 and 48. The parameters dx and dy were each set to 5000 μm. From knowledge of the total volume of renal
ASF a frame dx dy
=
(
)
⋅ (3)
N glom
(
)
kidney = ∑Qblock− ⋅ ⋅ ⎡⎣⎢ ⎤ ⎦⎥⋅ ⋅ − 2 1 5 1 1 1 16 1 41 1 7 1 ( ; ) (4)
Vv(glom/cor) P glom p cor P cor p glom
= ∑
(
)
⋅(
)
(
)
⋅(
)
cortex, the total volume of glomeruli in renal cortex was calculated:
V(glom) = VV(glom/cor)·V(cor) (6)
Statistics
As described, four successive time periods were used to measure skGFR. From these four periods, four separate estimates of skGFR were obtained. These estimates were analysed for outliers using Dixons test for extreme values, considering the tested value an outlier if the test quotient was above 0.765 (p < 0.05) [10]. After removing outliers, the skGFR period estimates were pooled to obtain an adjusted mean of skGFR.
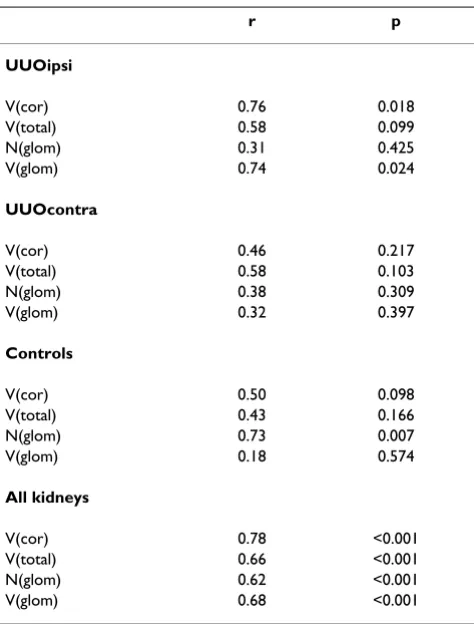
To assure statistical independence between kidney groups in the case where both kidneys from one animal were used (UUOipsi and UUOcontra), the stereological param-eters from the two kidney groups were compared by Pear-son's correlation test. In no cases, this test indicated statistically acceptable correlation and therefore both kid-neys were analysed. To evaluate methodological uncer-tainties, the coefficient of error (CE) was measured for each of the stereological parameters. The correlation between the stereological parameters and skGFR was ana-lysed by Pearson's correlation test. The prediction of skGFR from stereological parameters was analysed by a linear regression test, from which graphs were performed showing the best prediction, as well as 95% safety and prediction intervals.
Results
In the UUO group, two pigs were excluded due to congen-ital ureteral obstruction, and one pig died due to cardiac arrest during the experimental procedure. This resulted in 30 kidneys successfully used for functional and stereolog-ical measurements.
skGFR measurements
The mass of urine for each sample was 9.7 – 154.4 g with a mean mass of 60.6 g and a median mass of 53.0 g. Five skGFR period estimates were found to be outliers and therefore excluded. The excluded values contained two periods estimates from the UUOipsi group and three from the UUOcontra group. Hereafter, the range of mean skGFR was 9.6 – 21.8 ml/min with a mean of 15.7 ml/min for UUOipsi, 18.9 – 30.2 ml/min with a mean of 24.9 ml/ min for UUOcontra and 16.0 – 48.7 ml/min with a mean of 31.9 ml/min for the Controls.
Correlation of stereological parameters to skGFR
Single kidney values concerning V(cor), V(total), N(glom), V(glom) and adjusted average of skGFR are shown in Table 1. The range was 36.2 – 85.1 cm3 for
V(cor), 57.2 – 115.6 cm3 for V(total), 1.02·106– 2.07·106
for N(glom) and 881 – 2039 mm3 for V(glom).
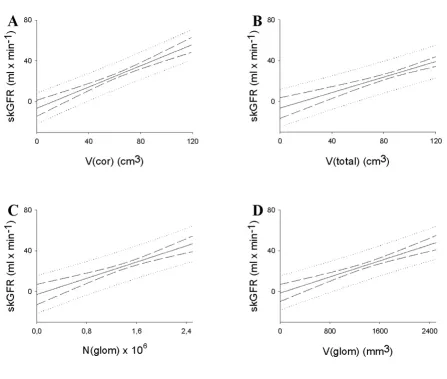
skGFR are plotted as a function of the stereological param-eters in Figure 1. The results of the statistical correlations between the stereological parameters and skGFR are shown in Table 2, both stratified according to interven-tion, as well as pooled. For the UUO ipsilateral group V(cor) and V(glom) both showed significant positive cor-relations to skGFR, respectively (p < 0.05), whereas V(total) and N(glom) did not. In the UUO contralateral group none of the measured morphological parameters correlated significantly to skGFR, and in the control group N(glom) as the only parameter showed significant corre-lation. With the kidneys pooled, all of the measured mor-phological parameters correlated significantly to skGFR (p < 0.001), with r-values ranging from 0.62 for N(glom) to 0.78 for V(cor).
Prediction of skGFR using stereological parameters The prediction graphs are shown in Figure 2. The equa-tions for the best prediction lines were as follows:
skGFR = 0.618 ml/min/cm3·V(cor) - 12.9 ml/min (7)
skGFR = 0.487 ml/min/cm3·V(total) - 15.9 ml/min
(8)
skGFR = 21.7 ml/min·10-6·N(glom) - 5.8 ml/min
(9)
skGFR = 0.02 ml/min/cm3·V(cor) - 2.5 ml/min
(10)
Precision of estimates
The total variation (CV(total)) for skGFR varied between 3% and 60% (data not shown). CV(total) of the stereolog-ical estimates were 25% and 18% for V(cor) and V(total), 19% for N(glom) and 13% for V(glom). CV(total) results from biological and methodological variance. The latter, expressed as the coefficient of error (CE), was 1% for V(cor) and V(total), and 9% for N(glom) and V(glom). Biological variance was 25% and 18% for V(cor) and V(total), 16% for N(glom) and 9% for V(glom). The ratio CE2/CV(total)2 was used as a parameter of the impact CE
Discussion
Generally, we demonstrated a good correlation between structural parameters and skGFR. When all kidneys were evaluated together Pearson's correlation coefficient between skGFR and any stereological parameter was above 0.60 and highly significant (p < 0.001). The best correlation was found between V(cor) and skGFR. How-ever, none of the structural parameters showed a signifi-cant correlation to skGFR in either group. A plausible explanation for this may be that the kidneys within a spe-cific group varied relatively little with regards to structural parameters. Another explanation may be imprecision of skGFR period estimates (data not shown): five of the skGFR period estimates differed to such an extent they were classified as outliers. Different reasons may be responsible for this. The tubes used for urine collection
contained approximately 3 ml of urine constantly, indi-cating that this amount of urine actually belonging to one period was left over for the next period. In addition, a quantity of urine might have been contained in the pelvis and upper ureter above the tube, due to reduced peristaltic activity in pelvis and ureter or transient clots in the tube, subsequently leading to a false low skGFR value in the first of these two periods, and a false high skGFR value in the second of the two periods. Furthermore, the differences found might derive from radioactive contamination of blood and urine samples leading to false low and false high GFR measurements, and imprecision with regards to measuring volumes and weight of urine and blood. Thus, double determinations of radioactive samples were per-formed in this study to avoid failures like these. Finally, Table 1: Stereological and skGFR values of kidneys.
Kidney no V(cor) (cm3) V(total) (cm3) N(glom) (×106) V(glom) (mm3) skGFR (ml/min)
UUOipsi
#1 36.2 57.2 1.05 881 9.6
#2 41.1 77.8 1.10 996 15.1
#3 43.1 71.1 1.59 957 11.1
#4 42.9 61.9 1.11 1161 15.3
#5 59.3 80.8 1.75 1199 18.0
#6 58.9 88.7 1.32 1202 15.6
#7 49.7 71.4 1.02 1000 18.6
#8 46.9 75.0 1.17 1084 16.0
#9 58.3 81.4 1.62 1231 21.8
Mean 48.5 73.9 1.30 1079 15.7
UUOcontra
#1 64.3 80.6 1.13 1241 19.8
#2 69.9 94.1 1.67 1632 30.2
#3 66.4 90.9 1.26 1315 18.9
#4 67.7 88.7 1.46 1527 27.9
#5 62.8 83.1 1.47 1454 21.4
#6 63.8 84.8 1.35 913 25.7
#7 64.7 87.8 1.24 979 25.5
#8 65.6 93.6 1.39 1514 30.1
#9 69.4 94.3 1.98 1452 24.7
Mean 66.1 88.6 1.44 1336 24.9
Controls
#1 54.9 70.7 1.43 1621 16.0
#2 60.8 77.7 1.43 1889 29.2
#3 78.1 104.2 1.92 1953 48.7
#4 66.3 96.1 1.47 1995 25.5
#5 61.1 75.1 1.34 1237 35.8
#6 83.2 115.6 1.69 1590 34.7
#7 74.4 93.5 1.47 1418 32.2
#8 76.2 97.9 2.07 2039 47.1
#9 66.3 86.5 1.22 1726 32.1
#10 80.6 104.9 1.90 1601 39.6
#11 58.5 74.6 1.60 1261 36.3
#12 85.1 108.6 1.31 1528 29.7
Mean 70.4 92.1 1.57 1655 33.9
some biologic variation of skGFR over time should be considered.
A study by D'Souza et al showed an excellent correlation between V(cor) and skGFR (r = 0.86) [12]. Widjaja et al found that renal length and V(total) both correlated to skGFR in patients with suspected renal artery stenosis, r = 0.75 for V(total) and r = 0.69 for renal length [2]. Consid-ering our findings (r = 0.78 for V(cor) and r = 0.66 for V(total)) and the above mentioned study by D'Souza, it seems reasonable that V(cor) correlates better to skGFR than V(total) and renal length.
The capillary tuft has a rather complex three-dimensional configuration which may change with the size of the glomerulus. Also, the efficacy of the filtration membrane may differ accordingly. So which would give the highest skGFR, many small or a few big glomeruli, is not a ques-tion that can be answered intuitively. And this is also reflected in the correlations to skGFR. We found a trend towards V(glom) having the strongest correlation to skGFR when all pigs were evaluated as one group (0.68 for V(glom) and 0.62 for N(glom)). However, N(glom) was the only parameter which showed significant correlation to skGFR within the control group. Ureteral obstruction may have altered the filtration membrane, perhaps in Single-kidney glomerular filtration rate, skGFR, plotted as a function of the morphological parameters
Figure 1
both UUOipsi and UUOcontra, and this may have inter-rupted the straightforward relationship between N(glom) and skGFR. However, the imprecision of the skGFR period estimates reduces this to speculations.
Our findings are partly in accordance with findings reported by Fulladosa et al which found a correlation between N(glom) and GFR using biopsies from renal transplants (r = 0.42, P = 0.002) [13]. In a study by Alme-ida et al maternal gestational calorie-protein restriction was associated with a lower N(glom) and a decreased GFR in adult hypertensive rats compared to adult offspring from normally fed mothers, suggesting that the correla-tion shown in our study also corresponds to poorly devel-oped kidneys [14].
All of the reported structural parameters were obtained in a design-based manner, which is the golden standard in stereology, as opposed to the way in which similar param-eters are obtained in the clinic. The correlation between renal anatomy and function in humans may attract spe-cific interest to the measurements of V(cor), because this parameter can be assessed non-invasively with high preci-sion using MRI [15,16]. This is not (yet) possible for either
N(glom) or V(glom), where kidney biopsies are needed [13,17]. However, the qualitative information obtained with a kidney biopsy is also an important supplement to the estimations of N(glom) or V(glom).
In this study, a UUO-model was used to imitate a chronic kidney disease and reduce the renal function. UUO-mod-els have previously been used in other studies and are known to be associated with reductions in renal function [18,19]. The measured stereological parameters V(cor), V(total), N(glom), and V(glom), all indicated that UUO made an irreversible damage to the kidney (Table 1).
No comparisons of structural parameters and skGFR were made between pigs subjected to UUO and Controls since they were obtained from different litters.
As seen in Figure 2, the confidence intervals offered rela-tively narrow measurements, especially around the mean stereological values. The prediction intervals, however, presented wide measurements, indicating large uncertain-ties with regards to predicting skGFR from any stereologi-cal parameter, presumably due to imprecise skGFR measurements.
This experimental study confirms that a precise prediction of renal function from a single stereological parameter appears difficult to obtain. If another parameter that cor-relates well to renal function could be found independ-ently from the stereological parameters, a multivariate prediction analysis hereby could be performed, and pre-cise predictions would perhaps be possible.
Conclusion
The correlations between the structural parameters and the kidney function in healthy as well as in chronically injured kidneys, suggest that these parameters in the future may be used as surrogate markers of kidney func-tion. Even single kidney function may be estimated, an interesting feature considering the present use of radioiso-tope techniques for evaluating split kidney function. Which clinical compounds of kidney disease that may be monitored by these parameters is a challenge for future investigation. Furthermore, additional studies are needed to elucidate whether our findings can be extrapolated to human beings.
Competing interests
The authors declare that they have no competing interests.
Authors' contributions
ABL and KK participated in the design of the study, carried out the experiments, made the data analysis and statistical analysis and drafted the manuscript. THD participated in the design of the study, and assisted and supervised in the Table 2: Stereological parameters vs skGFR (Pearson's test).
r p
UUOipsi
V(cor) 0.76 0.018
V(total) 0.58 0.099
N(glom) 0.31 0.425
V(glom) 0.74 0.024
UUOcontra
V(cor) 0.46 0.217
V(total) 0.58 0.103
N(glom) 0.38 0.309
V(glom) 0.32 0.397
Controls
V(cor) 0.50 0.098
V(total) 0.43 0.166
N(glom) 0.73 0.007
V(glom) 0.18 0.574
All kidneys
V(cor) 0.78 <0.001
V(total) 0.66 <0.001
N(glom) 0.62 <0.001
V(glom) 0.68 <0.001
performance of the animal experiments as well as the data analysis. JRN participated in the design of the study, assisted and supervised in the stereological investigations, and contributed to the data interpretation and analysis as well as the statistical analysis. MP participated in the design of the study, performed the fundraising, assisted and supervised in the data interpretation and analysis, supervised the statistical analysis and manuscript writing.
All authors read and approved the final manuscript.
Acknowledgements
The study was supported from the Danish Medical Research Council (Grant # 22-05-0015), the Beckett Foundation, Aarhus University Founda-tion, the Novo Nordisk FoundaFounda-tion, the Foundation of 17-12-1981, the Foundation of Eva & Henry Frænkel, the Foundation of Alice Brenaa, and
the Danish Council for Strategic Research. MIND Centre is supported by Lundbeck Foundation.
References
1. Brenner BM, Lawler EV, Mackenzie HS: The hyperfiltration the-ory: a paradigm shift in nephrology. Kidney Int 1996,
49:1774-1777.
2. Widjaja E, Oxtoby JW, Hale TL, Jones PW, Harden PN, McCall IW:
Ultrasound measured renal length versus low dose CT vol-ume in predicting single kidney glomerular filtration rate. Br J Radiol 2004, 77:759-764.
3. Mounier-Vehier C, Lions C, Devos P, Jaboureck O, Willoteaux S, Carre A, Beregi JP: Cortical thickness: an early morphological marker of atherosclerotic renal disease. Kidney Int 2002,
61:591-598.
4. Mackenzie HS, Tullius SG, Heemann UW, Azuma H, Rennke HG, Brenner BM, Tilney NL: Nephron supply is a major determinant of long-term renal allograft outcome in rats. J Clin Invest 1994,
94:2148-2152.
5. Hirose K, Tsuchida H, Østerby R, Gundersen HJ: A Strong Corre-lation between Glomerular Filtration Rate and Filtration Prediction of single-kidney glomerular filtration rate, skGFR, from the morphological parameters
Figure 2
Publish with BioMed Central and every scientist can read your work free of charge "BioMed Central will be the most significant development for disseminating the results of biomedical researc h in our lifetime."
Sir Paul Nurse, Cancer Research UK
Your research papers will be:
available free of charge to the entire biomedical community
peer reviewed and published immediately upon acceptance
cited in PubMed and archived on PubMed Central
yours — you keep the copyright
Submit your manuscript here:
http://www.biomedcentral.com/info/publishing_adv.asp
BioMedcentral Surface in Diabetic Kidney Hyperfunction. Laboratory
Investiga-tion 1980, 43:434-437.
6. Rea DJ, Heimbach JK, Grande JP, Textor SC, Taler SJ, Prieto M, Lar-son TS, Cosio FG, Stegall MD: Glomerular volume and renal his-tology in obese and non-obese living kidney donors. Kidney Int 2006, 70:1636-1641.
7. Østerby R, Asplund J, Bangstad HJ, Nyberg G, Rudberg S, Viberti G, Walker JD: Glomerular volume and the glomerular vascular pole area in patients with insulin-dependent diabetes melli-tus. Virchows Arch 1997, 431:351-357.
8. Bendtsen TF, Nyengaard JR: The number of glomeruli in type 1 (insulin-dependent) and type 2 (non-insulin-dependent) dia-betic patients. Diabetologia 1992, 35:844-850.
9. Nyengaard JR: Stereologic methods and their application in kidney research. J Am Soc Nephrol 1999, 10:1100-1123.
10. Dixon WJ: Processing data for outliers. Biometrics 1953, 9:74-89. 11. Gundersen HJ, Jensen EB, Kieu K, Nielsen J: The efficiency of sys-tematic sampling in stereology – reconsidered. J Microsc 1999,
193:199-211.
12. D'Souza RC, Kotre CJ, Owen JP, Keir MJ, Ward MK, Wilkinson R:
Computed tomography evaluation of renal parenchymal volume in patients with chronic pyelonephritis and its rela-tionship to glomerular filtration rate. Br J Radiol 1995,
68:130-133.
13. Fulladosa X, Moreso F, Narvaez JA, Grinyo JM, Seron D: Estimation of total glomerular number in stable renal transplants. J Am Soc Nephrol 2003, 14:2662-2668.
14. Almeida JR, Mandarim-de-Lacerda CA: Maternal gestational pro-tein-calorie restriction decreases the number of glomeruli and causes glomerular hypertrophy in adult hypertensive rats. Am J Obstet Gynecol 2005, 192:945-951.
15. Karstoft K, Lødrup AB, Dissing TH, Sørensen TS, Nyengaard JR, Ped-ersen M: Different strategies for MRI measurements of renal cortical volume. J Magn Reson Imaging 2007, 26:1564-1571. 16. Coulam CH, Bouley DM, Sommer FG: Measurement of renal
vol-umes with contrast-enhanced MRI. J Magn Reson Imaging 2002,
15:174-179.
17. Lødrup AB, Karstoft K, Dissing TH, Nyengaard JR, Pedersen M: Kid-ney biopsies can be used for estimations of glomerular number and volume: a pig study. Virchows Arch 2008,
24:393-403.
18. Hvistendahl JJ, Pedersen TS, Jørgensen HH, Rehling M, Frøkiær J:
Renal hemodynamic response to gradated ureter obstruc-tion in the pig. Nephron 1996, 74:168-174.
19. Dissing TH, Eskild-Jensen A, Pagh C, Frøkiær J, Rehling M, Jørgensen HS, Jørgensen TM, Djurhuus JC: Partial unilateral ureteropelvic junction obstruction induced in 2-week-old piglets. J Urol 2001, 166:2354-2358.
Pre-publication history
The pre-publication history for this paper can be accessed here: