BioMed Central
Open Access
Page 1 of 13
(page number not for citation purposes)
Environmental Health
Review
High ambient temperature and mortality: a review of
epidemiologic studies from 2001 to 2008
Rupa Basu
Address: California Office of Environmental Hazard Assessment, Air Pollution Epidemiology Section, Oakland, California, USA
Email: Rupa Basu - [email protected]
Abstract
Background: This review examines recent evidence on mortality from elevated ambient temperature for studies published from January 2001 to December 2008.
Methods: PubMed was used to search for the following keywords: temperature, apparent temperature, heat, heat index, and mortality. The search was limited to the English language and epidemiologic studies. Studies that reported mortality counts or excess deaths following heat waves were excluded so that the focus remained on general ambient temperature and mortality in a variety of locations. Studies focusing on cold temperature effects were also excluded.
Results: Thirty-six total studies were presented in three tables: 1) elevated ambient temperature and mortality; 2) air pollutants as confounders and/or effect modifiers of the elevated ambient temperature and mortality association; and 3) vulnerable subgroups of the elevated ambient temperature-mortality association. The evidence suggests that particulate matter with less than 10 um in aerodynamic diameter and ozone may confound the association, while ozone was an effect modifier in the warmer months in some locations. Nonetheless, the independent effect of temperature and mortality was withheld. Elevated temperature was associated with increased risk for those dying from cardiovascular, respiratory, cerebrovascular, and some specific cardiovascular diseases, such as ischemic heart disease, congestive heart failure, and myocardial infarction. Vulnerable subgroups also included: Black racial/ethnic group, women, those with lower socioeconomic status, and several age groups, particularly the elderly over 65 years of age as well as infants and young children.
Conclusion: Many of these outcomes and vulnerable subgroups have only been identified in recent studies and varied by location and study population. Thus, region-specific policies, especially in urban areas, are vital to the mitigation of heat-related deaths.
Background
Although many studies of temperature have been con-ducted in other disciplines such as climatology, they have received greater attention in epidemiology in the past few years. In 2002, a comprehensive epidemiologic review by Basu and Samet [1] summarized the findings from studies
examining mortality from elevated ambient temperature and heat waves. Most of the evidence at that time was based on studies following heat waves. Several studies have been conducted more recently using modern statisti-cal approaches, consisting primarily of the time-series and case-crossover approaches. While other reviews have been
Published: 16 September 2009
Environmental Health 2009, 8:40 doi:10.1186/1476-069X-8-40
Received: 24 February 2009 Accepted: 16 September 2009
This article is available from: http://www.ehjournal.net/content/8/1/40
© 2009 Basu; licensee BioMed Central Ltd.
Environmental Health 2009, 8:40 http://www.ehjournal.net/content/8/1/40
Page 2 of 13
(page number not for citation purposes)
conducted more recently on heat and mortality, the focus has been on methodological issues and approaches [2] and on climatology [3], leaving a number of important epidemiologic studies excluded. Many studies of ambient temperature and mortality did not account for air pollut-ants, and in the previous review [1], it was not clear from the few studies conducted whether air pollutants acted as confounders, effect modifiers, or both. It is critical to sep-arate the independent effects of both ambient tempera-ture and air pollutants, since they may often influence each other on a daily basis. Thus, the actual association between ambient temperature and mortality can be observed, only after accounting for pollutants in the mod-els with ambient temperature. Furthermore, demographic characteristics, such as poverty and age, can modify the severity of heat effects through various physiological and behavioral pathways. Thus, certain subgroups may be par-ticularly vulnerable to heat effects, and identifying them for specific locations would be beneficial for targeting public health interventions.
Here, the epidemiologic evidence from the past decade of high ambient temperature and mortality is summarized, with a closer examination of studies of the potential effect of air pollution on the temperature-mortality association, as well as vulnerable subgroups. A general discussion of mortality displacement on the association between tem-perature and mortality is also included. Mortality dis-placement (also known as harvesting) refers to the phenomena suggesting that observed deaths from some environmental exposure, such as ambient temperature, occur in the most frail individuals whose deaths have only been brought forward by a few days.
Methodological issues
Inclusion/exclusion criteriaAll studies included in this review were published in peer-reviewed journals between January 2001 and December 2008. PubMed was used to search for the following key-words: temperature, apparent temperature, heat, heat index, and mortality. In addition, Table 2 had the key-word "air pollutants," "ozone," or "particulate matter" added, and Table 3 had "vulnerable", "susceptible sub-groups/groups" added. The search was limited to the Eng-lish language and epidemiologic studies. The review focused primarily on quantitative studies of ambient tem-perature, consisting of studies using the time-series and/or case-crossover methods. The outcomes from these studies generally reported a regression coefficient, relative risk (time series), odds ratio (case-crossover), or percent change in mortality, along with corresponding standard errors or confidence intervals. Studies that reported mor-tality counts or excess deaths following heat waves were excluded so that the focus remained on general ambient temperature exposure, rather than on short time periods.
Review articles or studies focusing on cold temperature effects were also excluded. Thirty-six studies published in peer-reviewed journals were selected for this epidemio-logic review, with 52 total studies in the references that included a general discussion of temperature and mortal-ity.
Exposure assessment
Temperature data are often measured near airport moni-toring stations, and analyzed at the city or county level. Thus, misclassification of exposure may occur, especially for larger geographic areas. Also, measuring ambient tem-perature outside of urban areas may artificially reduce the temperature measurement, since urban areas often have higher temperatures than suburban or surrounding areas because of heat absorbed by buildings and roadways (known as the urban heat-island effect). However, since the bias should be non-differential (i.e., not different by county or other unit of analysis), the bias in the estimate would be toward the null, where the results would be underestimated. Misclassification of exposure may be reduced in future studies by using smaller buffer zones, such as five or ten kilometers around each monitor, if suf-ficient data are available.
Exposure to ambient temperature is often defined as some combined metric of temperature and relative humidity or dew point temperature, such as heat index, humidex, or apparent temperature, depending on the study location and author's preference. In addition, other variables, such as day of the week, time trend, and barometric pressure, are often added to the model. In some studies, air pollut-ants have been assessed as confounders or effect modifiers in an attempt to tease apart the independent effect of tem-perature. A monitor or an average of monitors is often used to characterize exposure for a county, or a given dis-tance from the home address using geospatial coding. Many investigators relied on mean daily average to clas-sify exposure, although others used maximum or mini-mum temperature to capture daytime and nighttime exposures, respectively, since those have also been shown to play a role in heat-related mortality. Because the effect of temperature has been found to be immediate (i.e., same lagged day), exposure can be characterized by the place of death.
Case selection
Environmental Health 2009, 8:40 http://www.ehjournal.net/content/8/1/40
Page 3 of 13
(page number not for citation purposes)
death is usually used for epidemiologic studies and should be sufficient for characterizing the temperature-mortality association, although associated causes of death can also be used.
The studies to date are often limited by information pro-vided by the death certificate data. For example, informa-tion on income level, poverty, or air condiinforma-tioning use is not offered on the individual level, so it is difficult to examine socioeconomic status. Thus, gathering data on individual characteristics, as has been done in a previous study [4], would be informative. In addition, medication use, time-activity patterns, and biologic mechanisms could be further understood.
Study design
Most of the studies conducted in the past decade rely on the time-series or case-crossover study designs, with the exception of the studies of the 2003 European heat wave, which are not included in this review. Regardless of the method chosen, the time-series and case-crossover study designs should yield similar results, as has been shown in some temperature-mortality studies [5-7].
The time-series is a widely accepted approach in both air pollution and temperature studies. The time-series study generally encompasses large populations in multiple geo-graphic areas over a given time period. Mortality counts or rates are compared to exposure measurements collected at regular time intervals (e.g., daily, weekly). Seasonality and other confounding factors that fluctuate over time are accounted for by adding the covariates to the model (i.e., day of the week, air pollutants) and using smoothing functions to the model using specified degrees of free-dom.
The case-crossover design has been employed more recently, gaining widespread popularity for studying air pollution and temperature in the past decade. This study design is similar to a matched case-control study; how-ever, each case in the case-crossover study serves as his/her own control. Thus, biases due to measured and unmeas-ured confounders, such as genetics, health behaviors, and physiologic differences, are controlled for by study design. The case-crossover study design has been refined since its introduction in 1991, from the unidirectional, to the bidi-rectional, and most recently, to the time-stratified approach. The time-stratified approach limits the bias from selecting control periods only previously to the case period (unidirectional), or from not selecting control periods at random from the time at which the case occurred (bidirectional). Most commonly, control peri-ods are selected within the same month and the same year that the case period occurred in the time-stratified approach to inherently minimize biases that may occur
from time trends. Day of the week is also matched for by study design by choosing control periods every seven days, or may be added to the model as an indicator varia-ble, especially if data are sparse (e.g., if using particulate matter in the model, data are often collected every third day, and thus, would warrant control periods to be selected every third day). In the studies listed in the fol-lowing tables, all case-crossover studies used the time-stratified approach.
Multi-city analyses are preferred, since bias from a single city analysis may result and the findings from multiple areas may be more generalizable [6]. Thus, city or county-level estimates are usually combined into one overall esti-mate using meta-analytic techniques using a random effects model.
Mortality displacement
In epidemiologic studies of temperature or air pollution and mortality or morbidity, mortality displacement/har-vesting have been addressed using several methods [8-13]. Among the more intuitive approaches, one can examine very long cumulative averages (i.e., 20 to 40 days of expo-sure) to determine whether a positive association found over the first few days is offset by a negative association over subsequent days. This would suggest that a pool of frail individuals was the only or major subgroup that was impacted by the exposure. However, if harvesting is not found, then the exposure under study is a real public health issue.
In studies of temperature and mortality, very few studies have addressed the harvesting issue. The evidence is mixed and may depend on: (1) whether one is examining heat waves versus a more general rise in temperature; (2) the study design and lag structure used for temperature effects; (3) the potential interactions with air pollution; (4) the baseline health status of the population; (5) the population at risk; and (6) other local factors that might determine vulnerability.
Summary of Studies
Environmental Health 2009, 8:40 http://www.ehjournal.net/content/8/1/40
Page 4 of 13
(page number not for citation purposes)
general ambient temperature and mortality, accounted for air pollutants, and/or identified vulnerable subgroups, the same study may be listed in multiple tables with the relevant results.
General Ambient Temperature and Mortality
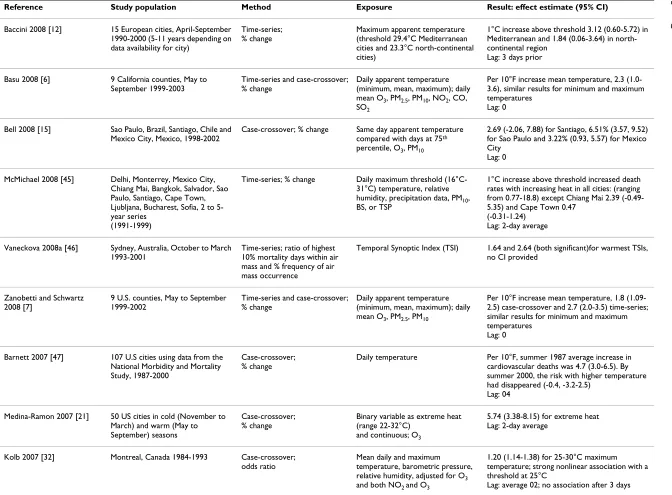
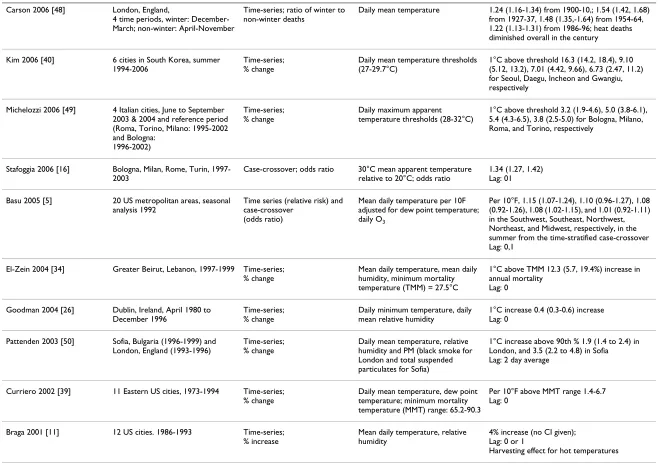
In Table 1, the recent studies of high ambient temperature and mortality are summarized. To focus on the effects of warmer temperatures, most investigators limited their data above a threshold value, or have compared effect esti-mates from temperatures above a threshold value to another lower value. The threshold value is often based on some percentile of the data (i.e., 90th or 95th percentile),
after visual inspection of the exposure-response curves or by mathematical (i.e., through derivatives) or statistical (i.e., by maximum likelihood) methods. The data are often limited to the summer months or warm season to establish heat effects. Limiting the data to summer months or the warm season is also employed to exclude possible (negative or positive) effects from cold tempera-tures on mortality in the attempt to estimate the actual risk from heat effects. Because of these several classifica-tions of temperature exposure, it is difficult to directly compare the values resulting from these studies. However, few comparisons can be made. For example, in Europe and Korea, where different levels of temperature and humidity were experienced, the mortality estimates above a threshold of (23.3-29.7°C) resulted in different effect estimates [12]. With similar threshold values in the Med-iterranean (29.4°C) and Korea (27-29.7°C), a 1°C increase of apparent temperature corresponded to a 3.12% increase in daily mortality in Mediterranean cities, and a much higher effect in Korea (6.73%-16.3% in six cities) for a similar time period. Two recent studies con-ducted by Basu et al. [6,14] and Zanobetti and Schwartz [7] using identical methods suggested that the effect esti-mates throughout California and other parts of the US are similar, even with different ranges of apparent tempera-ture. They both found approximately a 2% increase in mortality associated with a 10°F increase in apparent tem-perature.
Air Pollutants as Confounders/Effect Modifiers
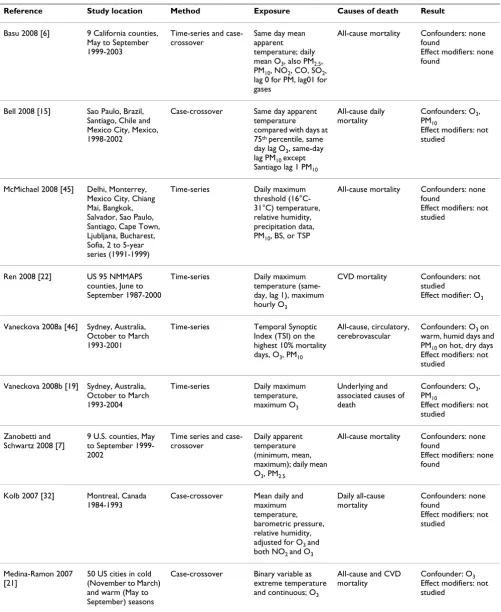
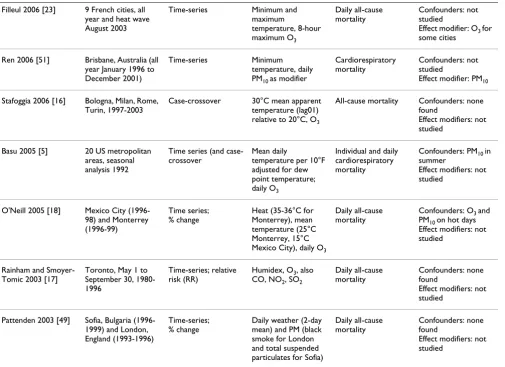
Table 2 includes recent studies that have evaluated air pol-lutants as a potential confounder and/or effect modifier of the high ambient temperature and mortality association. The pollutants that have been examined include ozone (O3), particulate matter less than 10 μg/m3 in aerody-namic diameter (PM10), fine particulate matter (PM2.5), carbon monoxide (CO), sulfur dioxide (SO2), and nitro-gen dioxide (NO2). Most investigators who considered pollutants evaluated PM and O3, since these pollutants have been found to be associated with mortality and are often correlated with high temperature.
Although the effect estimates changed with pollutants in the model, no significant confounding [15] or effect mod-ification by pollution on the association between temper-ature and mortality was reported in some recent studies conducted in the US [6,7]. The studies conducted by Bell et al. and Zanobetti and Schwartz considered PM10 (as well as PM2.5 in the Zanobetti and Schwartz study) and
O3, while the study by Basu et al. considered O3, PM2.5, PM10, NO2, CO, and SO2. Stafoggia [16] and Rainham and Smoyer-Tomic [17] also reported no confounding by O3 in Italy and Canada, respectively, and Pattenden did not find confounding by markers of PM in both Sofia (total suspended in particulates) and London (black smoke). However, PM10 was found to be confounder in Monterrey, Mexico [18], Sydney, Australia [19], and in regions throughout the United States, especially in the summer [5]. Ren and Tong [20] also observed PM10 to modify the association in their study conducted in Bris-bane, Australia. O3 was found to be a confounder espe-cially on hot days [18,21], and other investigators also showed O3 to be a positive effect modifier of temperature and mortality, at least in some study locations [22,23].
The results for confounding and/or effect modification by air pollutants on the temperature-mortality association remain mixed; as stated, some investigators reported air pollutants as confounders or effect modifiers while others found no significant confounding or effect modification in their studies.
Cause-specific Outcomes and Vulnerable Subgroups
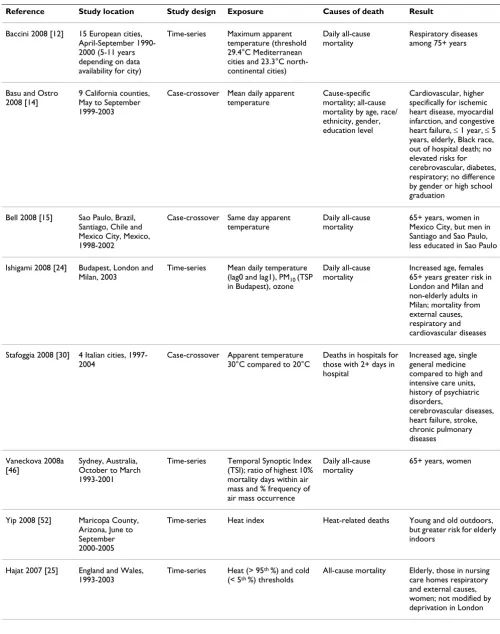
Much of the focus of epidemiologic studies has been iden-tifying cause-specific outcomes and vulnerable subgroups of mortality from high ambient temperature (Table 3).
Cause-specific outcomes
Some investigators have reported greater risks for deaths from cardiovascular (CVD) [5,14,24], respiratory [5,12,24-26], cerebrovascular [16], diabetes [27,28], or pre-existing psychiatric disorders [16,29,30]. Other stud-ies also showed elevated risk from mortality subcategorstud-ies of CVD diseases, such as myocardial infarction [8,14,31], ischemic heart disease [14], and congestive heart failure [14,30,32],
Age
iden-Environmental Health
2
009,
8
:40
http://www.eh
journ
al.net/content/8/1/4
0
Pa
ge 5 of
1
3
(page number not for citation purposes)
Table 1: Recent Studies of High Ambient Temperature and All-Cause Daily Mortality*
Reference Study population Method Exposure Result: effect estimate (95% CI)
Baccini 2008 [12] 15 European cities, April-September 1990-2000 (5-11 years depending on data availability for city)
Time-series; % change
Maximum apparent temperature (threshold 29.4°C Mediterranean cities and 23.3°C north-continental cities)
1°C increase above threshold 3.12 (0.60-5.72) in Mediterranean and 1.84 (0.06-3.64) in north-continental region
Lag: 3 days prior
Basu 2008 [6] 9 California counties, May to
September 1999-2003
Time-series and case-crossover; % change
Daily apparent temperature (minimum, mean, maximum); daily mean O3, PM2.5, PM10, NO2, CO, SO2
Per 10°F increase mean temperature, 2.3 (1.0-3.6), similar results for minimum and maximum temperatures
Lag: 0
Bell 2008 [15] Sao Paulo, Brazil, Santiago, Chile and Mexico City, Mexico, 1998-2002
Case-crossover; % change Same day apparent temperature compared with days at 75th
percentile, O3, PM10
2.69 (-2.06, 7.88) for Santiago, 6.51% (3.57, 9.52) for Sao Paulo and 3.22% (0.93, 5.57) for Mexico City
Lag: 0
McMichael 2008 [45] Delhi, Monterrey, Mexico City, Chiang Mai, Bangkok, Salvador, Sao Paulo, Santiago, Cape Town, Ljubljana, Bucharest, Sofia, 2 to 5-year series
(1991-1999)
Time-series; % change Daily maximum threshold (16°C-31°C) temperature, relative humidity, precipitation data, PM10, BS, or TSP
1°C increase above threshold increased death rates with increasing heat in all cities: (ranging from 0.77-18.8) except Chiang Mai 2.39 (-0.49-5.35) and Cape Town 0.47
(-0.31-1.24) Lag: 2-day average
Vaneckova 2008a [46] Sydney, Australia, October to March 1993-2001
Time-series; ratio of highest 10% mortality days within air mass and % frequency of air mass occurrence
Temporal Synoptic Index (TSI) 1.64 and 2.64 (both significant)for warmest TSIs, no CI provided
Zanobetti and Schwartz 2008 [7]
9 U.S. counties, May to September 1999-2002
Time-series and case-crossover; % change
Daily apparent temperature (minimum, mean, maximum); daily mean O3, PM2.5, PM10
Per 10°F increase mean temperature, 1.8 (1.09-2.5) case-crossover and 2.7 (2.0-3.5) time-series; similar results for minimum and maximum temperatures
Lag: 0
Barnett 2007 [47] 107 U.S cities using data from the National Morbidity and Mortality Study, 1987-2000
Case-crossover; % change
Daily temperature Per 10°F, summer 1987 average increase in
cardiovascular deaths was 4.7 (3.0-6.5). By summer 2000, the risk with higher temperature had disappeared (-0.4, -3.2-2.5)
Lag: 04
Medina-Ramon 2007 [21] 50 US cities in cold (November to March) and warm (May to September) seasons
Case-crossover; % change
Binary variable as extreme heat (range 22-32°C)
and continuous; O3
5.74 (3.38-8.15) for extreme heat Lag: 2-day average
Kolb 2007 [32] Montreal, Canada 1984-1993 Case-crossover;
odds ratio
Mean daily and maximum temperature, barometric pressure, relative humidity, adjusted for O3 and both NO2 and O3
1.20 (1.14-1.38) for 25-30°C maximum temperature; strong nonlinear association with a threshold at 25°C
Environmental Health
2
009,
8
:40
http://www.eh
journ
al.net/content/8/1/4
0
Pa
ge 6 of
1
3
(page number not for citation purposes)
Carson 2006 [48] London, England,
4 time periods, winter: December-March; non-winter: April-November
Time-series; ratio of winter to non-winter deaths
Daily mean temperature 1.24 (1.16-1.34) from 1900-10,; 1.54 (1.42, 1.68) from 1927-37, 1.48 (1.35,-1.64) from 1954-64, 1.22 (1.13-1.31) from 1986-96; heat deaths diminished overall in the century
Kim 2006 [40] 6 cities in South Korea, summer
1994-2006
Time-series; % change
Daily mean temperature thresholds (27-29.7°C)
1°C above threshold 16.3 (14.2, 18.4), 9.10 (5.12, 13.2), 7.01 (4.42, 9.66), 6.73 (2.47, 11.2) for Seoul, Daegu, Incheon and Gwangiu, respectively
Michelozzi 2006 [49] 4 Italian cities, June to September 2003 & 2004 and reference period (Roma, Torino, Milano: 1995-2002 and Bologna:
1996-2002)
Time-series; % change
Daily maximum apparent temperature thresholds (28-32°C)
1°C above threshold 3.2 (1.9-4.6), 5.0 (3.8-6.1), 5.4 (4.3-6.5), 3.8 (2.5-5.0) for Bologna, Milano, Roma, and Torino, respectively
Stafoggia 2006 [16] Bologna, Milan, Rome, Turin, 1997-2003
Case-crossover; odds ratio 30°C mean apparent temperature relative to 20°C; odds ratio
1.34 (1.27, 1.42) Lag: 01
Basu 2005 [5] 20 US metropolitan areas, seasonal
analysis 1992
Time series (relative risk) and case-crossover
(odds ratio)
Mean daily temperature per 10F adjusted for dew point temperature; daily O3
Per 10°F, 1.15 (1.07-1.24), 1.10 (0.96-1.27), 1.08 (0.92-1.26), 1.08 (1.02-1.15), and 1.01 (0.92-1.11) in the Southwest, Southeast, Northwest, Northeast, and Midwest, respectively, in the summer from the time-stratified case-crossover Lag: 0,1
El-Zein 2004 [34] Greater Beirut, Lebanon, 1997-1999 Time-series; % change
Mean daily temperature, mean daily humidity, minimum mortality temperature (TMM) = 27.5°C
1°C above TMM 12.3 (5.7, 19.4%) increase in annual mortality
Lag: 0
Goodman 2004 [26] Dublin, Ireland, April 1980 to December 1996
Time-series; % change
Daily minimum temperature, daily mean relative humidity
1°C increase 0.4 (0.3-0.6) increase Lag: 0
Pattenden 2003 [50] Sofia, Bulgaria (1996-1999) and London, England (1993-1996)
Time-series; % change
Daily mean temperature, relative humidity and PM (black smoke for London and total suspended particulates for Sofia)
1°C increase above 90th % 1.9 (1.4 to 2.4) in London, and 3.5 (2.2 to 4.8) in Sofia Lag: 2 day average
Curriero 2002 [39] 11 Eastern US cities, 1973-1994 Time-series; % change
Daily mean temperature, dew point temperature; minimum mortality temperature (MMT) range: 65.2-90.3
Per 10°F above MMT range 1.4-6.7 Lag: 0
Braga 2001 [11] 12 US cities. 1986-1993 Time-series;
% increase
Mean daily temperature, relative humidity
4% increase (no CI given); Lag: 0 or 1
Harvesting effect for hot temperatures
* Exceptions: El-Zein 2004 and Carson 2006 reported annual and weekly deaths, respectively.
Environmental Health 2009, 8:40 http://www.ehjournal.net/content/8/1/40
Page 7 of 13
(page number not for citation purposes)
Table 2: Recent Studies of High Ambient Temperature and Mortality Examining Air Pollutants as Potential Confounders and/or Effect Modifiers
Reference Study location Method Exposure Causes of death Result
Basu 2008 [6] 9 California counties, May to September 1999-2003
Time-series and case-crossover
Same day mean apparent temperature; daily mean O3, also PM2.5, PM10, NO2, CO, SO2, lag 0 for PM, lag01 for gases
All-cause mortality Confounders: none found
Effect modifiers: none found
Bell 2008 [15] Sao Paulo, Brazil, Santiago, Chile and Mexico City, Mexico, 1998-2002
Case-crossover Same day apparent temperature compared with days at 75th percentile, same day lag O3, same-day lag PM10 except Santiago lag 1 PM10
All-cause daily mortality
Confounders: O3, PM10
Effect modifiers: not studied
McMichael 2008 [45] Delhi, Monterrey, Mexico City, Chiang Mai, Bangkok, Salvador, Sao Paulo, Santiago, Cape Town, Ljubljana, Bucharest, Sofia, 2 to 5-year series (1991-1999)
Time-series Daily maximum threshold (16°C-31°C) temperature, relative humidity, precipitation data, PM10, BS, or TSP
All-cause mortality Confounders: none found
Effect modifiers: not studied
Ren 2008 [22] US 95 NMMAPS counties, June to September 1987-2000
Time-series Daily maximum temperature (same-day, lag 1), maximum hourly O3
CVD mortality Confounders: not studied
Effect modifier: O3
Vaneckova 2008a [46] Sydney, Australia, October to March 1993-2001
Time-series Temporal Synoptic Index (TSI) on the highest 10% mortality days, O3, PM10
All-cause, circulatory, cerebrovascular
Confounders: O3 on warm, humid days and PM10 on hot, dry days Effect modifiers: not studied
Vaneckova 2008b [19] Sydney, Australia, October to March 1993-2004
Time-series Daily maximum temperature, maximum O3
Underlying and associated causes of death
Confounders: O3, PM10
Effect modifiers: not studied
Zanobetti and Schwartz 2008 [7]
9 U.S. counties, May to September 1999-2002
Time series and case-crossover
Daily apparent temperature (minimum, mean, maximum); daily mean O3, PM2.5
All-cause mortality Confounders: none found
Effect modifiers: none found
Kolb 2007 [32] Montreal, Canada 1984-1993
Case-crossover Mean daily and maximum temperature, barometric pressure, relative humidity, adjusted for O3 and both NO2 and O3
Daily all-cause mortality
Confounders: none found
Effect modifiers: not studied
Medina-Ramon 2007 [21]
50 US cities in cold (November to March) and warm (May to September) seasons
Case-crossover Binary variable as extreme temperature and continuous; O3
All-cause and CVD mortality
Environmental Health 2009, 8:40 http://www.ehjournal.net/content/8/1/40
Page 8 of 13
(page number not for citation purposes)
tified to be at increased risk for mortality from high ambi-ent temperature. One investigator also reported 15 to 64 years of age to be at a significantly increased risk, although still lower than the elderly or young children [33].
Gender
Modifications by gender has also been studied, and some investigators reported no difference by gender [14], while others found men in Santiago and Sao Paulo [15] specifi-cally for circulatory causes [35] or women in various loca-tions [15-17,19,24,36] to be at higher risk for mortality.
Race/ethnic group
Other recent epidemiologic studies also reported Black racial ethnic group [14,37] and non-Whites [28] to be at greater risk than Whites in the US. Hispanic subgroups, however, have not been identified as being at greater risk in one study, partially explained by more social network-ing among this ethnic group [14].
Socioeconomic factors
Other factors that provoked greater risk included indica-tors for lower socioeconomic status, including the less educated, persons living in lower income areas [16] and dying out of the hospital [14,27,38]. Also, increased pov-erty [39], and lack of air conditioner [11,37,39] were observed risk factors. However, lower socioeconomic sta-tus [33] and education level were not found to be a risk factor in all studies [14].
Latitude Variations
Some studies reported variation by latitude, supporting the evidence for acclimatization. People who live in cities where the temperatures are generally elevated in the sum-mer were found to have higher minimum mortality tem-peratures, or less risk given the same level of temperature, than people who live in cities with milder climates [7,21,39]. A similar finding was reported in California, where slightly higher estimates were found for coastal
Filleul 2006 [23] 9 French cities, all year and heat wave August 2003
Time-series Minimum and maximum
temperature, 8-hour maximum O3
Daily all-cause mortality
Confounders: not studied
Effect modifier: O3 for some cities
Ren 2006 [51] Brisbane, Australia (all year January 1996 to December 2001)
Time-series Minimum temperature, daily PM10 as modifier
Cardiorespiratory mortality
Confounders: not studied
Effect modifier: PM10
Stafoggia 2006 [16] Bologna, Milan, Rome, Turin, 1997-2003
Case-crossover 30°C mean apparent temperature (lag01) relative to 20°C, O3
All-cause mortality Confounders: none found
Effect modifiers: not studied
Basu 2005 [5] 20 US metropolitan areas, seasonal analysis 1992
Time series (and case-crossover
Mean daily
temperature per 10°F adjusted for dew point temperature; daily O3
Individual and daily cardiorespiratory mortality
Confounders: PM10 in summer
Effect modifiers: not studied
O'Neill 2005 [18] Mexico City (1996-98) and Monterrey (1996-99)
Time series; % change
Heat (35-36°C for Monterrey), mean temperature (25°C Monterrey, 15°C Mexico City), daily O3
Daily all-cause mortality
Confounders: O3 and PM10 on hot days Effect modifiers: not studied
Rainham and Smoyer-Tomic 2003 [17]
Toronto, May 1 to September 30, 1980-1996
Time-series; relative risk (RR)
Humidex, O3, also CO, NO2, SO2
Daily all-cause mortality
Confounders: none found
Effect modifiers: not studied
Pattenden 2003 [49] Sofia, Bulgaria (1996-1999) and London, England (1993-1996)
Time-series; % change
Daily weather (2-day mean) and PM (black smoke for London and total suspended particulates for Sofia)
Daily all-cause mortality
Confounders: none found
Effect modifiers: not studied
Environmental Health 2009, 8:40 http://www.ehjournal.net/content/8/1/40
Page 9 of 13
(page number not for citation purposes)
Table 3: Recent Studies Identifying Vulnerable Subgroups of Mortality from High Ambient Temperature
Reference Study location Study design Exposure Causes of death Result
Baccini 2008 [12] 15 European cities, April-September 1990-2000 (5-11 years depending on data availability for city)
Time-series Maximum apparent temperature (threshold 29.4°C Mediterranean cities and 23.3°C north-continental cities)
Daily all-cause mortality
Respiratory diseases among 75+ years
Basu and Ostro 2008 [14]
9 California counties, May to September 1999-2003
Case-crossover Mean daily apparent temperature
Cause-specific mortality; all-cause mortality by age, race/ ethnicity, gender, education level
Cardiovascular, higher specifically for ischemic heart disease, myocardial infarction, and congestive heart failure, ≤ 1 year, ≤ 5 years, elderly, Black race, out of hospital death; no elevated risks for cerebrovascular, diabetes, respiratory; no difference by gender or high school graduation
Bell 2008 [15] Sao Paulo, Brazil, Santiago, Chile and Mexico City, Mexico, 1998-2002
Case-crossover Same day apparent temperature
Daily all-cause mortality
65+ years, women in Mexico City, but men in Santiago and Sao Paulo, less educated in Sao Paulo
Ishigami 2008 [24] Budapest, London and Milan, 2003
Time-series Mean daily temperature (lag0 and lag1), PM10 (TSP in Budapest), ozone
Daily all-cause mortality
Increased age, females 65+ years greater risk in London and Milan and non-elderly adults in Milan; mortality from external causes, respiratory and cardiovascular diseases
Stafoggia 2008 [30] 4 Italian cities, 1997-2004
Case-crossover Apparent temperature 30°C compared to 20°C
Deaths in hospitals for those with 2+ days in hospital
Increased age, single general medicine compared to high and intensive care units, history of psychiatric disorders,
cerebrovascular diseases, heart failure, stroke, chronic pulmonary diseases
Vaneckova 2008a [46]
Sydney, Australia, October to March 1993-2001
Time-series Temporal Synoptic Index (TSI); ratio of highest 10% mortality days within air mass and % frequency of air mass occurrence
Daily all-cause mortality
65+ years, women
Yip 2008 [52] Maricopa County, Arizona, June to September 2000-2005
Time-series Heat index Heat-related deaths Young and old outdoors, but greater risk for elderly indoors
Hajat 2007 [25] England and Wales, 1993-2003
Time-series Heat (> 95th %) and cold (< 5th %) thresholds
Environmental Health 2009, 8:40 http://www.ehjournal.net/content/8/1/40
Page 10 of 13
(page number not for citation purposes)
counties where milder temperatures are generally experi-enced [6]. Although coastal areas in California are usually more expensive, many of the homes lack air conditioning, since they have not been needed. Therefore, air condition-ing prevalence is not an indicator of socioeconomic status in California, as it is in the remainder of the U.S.
Discussion
In the past few years, several epidemiologic studies have been conducted in various locations to characterize tem-perature and mortality. In the US, similar effects were found in nine counties in California and in nine counties
outside of California in two separate studies using the same methods [6,7]. In Europe and Korea, however, the effect estimates were larger [12,40], further supporting the need to conduct temperature-mortality studies for specific areas. The results from future studies can be more readily compared if estimates are reported per degree Celsius or Fahrenheit per unit change in temperature (assuming lin-earity), or if a regression coefficient is given, rather than selecting a threshold value for temperature. In addition, investigators should consider accounting for air pollut-ants and identifying vulnerable subgroups in their epide-miologic studies.
Medina-Ramon 2007 [21]
50 US cities in cold (November to March) and warm (May to September) seasons
Case-crossover Binary variable as extreme temperature and continuous; ozone
All-cause and CVD mortality
Cities with milder summers, less air conditioning and higher population density
Diaz 2006 [35] Madrid, January 1986-December 1997
Time-series T(hwave) = Tmax-36.5C if Tmax>36.5C; 5th % to 95th % temperature, NO 2
AR = (RR-1)/RR for daily mortality
Circulatory causes, males 45-64 years
Stafoggia 2006 [16] Bologna, Milan, Rome, Turin, 1997-2003
Case-crossover 30°C mean apparent temperature (lag01) relative to 20°C; odds ratio
All-cause mortality and previous
hospitalization
Increased age and greater for women, widows and widowers, psychiatric disorders, depression, heart and circulatory disorders
Hajat 2005 [48] Delhi, Sao Paulo, London, January 1991-December 1994
Time-series Daily temperature (lag 0,1) greater than 20°C
Daily all-cause mortality
Respiratory deaths in Sao Paulo and London; children in Delhi
O'Neill, Zanobetti and Schwartz 2005 [37]
Chicago, Detroit, Minneapolis, Pittsburgh, 1988-1993 for Chicago and 1986-1993 for other cities
Time-series Percent change daily mean temperature 29°C relative to 15°C (lag0), barometric pressure, day of the week, PM10
Mortality, prevalence of air conditioner (AC)
Black race, lack of air conditioner
Gouveia 2003 [33] Sao Paulo, Brazil, 1991-1994
Time-series Daily mean temperature (lag01), SO2, PM10, CO, O3, NO2, day of the week, season, humidity
Daily all-cause mortality, excluding violent deaths, cardiovascular and respiratory mortality
Greatest for 65+years and < 15 years, also increased for15-64 years; elderly cardiovascular,
respiratory for adults and elderly; no modification by socioeconomic status
O'Neill 2003 [38] 7 US cities, 1986-1993
Time-series Mean daily apparent temperature (% change 29°C and -5°C), PM10
Daily all-cause mortality, looking at effect modification by demographics & other variables
Black race, less educated, and outside hospital
Rainham and Smoyer-Tomic 2003 [42]
Toronto, May 1 to September 30, 1980-1996
Time-series Humidex, CO, O3, NO2, SO2
Daily all-cause mortality
Females
Curriero 2002 [39] 11 Eastern US cities, 1973-1994
Time-series Daily mean temperature, dew point temperature; minimum mortality temperature (MMT) range: 65.2-90.3
Daily all-cause mortality, excluding accidents
Higher latitude, more poverty, less air conditioning or heating
Environmental Health 2009, 8:40 http://www.ehjournal.net/content/8/1/40
Page 11 of 13
(page number not for citation purposes)
The recent epidemiologic evidence suggests that PM and O3 may be confounders, and some studies also found O3 to be an effect modifier in the warmer months. In other words, the association between temperature and mortality is partially a result of the effect of PM and O3. However, this confounding effect is relatively small, and there is clearly an independent effect of both temperature and air pollution on mortality. Others have reported that temper-ature has a greater effect on mortality with higher levels of O3 (i.e., synergism). Some of the conflicting evidence for confounding and effect modification by air pollutants may be due to high correlations between pollutants and temperature, making it difficult to tease apart the inde-pendent effects of either exposure. Also, different sources, chemistry, size distribution of particles, compositions and patterns of exposure [41] of gases and particles are observed throughout the US and elsewhere. Although O3 generally peaks in the summer throughout the US, for example, particulate matter peaks in the winter in Califor-nia and in the summer on the East Coast. Thus, there would more likely be an impact of PM on elevated ambi-ent temperature and health outcomes on the East Coast. Acclimatization may also play a critical role in the temper-ature-mortality association. People who live in areas where high ambient temperatures or heat waves are typi-cally experienced may be less affected than people who reside in areas where high ambient temperatures are less commonly observed. Thus, even if there is effect modifi-cation between ambient temperature and a pollutant, such as O3, the influence on mortality may be minimal, but synergistic in areas where heat waves are uncommon.
Several vulnerable subgroups have been identified in the past decade of epidemiologic research, and were often dependent on study location and study population. Thus, region-specific policies, especially in urban areas, are vital to the mitigation of heat-related deaths. Specifically, those dying from cardiovascular, respiratory, and some specific cardiovascular diseases, such as ischemic heart disease, congestive heart failure, and myocardial infarction were at greater risk for heat-related mortality. Other vulnerable subgroups included: Black racial/ethnic group, women, those with lower socioeconomic status, and all age groups, particularly the elderly over 65 years of age as well as infants and young children.
Infants, young children, and the elderly should be specif-ically targeted in future studies to prevent heat-related mortality. With the elderly increasing in urban environ-ments, an important research goal is the identification of clinical patterns of chronic diseases that increase the sus-ceptibility to heat. Furthermore, vulnerable subgroups need to be further identified by cause-specific outcomes or demographics, such as racial/ethnic group. Furthermore, adverse birth outcomes have been found to be associated
with air pollutants in previous studies, but have not been investigated, specifically for ambient temperature. Although previous studies of air pollution and birth out-comes have not accounted for temperature, some investi-gators have suggested seasonal associations, implying that temperature could also play a role with adverse birth out-comes and warrants further investigation.
Several biological mechanisms have been postulated for susceptible populations to heat-related mortality, particu-larly the elderly [42]. When body temperatures rise, blood flow generally shifts from the vital organs to underneath the skin's surface in an effort to cool down. The body's ability to regulate its temperature (also known as ther-moregulation) may be impeded when too much blood is diverted, putting increased stress on the heart and lungs. Increased blood viscosity, elevated cholesterol levels asso-ciated with higher temperatures, and higher sweating threshold may also trigger heat-related mortality [43]. The body's ability to adapt to high ambient temperature can be influenced by acclimatization. People who live in areas where high ambient temperatures are not generally expe-rienced are more likely to be affected by a heat wave. The synergistic impact of high ambient temperature along with high levels of air pollutants, such as O3 and PM, may also play a role in increasing the mortality effect. Further-more, heat waves occurring earlier in the year may have a greater impact on mortality since the population has not had the chance to adapt to hotter temperatures.
This review is timely as climate change receives more glo-bal attention, and more epidemiologic studies have been recently conducted. It, however, has several limitations. While it includes the most recent epidemiologic studies using time-series and case-crossover methods, it does not include studies of heat waves or studies using other approaches in an effort to focus on general ambient tem-perature over longer time periods. Both methods rely on ecologic exposure variables for temperature, and the time-series analysis also uses aggregated counts of mortality. Thus, an advantage of the case-crossover study is that dif-ferences by individual-level characteristics such as age, race/ethnic group, gender can be analyzed. Although the methods used across studies were similar, it was still often difficult to compare estimates between studies because of the analysis type (e.g., different threshold values). There were also not a sufficient number of studies to conduct a meta-analysis of the results, or other more substantial quantification. Finally, there may be some publication bias in the studies that were chosen, but by using PubMed, the bias may be limited, as it includes most scientific jour-nals.
Environmental Health 2009, 8:40 http://www.ehjournal.net/content/8/1/40
Page 12 of 13
(page number not for citation purposes)
areas rather than for an entire geographic area. These stud-ies would be helpful to the National Weather Service, health care institutions, and governmental agencies to implement policies to prevent heat-related mortality and also create a better heat warning system based on current studies. They will also be helpful to establish policy guide-lines for the U.S. Environmental Protection Agency (per-sonal communication), and could be used for economic analyses. Although no formal evaluation of heat-health watch warning systems has been performed to date, some city-based heat-health watch warning systems have already been implemented appear to be successful in greatly reducing mortality following heat waves [44]. For example, the 2003 heat wave in Western Europe resulted in 35,000 deaths, but the World Health Organization's project, EuroHEAT, collected information about existing warning systems and defined guidelines for prevention so that subsequent heat waves do not produce such devastat-ing results http://www.euro.who.int/document/ e91347.pdf.
Conclusion
In the past few years, several epidemiologic studies have been conducted in various locations to characterize tem-perature and mortality. These studies have consisted pri-marily of time-series and case-crossover studies, and were summarized this review. The recent epidemiologic evi-dence suggests that PM and O3 may be confounders, and some studies also found O3 to be an effect modifier in the warmer months. However, this confounding effect is rela-tively small, and there is clearly an independent effect of both temperature and air pollution on mortality. Several vulnerable subgroups have been identified, including those dying from cardiovascular, respiratory, and some specific cardiovascular diseases, such as ischemic heart disease, congestive heart failure, and myocardial infarc-tion. Other vulnerable subgroups included: Black racial/ ethnic group, women, those with lower socioeconomic status, and all age groups, particularly the elderly over 65 years of age as well as infants and young children.
Thus, infants, young children, and the elderly should be specifically targeted in future studies to prevent heat-related mortality. Many of these outcomes and vulnerable subgroups have only been identified in recent epidemio-logic studies of ambient temperature and were dependent on the location and study population. Thus, region-spe-cific policies, especially in urban areas, are vital to the mit-igation of heat-related deaths.
Abbreviations
CO: (carbon monoxide); NO2: (nitrogen dioxide); O3: (ozone); PM: (particulate matter); PM2.5: (particulate matter with less than 2.5 μg/m3 in aerodynamic
diame-ter); PM10: (particulate matter with less than 10 μg/m3 in
aerodynamic diameter); SO2: (sulfur dioxide); °C: (degree Celsius); °F: (degree Fahrenheit); CI: (confidence interval).
Competing interests
The author declares that they have no competing interests.
Authors' contributions
RB conducted the literature search for this review, speci-fied the inclusion and exclusion criteria, constructed the tables, and drafted and revised the manuscript for consid-eration for publication.
Acknowledgements
The opinions expressed in this article are solely those of the author and do not represent the policy or position of the State of California or the Cali-fornia Environmental Protection Agency.
References
1. Basu R, Samet JM: Relation between elevated ambient temper-ature and mortality: a review of the epidemiologic evidence.
Epidemiol Rev 2002, 24:190-202.
2. Kinney P, O'Neill MS, Bell ML, Schwartz J: Approaches for esti-mating effects of climate change on heat-related deaths: challenges and opportunities. Environmental Science & Policy 2008,
11:87-96.
3. Gosling SN, McGregor GR, Paldy A: Climate change and heat-related mortality in six cities part 1: model construction and validation. Int J Biometeorol 2007, 51:525-540.
4. Basu R, Samet JM: An exposure assessment study of ambient heat exposure in an elderly population in Baltimore, Mary-land. Environ Health Perspect 2002, 110:1219-1224.
5. Basu R, Dominici F, Samet JM: Temperature and mortality among the elderly in the United States: a comparison of epi-demiologic methods. Epidemiology 2005, 16:58-66.
6. Basu R, Feng WY, Ostro BD: Characterizing Temperature and Mortality in Nine California Counties. Epidemiology 2008,
19:138-145.
7. Zanobetti A, Schwartz J: Temperature and mortality in nine US cities. Epidemiology 2008, 19:563-570.
8. Braga AL, Zanobetti A, Schwartz J: The effect of weather on res-piratory and cardiovascular deaths in 12 U.S. cities. Environ
Health Perspect 2002, 110:859-863.
9. Zeger SL, Dominici F, Samet J: Harvesting-resistant estimates of air pollution effects on mortality. Epidemiology 1999,
10:171-175.
10. Schwartz J: Harvesting and long term exposure effects in the relation between air pollution and mortality. Am J Epidemiol 2000, 151:440-448.
11. Braga AL, Zanobetti A, Schwartz J: The time course of weather-related deaths. Epidemiology 2001, 12:662-667.
12. Baccini M, Biggeri A, Accetta G, Kosatsky T, Katsouyanni K, Analitis A, Anderson HR, Bisanti L, D'Ippoliti D, Danova J, et al.: Heat effects on mortality in 15 European cities. Epidemiology 2008,
19:711-719.
13. Hajat S, Kovats RS, Atkinson RW, Haines A: Impact of hot tem-peratures on death in London: a time series approach. J
Epi-demiol Community Health 2002, 56:367-372.
14. Basu R, Ostro BD: A multicounty analysis identifying the pop-ulations vulnerable to mortality associated with high ambi-ent temperature in California. Am J Epidemiol 2008,
168:632-637.
15. Bell ML, O'Neill MS, Ranjit N, Borja-Aburto VH, Cifuentes LA, Gou-veia NC: Vulnerability to heat-related mortality in Latin America: a case-crossover study in Sao Paulo, Brazil, San-tiago, Chile and Mexico City, Mexico. Int J Epidemiol 2008,
37:796-804.
Publish with BioMed Central and every scientist can read your work free of charge "BioMed Central will be the most significant development for disseminating the results of biomedical researc h in our lifetime."
Sir Paul Nurse, Cancer Research UK
Your research papers will be:
available free of charge to the entire biomedical community
peer reviewed and published immediately upon acceptance
cited in PubMed and archived on PubMed Central
yours — you keep the copyright
Submit your manuscript here:
http://www.biomedcentral.com/info/publishing_adv.asp
BioMedcentral
Environmental Health 2009, 8:40 http://www.ehjournal.net/content/8/1/40
Page 13 of 13
(page number not for citation purposes)
to heat-related mortality: a multicity, population-based, case-crossover analysis. Epidemiology 2006, 17:315-323. 17. Rainham DG, Smoyer-Tomic KE: The role of air pollution in the
relationship between a heat stress index and human mortal-ity in Toronto. Environ Res 2003, 93:9-19.
18. O'Neill MS, Hajat S, Zanobetti A, Ramirez-Aguilar M, Schwartz J:
Impact of control for air pollution and respiratory epidemics on the estimated associations of temperature and daily mor-tality. Int J Biometeorol 2005, 50:121-129.
19. Vaneckova P, Beggs PJ, de Dear RJ, McCracken KW: Effect of tem-perature on mortality during the six warmer months in Syd-ney, Australia, between 1993 and 2004. Environ Res 2008,
108:361-369.
20. Ren C, Tong S: Temperature modifies the health effects of particulate matter in Brisbane, Australia. Int J Biometeorol 2006, 51:87-96.
21. Medina-Ramon M, Schwartz J: Temperature, Temperature Extremes, and Mortality: A Study of Acclimatization and Effect Modification in 50 United States Cities. Occup Environ Med 2007.
22. Ren C, Williams GM, Morawska L, Mengersen K, Tong S: Ozone modifies associations between temperature and cardiovas-cular mortality: analysis of the NMMAPS data. Occup Environ Med 2008, 65:255-260.
23. Filleul L, Cassadou S, Medina S, Fabres P, Lefranc A, Eilstein D, Le Ter-tre A, Pascal L, Chardon B, Blanchard M, et al.: The relation between temperature, ozone, and mortality in nine French cities during the heat wave of 2003. Environ Health Perspect 2006,
114:1344-1347.
24. Ishigami A, Hajat S, Kovats RS, Bisanti L, Rognoni M, Russo A, Paldy A: An ecological time-series study of heat-related mortality in three European cities. Environ Health 2008, 7:5.
25. Hajat S, Kovats RS, Lachowycz K: Heat-related and cold-related deaths in England and Wales: who is at risk? Occup Environ Med 2007, 64:93-100.
26. Goodman PG, Dockery DW, Clancy L: Cause-specific mortality and the extended effects of particulate pollution and tem-perature exposure. Environ Health Perspect 2004, 112:179-185. 27. Medina-Ramón M, Zanobetti A, Cavanagh DP, Schwartz J: Extreme
Temperatures and Mortality: Assessing Effect Modification by Personal Characteristics and Specific Cause of Death in a Multi-City Case-Only Analysis. Environ Health Perspect 2006,
114:1331.
28. Schwartz J: Who is sensitive to extremes of temperature?: A case-only analysis. Epidemiology 2005, 16:67-72.
29. Stafoggia M, Schwartz J, Forastiere F, Perucci CA: Does Tempera-ture Modify the Association between Air Pollution and Mor-tality? A Multicity Case-Crossover Analysis in Italy. Am J
Epidemiol 2008, 167(12):1476-85.
30. Stafoggia M, Forastiere F, Agostini D, Caranci N, de'Donato F, Demaria M, Michelozzi P, Miglio R, Rognoni M, Russo A, Perucci CA:
Factors affecting in-hospital heat-related mortality: a multi-city case-crossover analysis. J Epidemiol Community Health 2008,
62:209-215.
31. Dilaveris P, Synetos A, Giannopoulos G, Gialafos E, Pantazis A, Stefa-nadis C: CLimate Impacts on Myocardial infarction deaths in the Athens TErritory: the CLIMATE study. Heart 2006,
92:1747-1751.
32. Kolb S, Radon K, Valois MF, Heguy L, Goldberg MS: The short-term influence of weather on daily mortality in congestive heart failure. Arch Environ Occup Health 2007, 62:169-176.
33. Gouveia N, Hajat S, Armstrong B: Socioeconomic differentials in the temperature-mortality relationship in Sao Paulo, Brazil.
Int J Epidemiol 2003, 32:390-397.
34. El-Zein A, Tewtel-Salem M, Nehme G: A time-series analysis of mortality and air temperature in Greater Beirut. Sci Total
Environ 2004, 330:71-80.
35. Diaz J, Linares C, Tobias A: Impact of extreme temperatures on daily mortality in Madrid (Spain) among the 45-64 age-group. Int J Biometeorol 2006, 50:342-348.
36. Hajat S, Armstrong B, Baccini M, Biggeri A, Bisanti L, Russo A, Paldy A, Menne B, Kosatsky T: Impact of High Temperatures on Mor-tality: Is There an Added Heat Wave Effect? Epidemiology 2006,
17:632-638.
37. O'Neill MS, Zanobetti A, Schwartz J: Disparities by race in heat-related mortality in four US cities: the role of air condition-ing prevalence. J Urban Health 2005, 82:191-197.
38. O'Neill MS, Zanobetti A, Schwartz J: Modifiers of the tempera-ture and mortality association in seven US cities. Am J Epide-miol 2003, 157:1074-1082.
39. Curriero FC, Heiner KS, Samet JM, Zeger SL, Strug L, Patz JA: Tem-perature and mortality in 11 cities of the eastern United States. Am J Epidemiol 2002, 155:80-87.
40. Kim H, Ha JS, Park J: High temperature, heat index, and mor-tality in 6 major cities in South Korea. Arch Environ Occup Health 2006, 61:265-270.
41. Blanchard C: Spatial and Temporal Characterization of Par-ticulate Matter. In Particulate Matter Science for Policy Makers: A
NARSTO AssessmentVolume Chapter 6. Edited by: McMurry PH,
Shep-herd MF, Vickery JS. Cambridge: Cambridge University Press; 2003. 42. Bouchama A, Knochel JP: Heat stroke. N Engl J Med 2002,
346:1978-1988.
43. Astrand P-O, Rodahl K, Dahl HA, Stromme SB: Textbook of Work
Phys-iology: Physiological Bases of Exercise 4th edition. Canada: McGraw-Hill;
2003.
44. Smoyer KE, Rainham DG, Hewko JN: Heat-stress-related mortal-ity in five cities in Southern Ontario: 1980-1996. Int J Biomete-orol 2000, 44:190-197.
45. McMichael AJ, Wilkinson P, Kovats RS, Pattenden S, Hajat S, Arm-strong B, Vajanapoom N, Niciu EM, Mahomed H, Kingkeow C, et al.:
International study of temperature, heat and urban mortal-ity: the 'ISOTHURM' project. Int J Epidemiol 2008, 37:1121-1131. 46. Vaneckova P, Hart MA, Beggs PJ, de Dear RJ: Synoptic analysis of heat-related mortality in Sydney, Australia, 1993-2001. Int J
Biometeorol 2008, 52:439-451.
47. Barnett AG: Temperature and cardiovascular deaths in the US elderly: changes over time. Epidemiology 2007, 18:369-372. 48. Hajat SA, Ben G, Nelson Gouveia, Paul Wilkinson: Mortality
Dis-placement of Heat-Related Deaths: A Comparison of Delhi, Sao Paulo, and London. Epidemiology 2005, 16:613.
49. Michelozzi P, De Sario M, Accetta G, de'Donato F, Kirchmayer U, D'Ovidio M, Perucci CA: Temperature and summer mortality: geographical and temporal variations in four Italian cities. J
Epidemiol Community Health 2006, 60:417-423.
50. Pattenden S: Mortality and temperature in Sofia and London.
2003.
51. Ren C, Williams GM, Tong S: Does particulate matter modify the association between temperature and cardiorespiratory diseases? Environ Health Perspect 2006, 114:1690-1696.
52. Yip FY, Flanders WD, Wolkin A, Engelthaler D, Humble W, Neri A, Lewis L, Backer L, Rubin C: The impact of excess heat events in Maricopa County, Arizona: 2000-2005. Int J Biometeorol 2008,