RESEARCH
Developing a high-throughput phenotyping
method for oxidative stress tolerance in barley
roots
Haiyang Wang, Lana Shabala, Meixue Zhou and Sergey Shabala
*Abstract
Background: More than 20% of the world’s agricultural land is affected by salinity, resulting in multibillion-dollar penalties and jeopardising food security. While the recent progress in molecular technologies has significantly advanced plant breeding for salinity stress tolerance, accurate plant phenotyping remains a bottleneck of many breeding programs. We have recently shown the existence of a strong causal link between salinity and oxidative stress tolerance in cereals (wheat and barley). Using the microelectrode ion flux estimation (MIFE) method, we have also found a major QTL conferring ROS control of ion flux in roots that coincided with the major QTL for the overall salinity stress tolerance. These findings open new (previously unexplored) prospects of improving salinity tolerance by pyra-miding this trait alongside with other (traditional) mechanisms.
Results: In this work, two high-throughput phenotyping methods—viability assay and root growth assay—were tested and assessed as a viable alternative to the (technically complicated) MIFE method using barley as a check spe-cies. In viability staining experiments, a dose-dependent H2O2-triggered loss of root cell viability was observed, with salt sensitive varieties showing significantly more damage to root cells. In the root growth assays, relative root length (RRL) was measured in plants grown in paper rolls under different H2O2 concentrations. The biggest difference in RRL between contrasting varieties was observed for 1 mM H2O2 treatment. Under these conditions, a significant negative correlation in the reduction in RRL and the overall salinity tolerance is reported.
Conclusions: These findings offer plant breeders a convenient high throughput method to screen germplasm for oxidative stress tolerance, targeting root-based genes regulating ion homeostasis and thus conferring salinity stress tolerance in barley (and potentially other species).
Keywords: Salinity, Viability staining, Root growth assay, Phenotyping, Barley, Oxidative stress
© The Author(s) 2019. This article is distributed under the terms of the Creative Commons Attribution 4.0 International License
(http://creativecommons.org/licenses/by/4.0/), which permits unrestricted use, distribution, and reproduction in any medium,
provided you give appropriate credit to the original author(s) and the source, provide a link to the Creative Commons license, and indicate if changes were made. The Creative Commons Public Domain Dedication waiver (http://creativecommons.org/
publicdomain/zero/1.0/) applies to the data made available in this article, unless otherwise stated.
Background
Both global climate change and unsustainable agricul-tural practices resulted in significant soil salinization thus reducing crop yields [1, 2]. Until now, more than 20% of the world’s agricultural land (which accounts for 6% of the world’s total land), has been affected by exces-sive salts; this number is increasing daily [2, 3]. Given the fact that more food need to be acquired from the limited arable land to feed the expanding world population in
the next few decades [4–6], generating crop germplasm which can grow in high-salt-content soil is considering a major avenue to fully utilise salt-affected land [7].
One of constraints imposed by salinity stress on plants is an excessive production and accumulation of reac-tive oxygen species (ROS), causing oxidareac-tive stress. This results in a major perturbation to cellular ionic homeo-stasis [8] and, in extreme cases, to a severe damage to plant lipids, DNA, proteins, pigments and enzymes [9, 10]. Plants deal with excessive ROS production by increased activity of antioxidants (AO). However, given the fact that AO profiles show strong time- and tissue- (and even organelle-specific) dependence and in 50%
Open Access
*Correspondence: [email protected]
cases do not correlate with salinity stress tolerance [11], the use of AO activity as a biochemical marker for salt tolerance is highly questionable [12].
Recently we have shown that roots of salt-tolerant bar-ley and wheat varieties possessed greater K+ retention
and lower Ca2+ uptake when challenged with H
2O2 [13]. These ionic traits were measured by using the micro-electrode ion flux estimation (MIFE) technique. We have then applied this newly developed cell-based phenotyp-ing MIFE platform to DH (double haploid) barley lines, revealing a major QTL for the above flux traits (Wang, Zhou, Shabala, unpublished observations). These find-ings open exciting prospects for plant breeders to screen germplasm for oxidative stress tolerance, targeting root-based genes regulating ion homeostasis and thus conferring salinity stress tolerance. The bottleneck in application of this technique in breeding programs is a currently low throughput capacity and technical compli-cations of using the MIFE method.
The MIFE technique works as a non-invasive tool to monitor kinetics of net ion transport (uptake or release) across cellular membranes by using ion-selective micro-electrodes [14]. This is based on the measurement of electrochemical gradients near the root surface. The microelectrodes are made on daily basis by the user by filling prefabricated pulled microcapillary with a sharp tip (several microns diameter) with specific backfill-ing solution and appropriate liquid ionophore, specific to the measured ion. Plant roots are mounted in a hori-zontal position in a measuring chamber, and electrodes are positioned in a proximity of the root surface using hand-controlled micromanipulators. Electrodes are then moved in a slow square-wave 12 s cycle, measuring ion diffusion profiles [15]. Net ion fluxes are then calculated based on measured voltage gradients between two posi-tions, close to the root surface (e.g. 20 µm), and some dis-tance (e.g. 50 µm) away. The method is skill-demanding and requires appropriate training of the personnel. The initial setup cost is relatively high (between $60,000 and $100,000, depending on a configuration and availabil-ity of axillary equipment), and the measurement of one specimen requires 20–25 min. Accounting for the addi-tional time required for electrodes manufacturing and calibration, one operator can process between 15 and 20 specimens per business day using developed MIFE proto-cols [13]. As breeders are usually interested in screening hundreds of genotypes, the MIFE method in its current form is hardly applicable for such a work.
In this work, we attempted to seek much simpler alter-native phenotyping methods that can be used as a proxy to screen cereal plants for oxidative stress tolerance. To do so, we developed and compared two high-through-put assays (a viability assay and a root growth assay)
for oxidative stress screening of a representative cereal crop: barley (Hordeum vulgare). The biological rationale behind these approaches lies in a fact that ROS-induced cytosolic K+ depletion triggers programmed cell death
[16–18] and results in the loss of cell viability. This effect is strongest in the root apex [19] and is associated with an arrest of the root growth. Reliability and feasibility of these high-throughput assays for plant breeding for oxi-dative stress tolerance are discussed in this paper.
Methods
Plant materials and growth conditions
Eleven barley (ten Hordeum vulgare L. and one H. vulgare
ssp. Spontaneum) genotypes were used in this study. All seeds were obtained from the Australian Winter Cereal Collection (see Table 1). Seeds were surface sterilized with tenfold-diluted commercial bleach for 12 min and then rinsed for at least 30 min with a running tap water. Sterilized seeds were germinated in Petri dishes on wet filter paper for 1 day. Uniformly germinated seeds were then chosen, placed in paper rolls [20], and grown in a basic salt medium (BSM: 0.1 mM CaCl2 and 0.5 mM KCl, pH 5.6) in darkness at 24 ± 1 °C for another 3 days.
Two different types of H2O2 treatment were used. In one experiment, H2O2 was added to the beaker contain-ing paper roll with 1 day old germinatcontain-ing seeds, and the treatment lasted for 3 days. In another experiment, the treatment was applied to 3-days old seedlings and lasted for 1 days, so in both cases plant seedlings were 4-days old at the time of analysis. H2O2 was added directly to BSM solution in the beaker before placing paper rolls. Concentrations of H2O2 ranged from 0 to 10 mM. Fresh
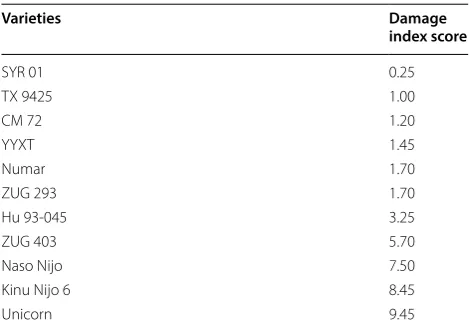
Table 1 Barley varieties used in the study
The damage index scores represent quantified damage degree of barley under salinity stress, with scores from 0 to 10 indicating barley overall salinity tolerance from the best (0) to the worst (10)
Varieties Damage
index score
SYR 01 0.25
TX 9425 1.00
CM 72 1.20
YYXT 1.45
Numar 1.70
ZUG 293 1.70
Hu 93-045 3.25
ZUG 403 5.70
Naso Nijo 7.50
Kinu Nijo 6 8.45
solutions were made on daily basis to compensate for a possible decrease of H2O2 activity.
Viability assay
Viability assessment of barley root cells was performed using a double staining method that included fluorescein diacetate (FDA, Cat. No. F7378, Sigma-Aldrich) and pro-pidium iodide (PI, Cat. No. P4864, Sigma-Aldrich) [21]. Briefly, 5 mm long seminal root segments were isolated from both a root tip and a root mature zone (20–30 mm from the root tip) from control and H2O2-treated plants. The isolated segments were stained with freshly prepared 5 µg/ml FDA for 5 min followed by 3 µg/ml PI for 10 min, and washed thoroughly with distilled water. Stained root segment was placed on a microscope slide, covered with a cover slip, and assessed immediately using a fluorescent microscope. Staining and slide preparation were done in darkness. A fluorescent microscope (Leica MZ12; Leica Microsystems, Wetzlar, Germany) with I3-wavelength filter (Leica Microsystems) and illuminated by an ultra-high-pressure mercury lamp (Leica HBO Hg 100 W; Leica Microsystems) was used to examine stained root segments. The excitation and emission wavelengths for FDA and PI were 450–495 nm and 495–570 nm respec-tively. Photographs were taken by a digital camera (Leica DFC295, Leica Microsystems). Images were acquired and processed by LAS V3.8 software (Leica Microsys-tems). The exposure features of the camera were set to constant values (gain 1.0×, saturation 1.0, gamma 1.0) in each experiment, allowing direct comparison of various genotypes. For untreated roots, the exposure time was 591 ms; for H2O2-treated roots it was increased to 1.9 s. The overview of the experimental protocol for viabil-ity assay by the FDA - PI double staining method can be found in Additional file 1: Figure S1.
Fluorescence intensity quantification
The ImageJ software was used to quantify red fluores-cence intensity that is indicative of the proportion of dead cells [22]. The acquired fluorescent image was opened in ImageJ and colour channel of the image were split into green, red and blue. The “polygon selections” from the tool bar of ImageJ was used to select an area from root elongation (0.3 mm from root tip) and/or mature zone (anywhere of the cut mature root segments) from the image with red channel. The measurement was conducted by going to “Analyze” option at the main menu, followed by the “Measure” option. The results will be shown in a pop-up window containing the size of the measuring area chosen, the minimum/maximum/ mean value of the red fluorescence intensity. Images of H2O2-treated roots were normalised using control (untreated) roots as a background. The red fluorescence
intensity (mean value) was recorded as removal of inten-sity in untreated roots from H2O2-treated root in arbi-trary units.
Root growth assay
The length of the longest seminal root was measured form 4-days old barley seedlings using a ruler after 3 days of treatments with various concentrations of H2O2 rang-ing between 0 and 10 mM (0, 0.1, 0.3, 1, 3, 10 mM). The relative root lengths (RRL) were estimated as percentage of root lengths to controls of the respective genotypes.
The damage index score
The damage index was used as a measure of the overall salt stress tolerance. This index is based on the extent of leaf necrosis and chlorosis in plants exposed to prolonged (5–6 weeks) salinity and quantified on 0–10 scale (0—no visual stress symptoms; 10—dead plants) [23–26]. Being measured at the vegetative stage, this damage index cor-relates significantly with the relative grain yield at the time of harvest and thus is a convenient proxy for quanti-fication of plant salinity stress tolerance [13, 25].
Statistical analysis
Statistical significance of mean values was determined by the standard Student’s t test at P < 0.05 level.
Results
H2O2 causes loss of the cell viability in a dose‑dependent
manner
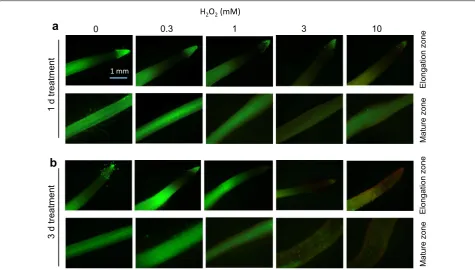
Barley variety Naso Nijo was used to study dose-depend-ent effects of H2O2 on cell viability. The concentrations of H2O2 used was from 0.3 to 10 mM. Both 1 day- (Fig. 1a) and 3 days- (Fig. 1b) exposure to oxidative stress caused dose-dependent loss of the root cell viability. One-day H2O2 treatment was less severe and was observed only at the highest H2O2 concentration used (Fig. 1a). When roots were treated with H2O2 for 3 days, the red fluores-cence signal can be readily observed from H2O2 treat-ments above 3 mM (Fig. 1b).
mature zone (Fig. 2b; significant at P < 0.05). Accord-ingly, 10 mM H2O2 with 3 days treatment was chosen as the optimum experimental treatment for viability staining assays on contrasting barley varieties.
Genetic variability of root cell viability in response
to 10 mM H2O2
Five contrasting barley varieties (salt tolerant: CM 72 and YYXT; salt sensitive: ZUG 403, Naso Nijo and Unicorn)
0 0.3 1 3 10
Elongation zone
Mature
zone
1 mm
a
Elongation zone
Mature
zone
1d
treatment
3d
treatmen
t
b
H2O2(mM)
Fig. 1 Viability staining of Naso Nijo roots (elongation and mature zones) exposed to 0, 0.3, 1, 3, 10 mM H2O2 for 1 day (a) and 3 days (b). One (of
five) typical images is shown from each concentration and root zone. Bar = 1 mm
0 5 10 15 20
0 2 4 6 8 10
Red fluorescence intensit
y,
arb. units
H2O2(mM)
Elongation zone Mature Zone
a
0 5 10 15 20
0 2 4 6 8 10
Red fluorescence intensit
y,
arb. unit
s
H2O2(mM)
Elongation zone Mature zone
b
1 d treatment 3 d treatment
Fig. 2 Red fluorescence intensity (in arbitrary units) measured from roots of Naso Nijo upon exposure to various H2O2 concentrations for either
were employed to explore the extent of root damage upon oxidative stress by the means of viability staining of both elongation and mature root zones. A visual assessment showed a clear root damage upon 3 days-exposure to 10 mM H2O2 in all barley varieties and both root zones, and damage in the elongation zone was more severe than in the mature zone (Fig. 3).
The quantitative analysis of the fluorescence inten-sity revealed that salt sensitive varieties showed stronger red fluorescence signal in the root elonga-tion zone than tolerant ones (Fig. 4a), indicating much severe root damage in the former genotypes. However, root damage between CM 72 and YYXT was insig-nificant. The similar trend was also found among salt
CM 72 YYXT ZUG 403 Unicorn
Contro
l
10
mM
H2 O2
a
Contro
l
10
mM
H2 O2
Elongation
zone
Mature zone
b
1 mm
Naso Nijo
Fig. 3 Viability staining of root elongation (a) and mature (b) zones of four barley varieties (CM 72, YYXT, ZUG 403, Unicorn) exposed to 10 mM H2O2
for 3 days. One (of five) typical images is shown for each zone. Bar = 1 mm
0 3 6 9 12 15
Red fluorescence intensit
y,
arb. unit
s
b
Mature zonea a a
a a
0 4 8 12 16 20
Red fluorescence intensit
y,
arb. unit
s
a
Elongation zonea a
b b bc
Fig. 4 Quantitative red fluorescence intensity from root elongation (a) and mature zones (b) of five barley varieties exposed to 10 mM H2O2 for
sensitive varieties ZUG 403, Naso Nijo and Unicorn (Fig. 4a). In mature root zone, no significant difference was observed amongst the root cell viability of five contrasting varieties studied (Fig. 4b).
The results in this section were consistent with our previous findings by using MIFE technique [13], which elucidated that not only oxidative stress-induced tran-sient ions fluxes but also long-term root damage may correlate with the overall salinity tolerance in barley. Before this conclusion is generalized and make it appli-cable to other plant species, it requires further valida-tion using larger number of plant accessions. However, given the fact that the magnitude of H2O2-induced K+ and Ca2+ fluxes were about the same for barley
and wheat [13], we have all the reasons to believe the required modifications will be rather minor.
Based on these findings, we can conclude that plant oxidative and salinity stress tolerance in barley may be quantified by the viability staining of roots treated with 10 mM H2O2 for 3 days that would include stain-ing the root tips with FDA and PI, and then quantify-ing intensity of the red fluorescence signal (dead cells) from the root elongation zone. This protocol is simpler and quicker than MIFE assessment and requires only a few minutes of measurements per sample, making this assay compliant with the requirements for high throughput assays.
Methodological experiments for cereal screening in root growth upon oxidative stress
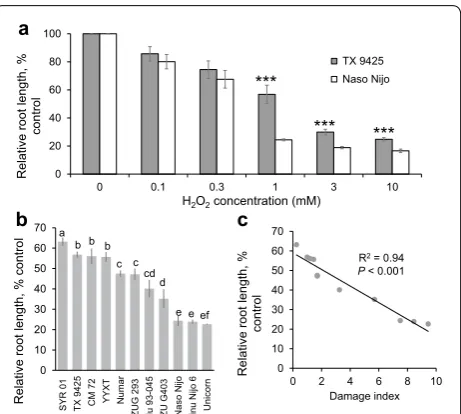
Being a high throughput in nature, the above imaging assay still requires sophisticated and costly equipment (e.g. high-quality fluorescence camera; microscope etc.), and thus may be not easily applicable by all the breeders. This has prompted us to go along another avenue by testing root growth assays. Two contrast-ing barley varieties, TX 9425 (salt tolerant) and Naso Nijo (salt sensitive) were used for standardizing con-centration of ROS (H2O2) treatment in preliminary experiments. After 3 days of H2O2 treatment, root length declined in both the varieties for any given con-centration tested (0.1, 0.3, 1, 3, 10 mM), and salt tol-erant variety TX 9425 grew better (had higher relative root length, RRL) than salt sensitive variety Naso Nijo at each treatment used (Fig. 5a). The decreased RRL showed the dose-dependency upon increasing H2O2 concentration, with a strong difference (P < 0.001) occurring from 1 to 10 mM H2O2 treatments between the contrasting varieties (Fig. 5a). The biggest differ-ence in RRL between the varieties was observed under 1 mM H2O2 treatment (Fig. 5a), which was chosen for screening assays.
H2O2‑induced changes of root length correlate
with the overall salinity tolerance
Eleven barley varieties were selected to test the relation-ship between the root growth under oxidative stress and their overall salinity tolerance under 1 mM H2O2 treat-ment. After 3 days exposure to 1 mM H2O2, the relative root length (RRL) of all the barley varieties reduced rap-idly, ranging from the lowest 22.7% ± 0.3 (in the variety
Unicorn) to the highest 63.2% ± 2 (in SYR01) (Fig. 5b).
The RRL values were then correlated with the “dam-age index” scores (Table 1). A significant correlation (r2= 0.94, P < 0.001) between RRL and the overall
salin-ity tolerance was observed (Fig. 5c), indicating a strong suitability of the RRL assay method as a proxy for oxida-tive/salinity stress tolerance. Given the “no cost no skill” nature of this method, it can be easily taken on board by plant breeders for screening the germplasm and mapping QTLs for oxidative stress tolerance (one of components of the salt tolerance mechanism).
Discussion
H2O2 causes a loss of the cell viability and decline
of growth in barley roots
H2O2 is one of the major ROS produced in plant tissues under stress conditions that leads to oxidative damage.
0 20 40 60 80 100
0 0.1 0.3 1 3 10
Relative root
length, %
contro
l
H2O2concentration (mM)
TX 9425 Naso Nijo
*** *** ***
a
0 10 20 30 40 50 60 70
SYR 01 TX 9425 CM 72 YYXT Numa
r
ZUG 29
3
Hu 93-045 ZU G403 Naso Nijo Kinu Nijo
6
Unicor
n
Relative root
length, % contro
l a
b b b c c
cd d
e e ef
b
0 10 20 30 40 50 60 70
0 2 4 6 8 10
Relative root
length, %
contro
l
Damage index
c
R2= 0.94
P< 0.001
Fig. 5 a Relative root length of TX 9425 and Naso Nijo seedlings
treated with 0, 0.1, 0.3, 1, 3, 10 mM H2O2 for 3 days. Mean ± SE
(n= 20). Asterisks indicate statistically significant differences between
two varieties at P < 0.001 (Student’s t test). b Genetic variability in the
relative root length in 11 barley varieties treated with 1 mM H2O2
for 3 days. Mean ± SE (n= 20). c Correlation between H2O2–treated
relative root length and the overall salinity tolerance (damage index,
The effect of this stable oxidant on plant cell viability and root growth was investigated in this study. Both param-eters decreased in a dose- and/or time-dependent man-ner upon H2O2 exposure (Figs. 1, 5a). The physiological rationale behind these observations may lay in a fact that exogenous application of H2O2 causes instantaneous [K+]
cyt and [Ca2+]cyt changes in different root zones [13]. Stress-induced enhanced K+ leakage from root
epider-mis results in depletion of cytosolic K+ pool [27] thus
activating caspase-like proteases and endonucleases and triggering PCD [17, 28], leading to deleterious effect on plant viability [29]. This is reflected in our findings that roots lost their viability after being treated with H2O2, especially upon higher dosage and long-term exposure (Fig. 2). Furthermore, K+ is required for root cell
expan-sion [30] and plays a key role in stimulating growth [31,
32]. Therefore, the loss of a large quantity of cytosolic K+
might be the primary reason for the inhibition of the root elongation in our experiments (Fig. 5a, b). This is con-sistent with root growth retardation observed in plants grown in low-K+ media [33].
High concentration of cytosolic K+ is essential for
opti-mizing plant growth and development. Also essential is maintenance of stable (and relatively low) levels of cyto-solic free Ca2+ [34, 35]. Therefore, H
2O2-induced cyto-solic Ca2+ disequilibrium may be another contributing
factor to the observed loss of cell viability and reported decrease in the relative root length in this study (Figs. 3,
5a, b). Previously we showed that plants responded to H2O2 by increased Ca2+ uptake in mature root epider-mis [13]. This is expected to result in [Ca2+]
cyt elevation that may be deleterious to plants, as it causes protein and nucleic acids aggregation, initiates phosphates pre-cipitation and affects the integrity of the lipid membranes [36]. It may also make cell walls less plastic through rigidification, thus inhibiting cell growth [34]. In root tips, however, increased Ca2+ loading is required for the
stimulation of actin/myosin interaction to accelerate exo-cytosis that sustains cell expansion and elongation [37]. The rhd2 Arabidopsis mutant lacking functional NADPH oxidase exhibited stunted roots as plants were unable to produce sufficient ROS to activate Ca2+-permeable
NSCCs to enable Ca2+ loading into the cytosol [38].
Salt tolerant barley roots possess higher root viability in the elongation zone after long‑term ROS exposure
It was argued that the ROS-induced self-amplification mechanism between Ca2+-activated NADPH oxidases
and ROS-activated Ca2+-permeable cation channels in
the plasma membrane, and transient K+ leakage from
cytosol, may be both essential for the early stress signal-ling [29, 39, 40]. As salt sensing mechansim is most likely located in the root meristem [41], this may explain why
the correlation between the overall salinity tolerance and H2O2-induced transient ions fluxes was not found in this zone in short-term experiments [13]. Under long-term H2O2 exposures, however (as in this study), we observed less severe root damage in the elongation zone in salt tolerant varieties (Fig. 4a). This suggested a pos-sible recovery of these genotypes from the “hibernated state” (transferred from normal metabolism by reducing cytosolic K+ and Ca2+ content for salt stress acclimation)
to stress defence mechanisms [42], which may include a superior capability in maintaining more negative mem-brane potential and increasing the production of metab-olites in this zone [19]. This is consistent with a notion of salt tolerant genotypes being capable of maintaining more negative membrane potential values resulting from higher H+-ATPases activity in many species [43–45], and
the fact that a QTL for the membrane potential in root epidermal cells was co-located with a major QTL for the overall salinity stress tolerance [46].
In the mature root zone, the salt-sensitive varieties possessed a higher transient K+ efflux in response to
H2O2 [13]; yet no major difference in viability staining was observed amongst the genotypes in this root zone after a long-term (3 days) H2O2 exposure (Figs. 3b, 4b). This is counterintuitive and suggests an involvement of some additional mechanisms. One of these mechanisms may be a replenishing of the cytosolic K+ pool on the
expense of the vacuole. As a major ionic osmoticum in both the cytosolic and vacuolar pools, potassium has a significant role in maintaining cell turgor, especially in the latter compartment [47]. Increasing cytosolic Ca2+
was first shown to activate voltage-independent vacu-olar K+-selective (VK) channels in Vicia Faba guard cells
[48], mediating K+ back leak into cytosol from the
vacu-ole pool. This observation was later extended to cell types isolated from Arabidopsis shoot and root tissues [49], as well as other species such as barley, rice and tobacco [50]. Thus, the higher Ca2+ influx in sensitive varieties upon
H2O2 treatment is expected to increase their cytosolic free Ca2+ concentration thus inducing a strong K+ leak
from the vacuole, to compensate for the cytosolic K+ loss
from ROS-activated GORK channel. This process will be attenuated in the salt tolerant varieties, that have lower H2O2-induced Ca2+ uptake. As a result, 3 days after the stress onset, the amount of K+ in the cytosol in mature
root zone may be not different between contrasting varie-ties, explaining the lack of difference in viability staining.
Evaluating root growth assay screening for oxidative stress tolerance
the progress in plant phenotyping has been much slower and in most cases lack direct causal relationship with the traits targeted. However, future breeding programmes are in a need of a sensitive, low cost and efficient high-throughput phenotyping methods. The novel approach developed in our previous study allowed to use the MIFE technique for the cell-based phenotyping [13] for root sensitivity to ROS, one of the key components of mecha-nism of salinity stress tolerance. Being extremely sensitive and allowing to directly target operation of specific trans-port proteins, this method is highly sophisticated and is not expected to be easily embraced by breeders. In this study, we provided an alternative approach, namely root growth assay, which can be used as the high-throughput phenotyping method to replace the sophisticated MIFE technique. This screening method has minimal space requirements (only a small growth room) and no meas-uring equipment except a simple ruler. Assuming one can acquire five length measurements per minute and 20 biological replicates are sufficient for one genotype, the time needed for one genotype is just four minutes, which means one can finish the screening of 100 varieties within one working day. This is a blazing fast avenue compared to most other methods. This offers plant breeders a con-venient assay to screen germplasm for oxidative stress tolerance and identify root-based QTLs regulating ion homeostasis and conferring salinity stress tolerance.
In this work, this method was only tested in barley used as a check species. However, given the fact that salt-induced increase in ROS production in roots is a general biological phenomenon [52–54], we expect that results of this study may be extrapolated to other plant species including all major cereal crops, after fine-tuning of the exposure times and concentrations of H2O2 used and acquiring the damage index scores of these plants.
Conclusions
Our results show that oxidative and salinity stress toler-ance phenotyping in barley may be conducted by stain-ing with FDA and PI and then quantifystain-ing the intensity of red fluorescence signal from H2O2-treated root elon-gation zone, or by measuring roots lengths after the same treatment with the former. However, the latter method is low/no-cost and easy-to-implement thus may be recom-mended as an alternative phenotyping method in future screening programs.
Additional file
Additional file 1: Fig. S1. Flowchart of viability staining and fluorescence image acquisition. a Preparation of root sample for viability staining. (From left to right panel) Surfaced sterilized seeds were germinated in a large
Petri dish with wet filter paper for 1 day. Uniformly germinated seeds were then chosen and placed in paper rolls before placing it in a beaker with growth media for another 3 days. Isolated root segments were placed in a micro Petri dish containing 5 µg/ml FDA for 5 min and then transferred to another micro Petri dish containing 3 µg/ml PI for 10 min; Stained root segments were washed with distilled water and positioned on a glass slide and covered with a cover slip. b The prepared slide was placed on a fluorescent microscope mechanical stage under the fluorescent light and root fluorescent image was acquired by the LAS V3.8 software.
Abbreviations
MIFE: microelectrode ion flux estimation; QTL: quantitative trait locus; ROS: reactive oxygen species; RRL: relative root length; AO: antioxidants; DH: double haploid; FDA: fluorescein diacetate; PI: propidium iodide; NSCCs: non-selective cation channels; PCD: programmed cell death; VK: vacuolar K+-selective chan-nels; GORK: guard cell outward rectifying K+ channel.
Authors’ contributions
HW performed the experiments, analysed the data and wrote the manuscript under the direction and supervision of SS. SS, MZ and LS conceived and designed the experiments. LS and MZ contributed reagents/materials/analysis tools. All authors read and approved the final manuscript.
Acknowledgments
Thanks for the support of grants from Grain Research and Development Corporation and Australian Research Council Discovery
Competing interests
The authors declare that they have no competing interests.
Availability of data and materials
Not applicable.
Consent for publication
Not applicable.
Ethics approval and consent to participate
Not applicable.
Publisher’s Note
Springer Nature remains neutral with regard to jurisdictional claims in pub-lished maps and institutional affiliations.
Received: 12 April 2018 Accepted: 29 January 2019
References
1. Horie T, Karahara I, Katsuhara M. Salinity tolerance mechanisms in glyco-phytes: an overview with the central focus on rice plants. Rice. 2012;5:11. 2. Ismail AM, Horie T. Genomics, physiology, and molecular
breed-ing approaches for improvbreed-ing salt tolerance. Annu Rev Plant Biol. 2017;68:405–34.
3. Gupta B, Huang BR. Mechanism of salinity tolerance in plants: physiologi-cal, biochemiphysiologi-cal, and molecular characterization. Int J Genomics. 2014.
https ://doi.org/10.1155/2014/70159 6.
4. Brown ME, Funk CC. Food security under climate change. Science. 2008;319:580–1.
5. Ruan CJ, da Silva JAT, Mopper S, Qin P, Lutts S. Halophyte improvement for a salinized world. Crit Rev Plant Sci. 2010;29:329–59.
6. Millar J, Roots J. Changes in Australian agriculture and land use: implica-tions for future food security. Int J Agric Sustain. 2012;10:25–39. 7. Shabala S. Learning from halophytes: physiological basis and strategies to
improve abiotic stress tolerance in crops. Ann Bot. 2013;112:1209–21. 8. Demidchik V. Mechanisms of oxidative stress in plants: from classical
9. Ozgur R, Uzilday B, Sekmen AH, Turkan I. Reactive oxygen species regulation and antioxidant defence in halophytes. Funct Plant Biol. 2013;40:832–47.
10. Choudhury FK, Rivero RM, Blumwald E, Mittler R. Reactive oxygen species, abiotic stress and stress combination. Plant J. 2017;90:856–67.
11. Bose J, Rodrigo-Moreno A, Shabala S. ROS homeostasis in halophytes in the context of salinity stress tolerance. J Exp Bot. 2014;65:1241–57. 12. Tanveer M, Shabala S. Targeting redox regulatory mechanisms for salinity
stress tolerance in crops. In: Kumar V, Wani S, Suprasanna P, Tran LS, editors. Salinity responses and tolerance in plants. Cham: Springer; 2018. p. 213–34. 13. Wang H, Shabala L, Zhou M, Shabala S. Hydrogen peroxide-induced root Ca2+ and K+ fluxes correlate with salt tolerance in cereals: towards the cell-based phenotyping. Int J Mol Sci. 2018;19:702.
14. Shabala SN, Newman IA, Morris J. Oscillations in H+ and Ca2+ ion fluxes around the elongation region of corn roots and effects of external pH. Plant Physiol. 1997;113:111–8.
15. Shabala L, Ross T, McMeekin T, Shabala S. Non-invasive microelectrode ion flux measurements to study adaptive responses of microorganisms to the environment. FEMS Microbiol Rev. 2006;30:472–86.
16. Shabala S, Cuin TA, Prismall L, Nemchinov LG. Expression of animal CED-9 anti-apoptotic gene in tobacco modifies plasma membrane ion fluxes in response to salinity and oxidative stress. Planta. 2007;227:189–97. 17. Shabala S. Salinity and programmed cell death: unravelling mechanisms
for ion specific signalling. J Exp Bot. 2009;60:709–12.
18. Demidchik V, Cuin TA, Svistunenko D, Smith SJ, Miller AJ, Shabala S, Sokolik A, Yurin V. Arabidopsis root K+-efflux conductance activated by hydroxyl radicals: single-channel properties, genetic basis and involve-ment in stress-induced cell death. J Cell Sci. 2010;123:1468–79.
19. Shabala L, Zhang J, Pottosin I, Bose J, Zhu M, Fuglsang AT, Velarde-Buendia A, Massart A, Hill CB, Roessner U, Bacic A, Wu H, Azzarello E, Pandolfi C, Zhou M, Poschenrieder C, Mancuso S, Shabala S. Cell-type-specific H+-ATPase activity in root tissues enables K+ retention and mediates acclimation of barley (Hordeum vulgare) to salinity stress. Plant Physiol. 2016;172:2445–58. 20. Pandolfi C, Pottosin I, Cuin T, Mancuso S, Shabala S. Specificity of
polyam-ine effects on NaCl-induced ion flux kpolyam-inetics and salt stress amelioration in plants. Plant Cell Physiol. 2010;51:422–34.
21. Koyama H, Toda T, Yokota S, Dawair Z, Hara T. Effects of aluminum and pH on root growth and cell viability in Arabidopsis thaliana strain Landsberg in hydroponic culture. Plant Cell Physiol. 1995;36:201–5.
22. Gill MB, Zeng F, Shabala L, Bohm J, Zhang G, Zhou M, Shabala S. The ability to regulate voltage-gated K+-permeable channels in the mature root epidermis is essential for waterlogging tolerance in barley. J Exp Bot. 2018;69:667–80.
23. Wu H, Zhu M, Shabala L, Zhou M, Shabala S. K+ retention in leaf meso-phyll, an overlooked component of salinity tolerance mechanism: a case study for barley. J Integr Plant Biol. 2015;57:171–85.
24. Wu H, Shabala L, Zhou M, Shabala S. Durum and bread wheat differ in their ability to retain potassium in leaf mesophyll: implications for salinity stress tolerance. Plant Cell Physiol. 2014;55:1749–62.
25. Wu H, Shabala L, Azzarello E, Huang Y, Pandolfi C, Su N, Wu Q, Cai S, Bazi-hizina N, Wang L, Zhou M, Mancuso S, Chen Z, Shabala S. Na+ extrusion from the cytosol and tissue-specific Na+ sequestration in roots confer differential salt stress tolerance between durum and bread wheat. J Exp Bot. 2018;69:3987–4001.
26. Zhou G, Johnson P, Ryan PR, Delhaize E, Zhou M. Quantitative trait loci for salinity tolerance in barley (Hordeum vulgare L.). Mol Breed. 2012;29:427–36. 27. Shabala S, Demidchik V, Shabala L, Cuin TA, Smith SJ, Miller AJ, Davies
JM, Newman IA. Extracellular Ca2+ ameliorates NaCl-induced K+ loss from Arabidopsis root and leaf cells by controlling plasma membrane K+-permeable channels. Plant Physiol. 2006;141:1653–65.
28. Demidchik V, Straltsova D, Medvedev SS, Pozhvanov GA, Sokolik A, Yurin V. Stress-induced electrolyte leakage: the role of K+-permeable channels and involvement in programmed cell death and metabolic adjustment. J Exp Bot. 2014;65:1259–70.
29. Shabala S. Signalling by potassium: another second messenger to add to the list? J Exp Bot. 2017;68:4003–7.
30. Walker DJ, Black CR, Miller AJ. The role of cytosolic potassium and pH in the growth of barley roots. Plant Physiol. 1998;118:957–64.
31. Nieves-Cordones M, Aleman F, Martinez V, Rubio F. K+ uptake in plant roots. The systems involved, their regulation and parallels in other organ-isms. Plant Physiol. 2014;171:688–95.
32. Demidchik V. Mechanisms and physiological roles of K+ efflux from root cells. Plant Physiol. 2014;171:696–707.
33. Kellermeier F, Chardon F, Amtmann A. Natural variation of Arabidopsis root architecture reveals complementing adaptive strategies to potas-sium starvation. Plant Physiol. 2013;161:1421–32.
34. Hepler PK. Calcium: a central regulator of plant growth and development. Plant Cell. 2005;17:2142–55.
35. Wang M, Zheng Q, Shen Q, Guo S. The critical role of potassium in plant stress response. Int J Mol Sci. 2013;14:7370–90.
36. Case RM, Eisner D, Gurney A, Jones O, Muallem S, Verkhratsky A. Evolution of calcium homeostasis: from birth of the first cell to an omnipresent signalling system. Cell Calcium. 2007;42:345–50.
37. Carol RJ, Dolan L. The role of reactive oxygen species in cell growth: les-sons from root hairs. J Exp Bot. 2006;57:1829–34.
38. Foreman J, Demidchik V, Bothwell JHF, Mylona P, Miedema H, Torres MA, Linstead P, Costa S, Brownlee C, Jones JDG, Davies JM, Dolan L. Reactive oxygen species produced by NADPH oxidase regulate plant cell growth. Nature. 2003;422:442–6.
39. Shabala S, Wu H, Bose J. Salt stress sensing and early signalling events in plant roots: current knowledge and hypothesis. Plant Sci. 2015;241:109–19.
40. Demidchik V, Shabala S. Mechanisms of cytosolic calcium elevation in plants: the role of ion channels, calcium extrusion systems and NADPH oxidase-mediated ‘ROS-Ca2+ Hub’. Funct Plant Biol. 2018;45:9–27. 41. Wu H, Shabala L, Liu X, Azzarello E, Zhou M, Pandolfi C, Chen Z, Bose J,
Mancuso S, Shabala S. Linking salinity stress tolerance with tissue-specific Na+ sequestration in wheat roots. Front Plant Sci. 2015;6:71.
42. Shabala S, Pottosin I. Regulation of potassium transport in plants under hostile conditions: implications for abiotic and biotic stress tolerance. Physiol Plant. 2014;151:257–79.
43. Chen Z, Pottosin II, Cuin TA, Fuglsang AT, Tester M, Jha D, Zepeda-Jazo I, Zhou M, Palmgren MG, Newman IA, Shabala S. Root plasma membrane transporters controlling K+/Na+ homeostasis in salt-stressed barley. Plant Physiol. 2007;145:1714–25.
44. Bose J, Rodrigo-Moreno A, Lai D, Xie Y, Shen W, Shabala S. Rapid regula-tion of the plasma membrane H+-ATPase activity is essential to salinity tolerance in two halophyte species, Atriplex lentiformis and Chenopodium quinoa. Ann Bot. 2014;115:481–94.
45. Lei B, Huang Y, Sun J, Xie J, Niu M, Liu Z, Fan M, Bie Z. Scanning ion-selec-tive electrode technique and X-ray microanalysis provide direct evidence of contrasting Na+ transport ability from root to shoot in salt-sensitive cucumber and salt-tolerant pumpkin under NaCl stress. Physiol Plant. 2014;152:738–48.
46. Gill MB, Zeng F, Shabala L, Zhang G, Fan Y, Shabala S, Zhou M. Cell-based phenotyping reveals QTL for membrane potential maintenance associ-ated with hypoxia and salinity stress tolerance in barley. Front Plant Sci. 2017;8:1941.
47. Walker DJ, Leigh RA, Miller AJ. Potassium homeostasis in vacuolate plant cells. Proc Natl Acad Sci USA. 1996;93:10510–4.
48. Ward JM, Schroeder JI. Calcium-activated K+ channels and calcium-induced calcium release by slow vacuolar ion channels in guard-cell vacuoles implicated in the control of stomatal closure. Plant Cell. 1994;6:669–83.
49. Gobert A, Isayenkov S, Voelker C, Czempinski K, Maathuis FJM. The two-pore channel TPK1 gene encodes the vacuolar K+ conductance and plays a role in K+ homeostasis. Proc Natl Acad Sci USA. 2007;104:10726–31. 50. Isayenkov S, Isner JC, Maathuis FJM. Vacuolar ion channels: roles in plant
nutrition and signalling. FEBS Lett. 2010;584:1982–8.
51. Nadeem MA, Nawaz MA, Shahid MQ, Doğan Y, Comertpay G, Yıldız M, Hatipoğlu R, Ahmad F, Alsaleh A, Labhane N, Özkan H, Chung G, Baloch FS. DNA molecular markers in plant breeding: current status and recent advancements in genomic selection and genome editing. Biotechnol Biotechnol Equip. 2018;32:261–85.
52. Luna C, Seffino LG, Arias C, Taleisnik E. Oxidative stress indicators as selec-tion tools for salt tolerance. Plant Breed. 2000;119:341–5.
53. Miller G, Shulaev V, Mittler R. Reactive oxygen signaling and abiotic stress. Physiol Plant. 2008;133:481–9.