All Rights Reserved © 2014 IJDCN
63
Analysis of Brainwave Disorders with Noise Removal Techniques
Using LABVIEW and MATLAB
S.Priyadarsini, V.Priyadharshini, M.Saranya
Abstract-- In the proposed work, we develop software tool used to process the brain signal to identify the brain disorders. Ag/AgCl electrodes are used to acquire the brain signal and gel is used to reduce the scalp impendence. EEG signal is pre-processed by removing artefact, power line interference noise and base line shift using LABVIEW and some of the noise features are eliminated using MATLAB. We use Dual Tree Complex Discrete Wavelet Transform (DTCWT) as an effective method for transforming. This introduces limited redundancy and allows the transform to provide approximate shift invariance and directionally selective filters while preserving the usual properties of perfect reconstruction and computational efficiency. DTCWT is a two-dimensional complex valued technique having two stages of Discrete Wavelet Transform for extracting the exact EEG signals. The extracted signals are classified under Gaussian Mixture Model (GMM). GMM uses clustering points which cluster the coefficients with similar characteristics using expectation maximization technique. It works well as a probabilistic and predictor category using density estimation functions. Thus, GMM classifier would produce good accuracy in the point of diagnosing exact brain disorders. On the whole, it works as an efficient analysis of brainwave disorders both in real time and by simulation with great accuracy, convenience in layman terms; playing a precise role of physicians thereby, providing a better quality in solution with better time and energy consumption.
Index terms/ keywords—EEG, artefacts, LABVIEW, feature extraction, MATLAB, DTCWT, GMM;
I. INTRODUCTION
Information’s are carried over in the form of impulses from neurons present in the brain. Neurons possess set of impulses generating electrical activity. Thus, the study of impulses can be recorded and analyzed using Electroencephalogram (EEG) in the form of brain waves. Any changes in brain rhythms are used in diagnosing the brain disorders.
Manuscript received April, 2016.
S.Priyadarsini, UG Student, Department of ECE, Kalasalingam University, e-mail: [email protected], Tamilnadu, India, Phone Number: 9487028295
V.Priyadharshini, UG Student, Department of ECE, Kalasalingam University, e-mail: [email protected], Tamilnadu, India, Phone Number: 8754711934
M.Saranya, UG Student, Department of ECE, Kalasalingam University, e-mail: [email protected], Tamilnadu, India, Phone Number: 8489261307
Electroencephalogram is the traditional technology that is used in the evolving phases of Medical sciences. They are being absolutely encountered to monitor or to retain the activities of human brain in his/her physical as well as mental pressures. Such EEG is sensitive, shift variant and highly losses directional selectivity problems.
We provide in our thesis the relative compensations that can be made to take in account a real tangent way for differentiating the disorders. Although, the entire system datasets possess a non-invasive method of recording, the drawbacks are factual that the artefacts in real time occur at the process. Artefacts are external noises that are introduced into the raw EEG signal, which are in the range of 0.4Hz-100Hz. These ranges are similar in amplitude and frequency having no differences within their physical properties. But, the brain rhythms can be uniquely identified with the cerebral origin. As artefacts originate from the non-cerebral origin they can be easily diminished using the VI’s present in the Laboratory Virtual Instrumentation Workbench (LABVIEW). LABVIEW is a software application from National Instruments that is specially designed for easy and powerful data acquisition purpose. Adding to the power line interference noise (50 Hz) and base line shift which end up with the internal noises produced in the raw EEG signals. These types of noises are specifically eliminated through the Dual Tree Complex Wavelet Transform in progress of sampling the signals and transforming them to get more data within the obtained input signals.
After the transforms are applied, the classification of the data is done through clustering them at different unlabelled levels thereby using un-supervised learning. The clustering methods are used with the latent datasets which retain their original signals using expectation maximization estimation algorithms. Thereby, we obtain local optima within the searched space of probabilistic mixture model. EEG signal is pre-processed by removing artefact, while preserving the usual properties of perfect reconstruction and computational efficiency.
II. BRAINWAVE PROCESSING
Brain waves are physically generated from human brain through the chemical excitations between different neurons. They are also known as Brain rhythms. Brain rhythms are classified as delta, theta, alpha, beta and gamma in terms of low to high frequency neuron firing.
A. Rhythm Classification:
All Rights Reserved © 2014 IJDCN
63
These waves occur in different parts of brain regions and at various degrees. These electrical frequencies are listed below:
, Gamma Waves (Greater than 31Hz), reflects the mental activeness such as attention, perception and cognition.
, Beta Waves (12-30Hz), occurs in central and frontal areas with focused concentration of resisting or suppressing movements. Also, when in hyper-excitable state for temporary alleviation such as consuming alcohol, etc.,
, Alpha Waves (7.5-12Hz), is a slow wave found at back of head and frontal lobe. These waves arise due to relaxation and disengagement, working in peace. Researchers say use of drugs such as marijuana smoking may evoke these waves.
, Theta Waves (3.5-7.5Hz), pertains to daydreaming, also, in deep meditation with creative thinking. Frequent waves in adults show Attention deficit hyperactivity disorder.
, Delta Waves (0.5-3.5Hz), are the slowest waves which occurs when sleeping. If occurs enormously in woken state, ensures physical defects in brain.
Apart from these normal frequencies which always determine us about the senses, there are frequencies which cause significant impacts. One such wave is Mu, which basically triggers only if actual movement takes place or if there is intent to move. They occur at the motor regions generating motor activities.
Figure. 1 Composite signal of EEG rhythms
III. EEG SIGNALS PREPROCESSING
EEG signals can be pre-processed to remove the contaminants from the raw signals. As already said, the contaminants may be due to internal or external environments. Internal sources are also known as noises and the external sources are airborne present in EEG signals
due to the surrounding environment. Some of the sources can be classified as follows:
Power line interference
Electrode pop - contact noises
Electromyography noise (EMG)
Electro-oculography noise (EOG)
Patient – electrode motion artefacts
Baseline wandering noise, etc.,
These noises are eliminated through different methods resolving each point of infinite set of raw data, into finite set of desired data.
A. Removing Artefacts:
Artefacts are sub-divided into physiologic and extra physiologic artefacts. The physiological artefacts are internally generated from the body except brain whereas, extra physiologic artefacts from surroundings. Later portrayed, is curable by making situations falling into circumstances and such artefacts are line interferences, baseline wandering etc., as they are airborne the amplitudes vary collaterally disturbing the signals in need.
Power line interferences occur in the range at the frequency between 50Hz-100Hz which is similar to the range of EEG signals those are system generated. These are due to the power source or the supplies that actually cross the line with Electromagnetic interference fluctuating both the involved signal and EEG signal. Similar to this, baseline wandering evokes at minute frequency of 0.15-0.3Hz; which are involved due to environmentally distorted signals. Both the extra physiological artefacts can be diminished using Wavelet transforms VI functions. VI, so called, Virtual Instrumentation functions are the pallets present in LabVIEW with a Block diagram and a Front panel. Block diagram is the back end, controlled by the controllers/VI icons from the front panel. Thus, it transforms waves with respect to the down sampling rate automatically executed in the VI. And the time domain data points are transferred into frequency domain using the fast Fourier transform. So that the spectrum could make a readability to the transforms that are to be applied helping in accuracy.
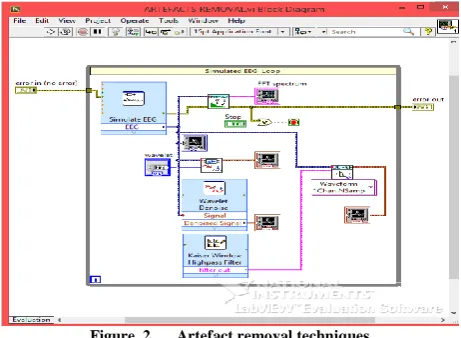
Figure. 2 Artefact removal techniques
All Rights Reserved © 2014 IJDCN
64
suppressed using a threshold shrinkage functions within the VI’s sub-bands or through using Un-decimated wavelet transform. Either way would reconstruct the signals after denoising technique.
Physiological artefacts are evacuated using following techniques. Such artefacts are normally prone to muscle tensions and ocular movements termed as electromyogram and electro-oculogram, respectively. Muscle artefact arises from the muscle which generates electrical fields and also by movements on layers of electrode contacts. It may also occur due to not-comparable circulation, as chewing and swallowing and also through surface-electromyography in which it is created from scalp and facial muscle. Ocular artefacts (electrooculogram) will be generated due to lateral gaze, eye movement, eye blink and also through rapid eye movements or REM sleep. This artefact will occur frequently by slowing of alpha rhythm. They are basically removed with the Automatic rejection and subtraction of artefact segments. The algorithm suits best for every patient. EOG and EMG signals are captured simultaneously using the frequency standards, and they are eliminated from the raw EEG signals which are an efficient method. They are used to identify and remove the artefacts such as Electrooculogram, Electromyogram and also other artefacts.
Thereby removing the artefacts that are generated, we move on to noise removal technique. As noises are handled using complex wavelet transform technique; which uses down sampling the signals into two different forms, proven of real and imaginary part.
B. Dual Tree Complex Wavelet Transform:
Wavelets are the combination of sinusoidal waves that are provided as an input from any other system. Wavelet techniques are applied in signal processing to solve various problems such as data compression, motion estimation, classification, denoising to name a few examples.
Steps must be taken to retain the wavelets special properties like symmetry, smoothness, shape which are also mandatory to get an accurate coefficients. Although the Discrete wavelet transforms, transform the wavelets with approximate coefficients. Most often problems occur in decimating the coefficients and providing a very poor quality of shift invariant system, leading to an undesired signal. Lack of shift invariant leads to the substantial shifts on the wavelet coefficients, due to shifts in the input signals. Thereby, stationary information in the sub-band signals changes with energy distribution. Due to which the signals collapses. Thus the signals are differentiated into complex waveforms of real and imaginary type. Where the signals reciprocated with each other and then down-sampled with two-steps.
During a shift of one sample there is significant impact on the signal energy. This shows that all the other methods or the orthogonal DWT is highly sensible to signal alignment relative to the number of sampling as well as sub-sampling points. To omit the sub-sampling effects in the shift dependence signals, redundancy are introduced with the decomposition forms. So, the coefficients are shift invariant as same as the input signals. But this is not highly applicable for common, complex data in signal processing.
This is applicable by using the technique introduced with 2m: 1 redundancy; where m, is the dimension of the signal.
D1a (z)
S (z)
D1b (z)
Figure.3 Decomposition of DTCWT
Therefore, for m-dimensions redundancy of at least 2m: 1 coefficients are essential for the decomposition form to prevent from lack of shift invariance.
DTCWT has complex wavelet coefficients in a dual-tree parallel real filter banks, filtered at different levels without any negative value of coefficients. The filters with normal functions would make the transform inefficient.
Consider a given signal s= (s0, s1... sN-1) of length N in
the time domain. In order to express the sampling operation in the frequency domain, by relying on the representation of our quantities. And the transform function the signal normally undergoes are described as follows:
S (z) = z-j= S0 (z2) + z-1 S1 (z2), (1)
We represent the transform used here as for i=0, 1 as, to maintain a stability factor in the frequency domain as follows:
Hi (z) = z-j= Hi0 (z2) + zHi1 (z2), (2)
Sj are nothing else than the sequence of even and odd
numbered coefficients, we use length on the two sequences for the data with high complexity to reduce further complexity.
If one additionally likes to work on the wavelet transforms or coefficients in time domain after the signals are sampled, the real signal must be processed with Inverse Transform of length .
Thus, the signals are denoised and extracted from the raw signal with the desired waves in hand. The analysis of these waves can now give us an appropriate measure of variety of disorders, which can be recognised with trained classifier. So, thereby we use a classifier which form clusters using the unlabelled sets of data and categorise the results, according to the algorithm specified.
H1a (Z)
H1 a (Z)
H1b (Z) H1
b (Z)
H2 a (Z)
H2a (Z)
H2 b (Z)
H2b (Z) 2
2
2
All Rights Reserved © 2014 IJDCN
65 Figure.4 Datasets of denoised EEG signals
IV. GAUSSIAN MIXTURE MODEL CLASSIFIER
The classifiers are of two types. They can be deterministic and statistical. Deterministic classifiers include a sort of algorithm which finds unlabelled parameters for initialisation and performs search in the search space. The statistical model defines the search space keeping in account the threshold values of density functions.
We operate on the statistical Gaussian mixture model (GMM), dealing of a probabilistic mixture model. It is a sort of unsupervised learning, training the input data without any class labels for predicting the character set of class and its parameters. We assume the Gaussian distribution to generate a random function of different orders which are verified, feedback and compared with the error functions. So called, parametric mixture model estimates the data distributed in accordance with the finite number of Gaussian model densities.
And it has a probability distribution function estimated with the model corresponding to the function as follows;
; (3)
k, number of Gaussian component
wi,, weight of Gaussian component; so that the distribution
function has all of its components generated within the range of overall probability 1.
;
Generation of several Gaussian models produces data as like the linear combinations of model, adding uniqueness to the classifier.
We estimate this using the Expectation Maximization (EM) technique; were in the “Expectation” step, we calculate the probabilities of each data point ordered with the clusters. In the “Maximization” step, we calculate the cluster means and covariance based on the probabilities calculated. This would produce a cluster covariance into account when forming the cluster. To kick start the EM, the dataset is equally divided between the clusters by selecting random data point as initial means. Each cluster is provided
with a prior probability, as the fraction of dataset that belongs to each cluster.
Figure5. Distributed Gaussian models
GMM has universal approximation of data instead of the basic concept functions. So, the algorithm goes as follows:
At the training stage, we need to obtain a GMM for each class. In other words, we need to use the data of a class to train a GMM. This is done sequentially for each class; there are no interactions between GMM of different classes.
At the application stage, we need to send the unknown-class data to the GMM of each class. The predicted class is the one associated with the GMM with the maximum probability.
Eventually, GMM Classifiers finds an independent Gaussian distribution but also finds solution with standard mean and covariance matrix. The optimum configuration of a classifier is usually chosen as the one that can have the maximum outside-test recognition rate. Thereby, classifying the encephalopathy we recognise the normality or abnormality of a person’s state of mind with the explained thesis.
FURTHER DEVELOPMENT IN ACQUISITION SYSTEM
All Rights Reserved © 2014 IJDCN
66
correct electrode and successful electronic design strategy are essential to acquire efficient EEG signals with accuracy.
CONCLUSION
The device works well at datasets but it also limits the scope of real time analysis of the signal. The device can be used just as effectively to observe and record EEG with low time computation. Results could be better if there is improved quality of real time signalled datasets. The data is then analysed using Matlab. Signals being thoroughly analyzed, observe that the results obtained match more or less same with the expected outcome. This justifies the use of this software tool for use in professional purposes. Our future plan is to develop a low cost portable EEG system which can be used in reputed companies where employee’s can be provided with their interest in particular ability, studied using the waveforms. Also to analyse different types of EEG signal found in brain.
ACKNOWLEDGMENT
We thank the Department of Electronics and Communication Engineering of Kalasalingam University, (Kalasalingam Academy of Research and Education), Tamil Nadu, India for permitting to use the computational facilities available in Centre for Research in Signal Processing and VLSI Design which was setup with the support of the Department of Science and Technology (DST), New Delhi under FIST Program in 2013.
REFERENCES
[1] Sasikumar Gurumurthy, Vudi Sai Mahit, Rittwika Ghosh, “Analysis and simulation of brain signal data by EEG signal processing technique using MATLAB”, International Journal Of Engineering and Technology (IJET), Vol. 5 No 3, ISSN : 0975-4024, Jun-July, 2013.
[2] Sabbir Ibn Arman, Arif Ahmed, and Anas Syed, “Cost-effective EEG signal acquisition and recording system”, International Journal of Bioscience, Biochemistry and Bioinformatics, Vol. 2, No. 5, September 2012.
[3] Nick Kingsbury, “The dual tree complex wavelet transform: a new technique for shift invariance and directional filters”, University of Cambridge, Cambridge CB2 1PZ, in press.
[4] M.Teplan, “Fundamentals of EEG measurement”, Measurement Science Review, Volume 2, Section 2, 2002.
[5] Mengfei Cao, “Practice on classification using gaussian mixture model course project report for COMP-135”, Fall 2010. (references) [6] Priyanka Khatwani, Archana Tiwari, “A Survey on different noise
removal techniques of EEG signals”, International Journal Of Advanced Research In Computer And Communication Engineering, Vol. 2, Issue 2, ISSN: 2319-5940, February, 2013.
[7] M.Rajya Lakshmi, Dr.T.V.Prasad, Dr.V.Chandra Prakash, “Survey on EEG signal processing methods”, International journal of advanced research in computer science and software engineering, Vol.4, Issue 1, ISSN: 2277 128X, January 2014.