7
All Rights Reserved © 2019 IJDCN
Implementation of Fake Note Detection Using
Digital Image Processing Technique with
Arduino
A.AntonyAshwin, .B.Bavathaarani, R.Deris, Dr.A.Lakshmi Associate Prof.
ABSTRACT : Recently lots of illegal counterfeit rings are manufactured and sold fake coins and simultaneously fake currency notes are also printed, all which have made much loss and damaging the economy of innocent public. This made us imperative in finding a system based on new approach to recognize counterfeit Indian currencies using image processing. The prototype is developed in vector space by comparing the disparity space of currencies. Our model estimates the difference between the test currency note and a model. So as to acquire the divergence between two images the neighborhood key features of each note image are recognized and portrayed. From the attributes of the cash image, the coordinated key focus between the two notes is distinguished in an effective way. A post preparing methodology is additionally proposed to evacuate mismatched key features. Because of the predetermined number of fake money, CNN classifier is trained with real note images for effectively recognizing the fake currencies.
Keywords—Fake currency, fake currency detection, currency image representation, dissimilarity space, class learning.
I. INTRODUCTION
In our economy, currency duplication is a vulnerable activity. Due to enhanced scanning technology, several countries are confronting a severe problem by the exaggerating rate of fake notes. To overcome from this
Problem, various detection techniques are possible nowadays. Most of the detecting techniques are hardware based and it is highly expensive. Automatic recognition of counterfeit currency notes is significant in many applications such as automated goods seller machine and automated goods teller machine. Today in most banks, this system plays a vital role in identifying the fake notes which is in circulation in our country. To detect the counterfeit notes, following steps are performed. Image acquisition, Image preprocessing, image partitioning, feature extraction and finally comparison is performed to provide a good result. To recognize the counterfeit notes in an efficient manner. Automated Teller Machine is used. It is not only facile to perform but also its helps in time consuming. Even though the recognition of counterfeit notes are
detected by using this technique. Reserve Bank of India has reported that 2 trillion fake notes are in circulation. This problem is not fully recovered. So there is a need of enhancing the modern banking services and automatic recognition of counterfeit notes.
1.1 Methods used for the identification of fake notes
i. View via Register: In the center of the vertical band, the diminutive floral design is printed next to watermark. The design which is printed on the front view is hollow and in the back it is filled up. The printed design has back to back registration. The design which is printed will be viewed as one floral design when seen against the light.
ii. Water marking: On the issued bank notes, the mahatma Gandhi watermark is present. Multidirectional lines and shade effect is present on the water mark. It helps in detecting the counterfeit currency notes.
iii. Optically Variable Ink: For security feature, optically variable ink is used. This feature occurs in Rs.200, 500, and Rs. 2000 bank note. In November 2000, bank notes with this security feature are released. With the help of optical variable ink, the denomination value is printed. The color of numerical 2000 or 500 appears green, when note is flat, the color is changed to blue. when it is held in an angle.
iv. Fluorescence: To print the number panels Fluorescent ink is used. The note which is printed also contains optical fiber and it can be viewed when exposed to UV light.
8
All Rights Reserved © 2019 IJDCN
vi. Latent Image: In this image, the respective denomination value is shown in numerical manner. On the scrutinized side of notes, the latent image is present on the right side of Mahatma Gandhi portrait on vertical band. The latent image is visible, when it is held horizontally at eye level.
vii. Micro Lettering: In the midst of the portrait of Mahatma Gandhi and vertical band, micro letters occur. The denomination value of bank note is written in micro letters. By using magnifying lenses, the denomination value can be viewed.
viii. Identification Mark: Each note has its unique identification mark. Different shapes occur for different denomination (Rs.200-H, Rs.500-circle and Rs.2000- Square). This mark exists on the left of water mark.
II. RECENT WORKS
Li Liu et al, introduced a new approach for the identification of counterfeit coins by using their technique. A coin image is expresses in the form of dissimilarity space, which is which is constructed by comparing the image with a trained data. Dissimilarity is measured between the test image and a prototype. To recognized key points they used DOG and SIFT detector. Ying Li Tian, describes an Effective method for the blind. Component-based Banknote Recognition. In this methodology, for the identification of fake notes they used a device which is installed with ultra violet light. By using this device, it needs to be alert at every time to check the denomination The bank employees keeps the currency note on the device and try to check whether the watermark identification, serial number and other feature of the notes are in good condition to get the denomination and check its authentication Author Bo Tang, Steven Kay, Fellow, and Haibo describes a novel shape feature—angle-distance methodology. To speed up the process of classifier, Automated feature selection is significant for text categorization to minimize the feature size. In this paper, it highly concentrates on feature selection technique for minimizing the size of feature. Author study an automatic recognition method for ancient Roman coins. The proposed method exploits the structure of the coin by using a spatially local coding method. Results show that the proposed method outperforms traditional rigid spatial structure models such as the spatial pyramid.
Mohammad H Alshayeji elaborates a technique to Detection Method for Counterfeit Currency Based on Bit-Plane Slicing Technique. A new approach is discovered in this paper using the bit
plane slicing technique to extract the most significant data from counterfeit banknote images with the application of an edge detector algorithm.
Nayana Susan Jose and SherminSiby, introduce an Android Based Currency Recognition System for Blind people .In this methodology is mainly built to support them and make them easier to get used to the currencies. Here, they propose an android based application for recognizing currencies of different countries and also their denominations mainly for visually impaired people. Mirza and Nanda, describe an automated paper currency recognition system which can be a very good utility in banking systems and other field of commerce. In this methodology, recognition of paper currency with the help of digital image processing techniques is described. The characteristics extraction is performed on the image of the currency and it is compared with the characteristics of the genuine currency. The sobel operator with gradient magnitude is used for characteristic extraction.
III. PROPOSED APPROACH
9
All Rights Reserved © 2019 IJDCN
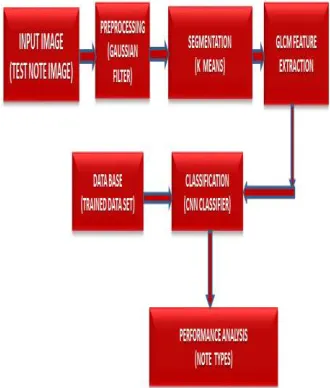
Fig 1. Proposed system block diagram
This is known as nearest centroid classifier. CNN Algorithm: It is machine learning, support vector machines (CNNs, also support vector networks) are supervised learning models with associated learning algorithms that analyze data used for classification and regression analysis. Given a set of training examples, each marked as belonging to one or the other of two categories, an CNN training algorithm builds a model that assigns new examples to one category or the other, making it a non-probabilistic binary linear classifier (although methods such as Platt scaling exist to use CNN in a probabilistic classification setting).
Fig 1 shows the fake currency detection system block diagram. In this system user need to take an input image which he or she want to check as an original or fake. After taking it as input image the given image is preprocessed it as RGB to gray and removing all unwanted outlier of that image and apply sobel algorithm for the extraction of features of that image and extracting each and every feature one by one and compared it with dataset using CNN algorithm.
A. Preprocessing by median filter
In preprocessing, CNN takes a geospatial information of the germinated fake image. The main step is to be performed in preprocessing is resizing the image. Prior to grouping, transform the RGB image into gray scale image and after this step modify it into the L demonstrate and finally it straightens the image into single dimensional for performing further.
Pseudo Code
Pre process Image (A, X)
X= required size A= image
Source: Original JPG image
Output: Pre-processed HSV image Steps involved in preprocessing: Step 1: for each Image X Step 2: do
Step 3: Transform X to hsv format Step 4: Add dark border of size 1x1 pixel Step 5: Fuzz A to 10%
Step 6: Trim A Step 7: Re page A
Step 8: Assume gravity centre for the image A Step 9: Re-size X
Step 10: Dark background A Step 11: Close loop
Step 12: Return A
Median Filter
A median filter is said to be median smoother is a non linear order statistics filter that utilizes sliding window where the value of the centre pixel alone is changed in every iteration. The filtered image R = R(x, y) obtained from median filter is expressed by
𝑅 (𝑥, 𝑦) = 𝑚𝑒𝑑𝑖𝑎𝑛(𝑘,𝑙)∈𝑊ℎ,𝑤{𝐷 (𝑥 + 𝑧, 𝑦 + 𝑙)}
(1)
Where, w is the sliding window.
The median filter can reduce the noise interference at the cost of change in the smooth pixel value. The median filter can arranges the samples in ascending or descending order but takes long time for computation when number of sample is large. This drawback is minimized by using indirect arrangement procedure where the local histogram is used for calculating median value. The time needed to generate local histogram is minimized by sliding window approach.
An image sensor color camera with high resolution of pixels and long photographic lens is utilized to acquire images without distortion. A chamber is made with a black table as background for taking images. The first step of the image processing is the transformation of the color images picked up by a camera into HSV format. Then by using median filter the dark pixels are eliminated according to equation (2)
𝐹𝑔𝐻𝑆𝑉(𝑥, 𝑦) =
{𝐼𝑚𝐻𝑆𝑉(𝑥, 𝑦); 𝑤ℎ𝑒𝑟𝑒 𝐼𝑚𝑉(𝑥, 𝑦) > 𝜃𝑓
10
All Rights Reserved © 2019 IJDCN
Where 𝐼𝑚𝐻𝑆𝑉 is the source image in HSV color space, 𝐼𝑚𝑉 is a V channel of 𝐼𝑚𝐻𝑆𝑉, 𝜃𝑓is the minimum brightness of the image and 𝐹𝑔𝐻𝑆𝑉is the segmented image in HSV format.
B. Segmentation using K-means clustering algorithm
This algorithm is used to partition a set of data into groups based on specific distance measurement. The images are the important source for communicating informations. The extraction of informations plays a vital role in machine learning. Basically the clusters are not hierarchical and do not overlaps each other. All the members of a cluster are closer to its group only and do not centered on other clusters. K-means clustering is an unsupervised learning approach that is ease to implement hence finds application in data mining, feature recognition and analysis and segmentation of images.
The k-means clustering algorithm detects a set R of K clusters Rj with cluster mean rj to reduce the sum
of square of the error. It is described as
𝐸 = ∑𝑘𝑗=1∑𝑋𝑖𝜖𝐶𝑗∥ 𝐶𝑗− 𝑋𝑖∥2 (3)
where W is the sum of the square of the error of cluster mean. The above equation is the distance measure between data point Xi and cluster mean cj.
The Euclidean distance is expressed as
∥ 𝑥 − 𝑦 ∥ = √∑𝑉𝑖=1|𝑥𝑖− 𝑦𝑖|2 (4)
The cluster means Ciis the vector defined as
𝐶𝑗= 1
𝐶𝑗∑𝑖∈𝐶𝑗𝑋𝑖 (5)
Algorithm steps
1: arbitrarily choose k as center of cluster 2: Assume initial value for cluster means
3: repeat above two steps till long changes disappears in cluster
4: for i= 1 to n do
5: let each data point xi to cluster Cj
6: end
7: for j= 1 to k do 8: re-evaluate cluster mean cj
9: end 10: return C
In order to segment the root and coleoptiles the segmentation method is used to images that contain root and seed. The hue and saturation are used to extract root and coleoptiles images by locating the white color pixels. The segmentation of root and coleoptiles are given in below equation.
𝑅𝑜𝑜𝑡 (𝑥, 𝑦) = {1 ; 𝑤ℎ𝑒𝑟𝑒 𝜃𝑟1 < 𝐹𝑔𝑠(𝑥, 𝑦) > 𝜃𝑟2
0 ; 𝑜𝑡ℎ𝑒𝑟𝑠 (6)
Where 𝐹𝑔𝑆 is a saturation channel of fake image, 𝜃𝑟1and 𝜃𝑟2are threshold value and 𝑅𝑜𝑜𝑡is the binary
image contained only root part.
C. GLCM based Feature Extraction
Basically Feature Extraction is used to reduce the amount of pixels needed to describe a huge set of data. It is a general form for developing combination of variables with sufficient memory requirement, low power and satisfying accuracy. The extraction of textual features plays an important role in pattern recognition and image processing. GLCM extracts second order textual features which are used in various applications. GLCM is a matrix whose number of columns and rows is equal to number of grey level in the images. Thus GLCM find the relation between reference pixel and neighboring pixel and presents the distance and spatial relation in the sub region of an image.
The features such as energy, inertia moment, entropy and correlation are considered for implementation.
Energy
The image homogeneity is measured by the sum of square of second order moment. When pixels are same or when images are homogeneous, the energy or second order moment is also high.
𝐸𝑛𝑒𝑟𝑔𝑦 = ∑ ∑ 𝑃𝑖 𝑗2
𝑁𝑔−1 𝑗=0 𝑁𝑔−1 𝑖=0
(7)
where Ng is grey tone
Inertia moment
It represents the local homogeneity and will be high for uniform grey level and high inverse GLCM. Its weight value is the inverse of the weight of contrast.
𝐼𝑀 = ∑ ∑ 𝑃𝑖 𝑗
𝑁𝑔−1 𝑗=0 𝑁𝑔−1 𝑖=0
1+ (𝑖−𝑗)2 (8)
Entropy
11
All Rights Reserved © 2019 IJDCN
𝐸𝑛𝑡𝑟𝑜𝑝𝑦 = ∑ ∑ 𝑃𝑖 𝑗
𝑁𝑔−1
𝑗=0 ∗ log (𝑃𝑖 𝑗)
𝑁𝑔−1 𝑖=0 (9)
Correlation
The linear dependencies of the grey level of neighbor pixels are measured by correlation.
𝐶𝑜𝑟𝑟𝑒𝑙𝑎𝑡𝑖𝑜𝑛 = ∑ ∑ (𝑖 𝑗)𝑃𝑖 𝑗−𝜇𝑥
𝑁𝑔−1
𝑗=0 𝜇𝑦
𝑁𝑔−1 𝑖=0
𝜎𝑥𝜎𝑦 (10)
D.CNN Classification
Basically image classifications are of two types supervised and unsupervised. In supervised learning, there is a need of trained data and it predicts the output data from the previous experience. But in unsupervised learning, it helps to identify all kinds of unknown patterns in data. By using unsupervised technique, complex processing task can be achieved. But the output is unpredictable. So supervised learning algorithm is chosen. Convolutional Neural Network comes under supervised learning algorithm. It is a multilayer perception which uses less preprocessing step and it is simple to train the data. CNN is used because it takes an input image and give importance to each and every object of an image and it is capable to differentiate from one another.
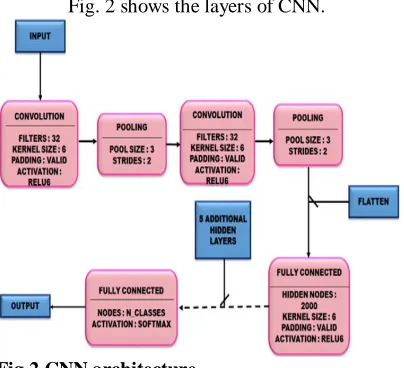
Fig. 2 shows the layers of CNN.
Fig 2 CNN architecture
Training phase
In the training process, the input image is taken and it is preprocessed to get a clear and quality image. The inputs are repeatedly pass through all the layers (convolutional, pooling and fully connected) to detect the features in the image. The best feature is obtained in each layer to perform classification by using feature map. The training phase will be more
effective, when the number of layers increases. About 9 convolutional layers, 8 pooling layers and 2 fully linked layers are integrated in the present paper. This integration helps to make the technique to work in an efficient manner and to get a high accurate result. By using these layers, the images are easily classified.
1. Convolutional layers
The main block of CNN is convolutional layer. This layer consists of filters and it has small reception fields. In each forward pass, it will produce a 2 dimensional map of relevant filter by computing the dot product between input and filter entries. By using the dimensional depth of each filter will produce the complete output volume of convolutional layer.
𝑋𝑗𝑙= 𝑓 (∑𝑖∈𝑀𝑗𝑋𝑖𝑙−1∗ 𝐾𝑖𝑗𝑙 + 𝑏𝑗𝑙) (11)
2. Pooling layers
It is another building block of Convolutional Neural Network. Pooling means nonlinear sub sampling of images. Its main function is to minimize the spatial size and it is used to reduce the computation. It uses max pooling operation. In max pooling, the input is partitioned into sum of non overlapping squares. In between the convolution layer, pooling operation is performed. It operates independently on each and every slice of the input. By using max pooling operation, spatial representation of dimension is reduced without any changes in the volume of the dimension.
3. Fully connected layers
Neurons which are present in the fully connected layer have full connection with preceding layer (convolutional or pooling or connected). Their activation can be computed by performing a matrix multiplication followed by bias offset. This layer transforms the 2D features into 1D feature. The mathematical expression is computed as follows,
𝑌𝑖𝑙= 𝑓(𝑧 𝑖𝑙)
(12)
with 𝑧𝑖𝑙= ∑ 𝑤𝑖,𝑗𝑙 𝑚𝑖𝑙−1
𝑗=1 𝑦𝑖𝑙−1 (13)
12
All Rights Reserved © 2019 IJDCN
pre-processing steps. Fig. 4 shows the workflow of the present work.
Fig 3. Workflow
As we have chosen CNN algorithm, little preprocessing is needed. Here, in preprocessing resizing and rotation is performed. Rotation is done in 45°C, 90°C, and 180°C. To get an efficient trained data, these rotations are performed to get more images to the trained dataset After this step, the data is given to the convolution algorithm for processing.
Consider, N*N image and it is passed to the convolutional layer. In convolution layer, filter is used in which we are using m*m, which is ω. Then the output of the convolution layer is of size (N-m+1)*(N-m+1). To acquire the non-linearity input, we have to sum up the output from the preceding layer which is indicated by xl
x y.
𝑿𝒙 𝒚𝒍 = ∑𝒎−𝟏𝒂=𝟎 ∑𝒎−𝟏𝒃=𝟎 𝝎𝒂𝒃𝒚(𝒙+𝒂)(𝒚+𝒃)𝒍−𝟏 (14)
Computing nonlinearity of the convolution layer is done by,
𝑦𝑖𝑗𝑖 = 𝜎(𝑿𝒊𝒋𝒍) (15)
To identify the error and to propagate back, chain rule is used
Testing phase
During the process of testing, this phase will identify the feature and classifiers based to it. The algorithm will initially identify whether the fake note is germinated or not. If the fake note is germinated, then it will check the evaluation level, the output for this will be the seed’s germination level. Now, from this outcome, action can be taken based on the evaluation levels.
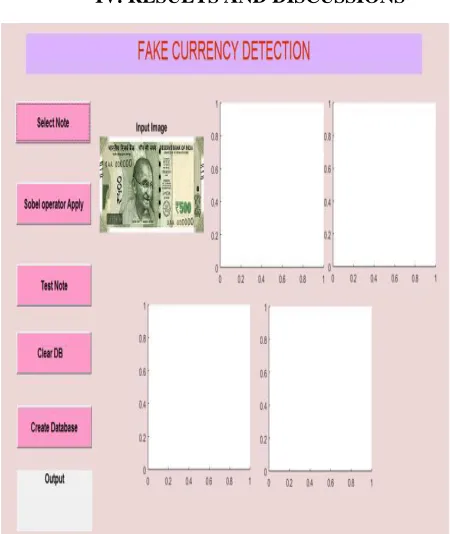
IV. RESULTS AND DISCUSSIONS
Fig 4. Taking Input Image and Preprocessed Image
13
All Rights Reserved © 2019 IJDCN
Fig 2 shows the detection of notes in which the clustered feature of the given image is compared with the dataset of the image and classified it as an original image.
Fig 6. Input as a Fake Note Image
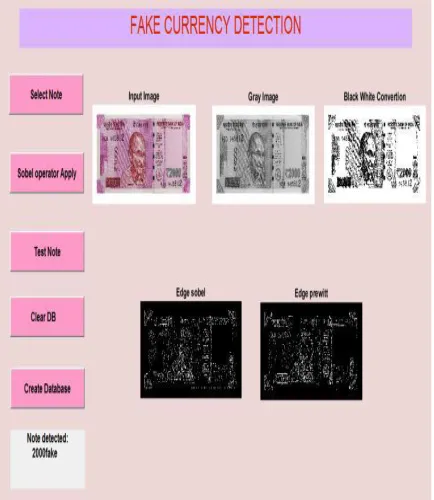
Fig 3 shows the extraction of the fake image from the dataset and performing preprocessing on fake note image. And Fig 4 shows the sobel operator apply on the fake note image. Sobel edge algorithm is applied for the extraction of the inner as well as outer edges of the image and classified it as a fake note.
Fig 7. Detection of fake notes
14
All Rights Reserved © 2019 IJDCN
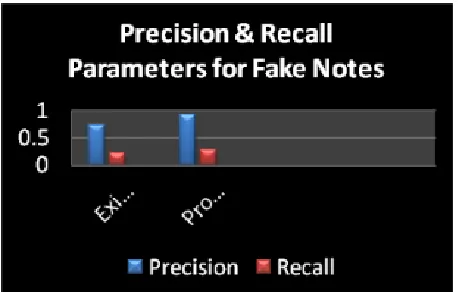
Fig 8. Graph of Precision and Recall for fake notes
Fig 9 shows the precision and recall for original notes of the existing system and proposed system. It shows comparative analysis of existing system as well as proposed system. By the analysis of the proposed system and existing system on the basis of accuracy we find that the proposed system gives better result than existing system. From the graph it is clear that value of Precision and Recall for proposed system is greater than existing one. Thus the accuracy of proposed system is more.
Fig 9. Graph of Precision and Recall for original notes
V. CONCLUSION AND FUTURE SCOPE
Compared to conventional methods, analysis of currency images becomes efficient and economic with the help of advanced image processing tools. MATLAB simulation tool is utilized in this paper. Number of research work is expanding day by day in this field and different processing strategies are executed so as to get precise outcomes. From the simulation result it is visible that the proposed
framework is adequate in recognizing highlights of Indian cash images. These extricated features are utilized to recognize and verify money values. Application based framework is intended in future to get appropriate recognition outcome. A similar framework can be developed for the other Indian money value notes and other nation's cash notes. Additionally the application's interface can also be additionally changed according to the client necessities.
VI. REFERENCES
[1] MonaliPatil, JayantAdhikari, Rajesh Babu, 2018, “Fake Currency Detection using Image Processing”, International Journal on Future Revolution in Computer Science & Communication Engineering, vol. 4, no. 4, pp. 865– 868.
[2] D.Alekhya ,G.DeviSuryaPrabha ,
G.VenkataDurgaRao, 2014, “Fake Currency Detection Using Image Processing and Other Standard Methods”, International Journal of Research in Computer and Communication Technology, vol. 3, no. 1, pp. 128 -131.
[3] MayadeviA.Gaikwad, Vaijinath V. Bhosle, 2017, “Automatic Indian New Fake Currency Detection Technique”, International Journal of Engineering Research & Technology (IJERT), vol. 6, no.11, pp. 1-7.
[4] PM.Deborah. P, PC.SoniyaPrathap, 2014, “Detection of Fake currency using Image Processing”, IJISET - International Journal of Innovative Science, Engineering & Technology, vol. 1, no.10, pp. 151- 157.
[5] Gouri Sanjay Tele, Akshay Prakash Kathalkar, 2016, “Detection of Fake Indian Currency”, International Journal of Advance Research, Ideas and Innovations in Technology, vol. 4, no. 2, pp. 171-176.
[6] Navya Krishna G, SaiPooja G, Naga Sri Ram B, YaminiRadha V, Rajarajeswari P, 2019, “Recognition of Fake Currency Note using Convolutional Neural Networks”, International Journal of Innovative Technology and Exploring Engineering (IJITEE), vol. 8, no. 5, pp. 12-17.
[7] AchalKamble, MrudulaNimbarte, 2018, “Fake Indian Currency Detection: A Review”, International Journal of Pure and Applied Mathematics, vol. 118, no. 24, pp. 1-12.
15
All Rights Reserved © 2019 IJDCN
Revolution in Computer Science & Communication Engineering, vol. 4, no. 4, pp. 400 – 405.
[9] Saiyed Mohammed Arshad,
DevdattSawantSudagar&Nausheeda B S, 2017, “Fake Indian Currency Detection Using image processing”, International Journal of Latest Trends in Engineering and Technology, pp. 598- 602.
[10] HlaingHtakeKhaung Ti, 2019, “Effective Method of Fake Currency Detection System using Image Processing”, International Journals of Advanced Research in Computer Science and Software Engineering, vol. 9, no. 5, pp. 44- 48.
[11] Vinti Nanda, 2017, “Characteristic Extraction Parameters for Genuine Paper Currency Verification Based on Image Processing”, International Journal of Computing", vol. 2, no. 2, pp. 245- 251.
[12] Mohammad H Alshayeji, Mohammad Al-Rousan and Dunya T. Hansson, 2015, “Detection Method for Counterfeit Currency Based on Bit-Plane Slicing Technique” ,International Journal of
Multimedia and Ubiquitous Engineering, vol.10, no.11, pp. 14- 23.
[13] Nayana Susan Jose, SherminSiby, Juby Mathew, Mrudula Das, 2015, “Android Based Currency Recognition System for Blind”, International Journal of Engineering Research in Computer Science and Engineering, vol. 2, no. 4, pp. 154- 163.
[14] RenukaNagpure, Shreya Shetty, TruptiGhotkar, ChirayuYadav and SurajKanojiya, 2016, “Currency Recognition and Fake Note Detection”, International Journal of Innovative Research in Computer and Communication Engineering, vol. 4, no. 3, pp. 34- 42.
[15] Vidhi Roy, Gangey Mishra, Rahul Mannadiar and SushantPatil, 2019, “Fake Currency Detection Using Image Processing”, Vidhi Roy et al, International Journal of Computer Science and Mobile Computing, International Journal of Computer Science and Mobile Computing, vol. 8, no. 4,pp.88–93.
AUTHORS
1. A.Antony Aswin – Final year, Department of Electronics and Communication Engineering , Kalasalingam Academy of Research and Education, [email protected]
2. B.Bavathaarani – Final year, Department of Electronics and Communication Engineering, Kalasalingam Academy of Research and Educatio,[email protected]
3. R.Deris - Final year, Department of Electronics and Communication Engineering, Kalasalingam Academy of Research and Education, [email protected]