Issues
ISSN: 2146-4138
available at http: www.econjournals.com
International Journal of Economics and Financial Issues, 2016, 6(S5) 97-103.
Cognitive and Simulation Modeling of Regional Economic
System Development
Larisa A. Ginis
1*, Galina V. Gorelova
2, Anna E. Kolodenkova
31Department of Information Technology and Measuring Systems, Southern Federal University, Russia, 2Department of State and
Municipal Governance, Southern Federal University, Russia, 3Department of Mechanical Engineering Technologies, Ufa State
Aviation Technical University, Russia. *Email: [email protected]
ABSTRACT
Sustainable development of regional economy is the declared as a strategic objective of the state. From these positions, studying of the regional socio-economic phenomena and processes, development of the corresponding research and managerial tools are actual tasks. Authors consider the regional economy as a complex hierarchical system. This requires identification of its state, structure, particularities in its development and governance. These factors are investigated using the means of simulation modeling. Authors suggest to use the developed cognitive and simulation modeling methodology, which is based on cognitive approach, the theory of hierarchical multilevel structures, fixed and fuzzy directed graphs. The study illustrates possibilities of cognitive-simulation modeling and foresight of the socio-economic system development at the regional level.
Keywords: Simulation Modeling, Regional Development, Sustainable Development JEL Classifications: C63, R58
1. INTRODUCTION
Research results of the majority of recent studies on economic systems in Russia are directed towards the development of adequate formalized quantitative models. The models that would enable to develop reasonable administrative solutions based on scientific foresight of development of these systems, in particular at the regional level – regional economy.
Any social and economic system (SES) at the regional level is the self-organized object, which is developing under the influence of many changing factors, both internal and external in nature. Such system can unambiguously be classified as a complex system, which represents the complex of various subsystems in hierarchical representation uniting a large number of interconnected and interacting objects of various nature. By its nature, the structure of SES is dynamic, and reflects changes of system in time and space.
Studying of development of such systems is one of the important modern tasks ever since its allocation. At the same time, one of
important characteristics of complex systems is its sensitivity to different revolting influences of environment. This feature remains roughly studied up to date and therefore the most actual for research. It is particularly important while approaching the understanding of how to construct a model of a system for scientific anticipation of a possibility of its sustainable development. Similar issues are often brought up in contemporary research (Bozhenyuk and Ginis, 2013; 2014). The particular emphasis is placed on development of trajectories of a sustainable development at adoption of administrative decisions that is reflected in the studies of Slesarev and Yanovskiy (2014), Tretyakova (2013), Yu and Wu (2014). Publications of Miller and Scott (2007) and Khokher et al. (2013) well represent the use of modern theoretical achievements on this matter.
2. THEORETICAL ANALYSES
sustainably developing system is a complex dynamic property class of a manageable systems that combine the following requirements: (1) The falling trajectory of development for some time in the target set of states, (2) not releasing on the forecast range time from a certain number of “safe” states, and (3) almost monotone increase of some development indicators (e.g., quality of life, etc.) at a certain time interval and then secure them to the specified range of values, (4) the asymptotic stability (“stabilizability”) of the programmed trajectory, and (5) harmonized interests of the parties.
The first four requirements of this definition can adapt the number of numerical stability criteria developed in the theory of control technology systems as to study the SES. The fifth requirement is unformalizable, but it is desirable to be filled at the organizational level.
The idea of Mesarovich et al. (1970) for the stratified description of a system is the basis for modeling of the studied system.
As backbone base of cognitive methodology the metamodel research adopted from Kulba et al. (2002), which further elaborated in the work of Gorelova (2013):
M = {MO, ME, MOE, MD, MИO, MИE, MU, MH, A} (1) Where: MO = MO (X, Y, U, P) - identifying the system model (object
model), in which the vector X - exogenous values, the vector
Y - endogenous variables, y∈Y⊆Em, characterizing the phase state of the object, U - vector controlled variables, u∈U⊆Er,P - vector of resources allocated, p∈P⊆Eo; ME - a model of the environment;
MY -interaction model of the object and environment MY = (MOX, MOY), in which the MOX -model communication with the media at the inlet, MOY - a model of communication with the media outlet);
MD - model of the system behavior; MИO and MИE - model for measuring the state of the system and the environment; MU - model management system (not included in the meta, if only to solve the problem the study site); A - rule selection process changes the object; Mн - a model of “observer” (engineer, kognitiolog, experts, researchers).
M defines a meta-system, objects that must not be ignored in
a particular process of development and use of model M (in the study of ecological and SES, forecasting, decision-making, management etc.).
Introduction to a metaset M of “observer,” “expert” allows to form methodology of research and decision-making by taking into account the development of process of knowledge of an object of consciousness of the researcher.
The МO, МЕ, MOE models are in total cognitive model of an object.
MD(Q) – behavior model of a system in the form of pulse processes; models of interactions between tops (concepts) of cognitive models can be presented by systems of the equations, and also in language of probability theory and fuzzy sets. MMO and МME are sets of rules, procedures, measuring means. Development of such models is included into process of cognitive structurization of knowledge of the expert. The model of the observer is shown in the course
of knowledge of object and the decisions made by him; finally, model of its perception, knowledge and understanding of an object is the cognitive model of complex system.
Development of a meta model (1) fixes the purposes, research problems and decision-making, allowing to see a general picture without losing a detail. Depending on the purpose, the concrete models making a meta model are under construction.
We shall note that in the course of research and consecutive decision-making by the expert objects of a meta model can change. So, the initial model of system in the form of a cognitive map (2) can be transformed consistently in more difficult mathematically (and according to contents) cognitive model like the parametrical vector
of the functional graph (3) described in work of Kulba et al. (2002).
G=<V,E> (2)
Φ={G,X,F,Θ} (3)
where: G=<V,E> - cognitive map - the sign directed graph in
whom V – a set of tops (concepts), tops of Vi∈V, i = 1, 2,…, k
are elements of the studied system; Е – a set of arches, arches of
еij∈E, i,j = 1, 2,…, n reflect interrelation between tops of Vi and Vj; influence of Vi on Vj in the studied situation can be positive (“+”) when increase (reduction) in one factor leads to increase (reduction) in another, negative (“−”) when increase (reduction) in one factor leads to reduction (increase) of another, or to be absent (0) in the considered situation.
The parametrical vector of a functional count Φ is a train in
which G – a cognitive map; X – a set of parameters of tops,
v X, =
{
X( ) ( )Vi XVi ∈X i, =1 2, ,...,k}
,X v x g i i( )=
{ }
,g = 1,2,...n i;X:V→;0 - space of parameters of tops; F = F(X,E) - functionality
of transformation of arches as Cartesian product of F: E×X× →R; F(X,E) = f(xi,xj,eij); F – transformation can have a fij function
appearance, and also weight coefficient of wij determined by the expert or by statistical data. Determination of parameters of the
characteristic of fij includes: Definition of a scale, indicators, method, accuracy, unit of measure.
Cognitive models besides accurate counts (2), (3) can be presented in language of fuzzy graphs. Also in cognitive modeling of complex systems, we develop hierarchical cognitive models and systems of the interacting hierarchical cognitive models.
So, we will understand as an fuzzy cognitive map (FCM) the fuzzy
directed graph, which is set by pair of sets G= (X, U) with
X = {xi}, iI={1, 2,…, n} – is accepted as a fixed set of concepts as which the factors are most essential to the considered problem, and
{ , / , }
= < < > < >>
u i k i k
U m x x x x mis a fuzzy set of edges (or
arcs), where <xi,xk>X2, and m
u<xi,xk> is a degree of membership
oriented edge <xi,xk> to fuzzy set of directed edges U , i.e., from
xj concept to a concept of xk the arch is carried out if change of xj
by Bozhenyuk and Ginis (2014). Rules of work with fuzzy graphs are stated in the monograph Bershtein and Bozhenyuk (2005).
Any object of political, economic, social, ecological system or their set can act as concepts (tops, objects, judgments) of fixed and FCM. For example, socio-economic indexes, political decisions and their effects, investments into health care and demography, the purposes and necessary means of their achievement, etc. The revealed correlation between tops and their importance will be the fuzzy arches.
Cognitive studies conducted by the authors include the solution of the complex system problems. The main ones are: (1) Identification of a system in the form of the cognitive (i.e., informative) model developed by the researcher; (2) analysis of the ways and cycles of the cognitive model; (3) the topological analysis of the structure of the model (i.e., analysis of q-connectivity; e.g., Atkin, 1997; Barcelo et al., 1998); (4) the analysis of structural resistance to indignations on initial values described by Roberts (1986); (5) modeling and the analysis of the fuzzy managing direction of influence described in work of Vovk and Ginis (2012); (6) the scenario analysis by the analysis of results of pulse modeling, a formula (4) and described by Roberts (1986); (7) scientific foresight of development, statement of a question is made in Gorelova and Pankratova (2015); (8) decision-making, and others.
Xn+1 = xn+ARn+Qn (4)
where: Rn=An−1Q
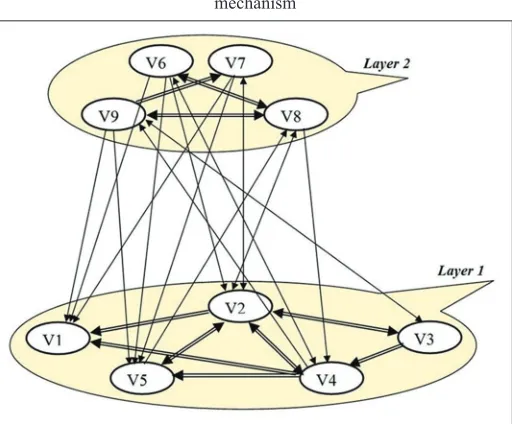
0+An−2Q1+…+AQn−2+IQn−1, I - identity matrix. We will present the generalized two-level cognitive map of the regional socio-economic mechanism (Figure 1) organized by the principles of the theory of hierarchical multilevel systems described by Mesarovich et al. (1970) and Gorelova and Ginis (2002). The scheme of the regional economic mechanism described by the academician Granberg is the basis for creation of this map.
In the map, the processes which can be carried out in any region are joint: Reproduction of a gross regional product, natural resources, energy resources, etc.
Each layer is a process and result of a certain specific activity, if necessary can be presented in the form of rather independent substructural models (both statics and dynamics). Concepts (tops) of Vi of this cognitive map can be interpreted as blocks of regional infrastructure, set of blocks is a layer of hierarchical regional SES. Then the first layer unites the concepts of: V1 – consumption final; V2 – manufacturing; V3 – employment; V4 – population incomes; V5 – gross accumulation. The second layer unites concepts of: V6 – the federal regulating structures (the bank, fiscal organizations, etc.); V7 – interregional and foreign exchange; V8 – environment; V9 – population.
Arrows reflect the direction of influence between the allocated blocks (production, income, population, etc.). For example, production development − V2 involves increase in final consumption − V1 and is interconnected with an employment
rate − V3, and finely, the income of the population − V4 depends; the level of income of the population − V4, in turn, influences gross accumulation – V5 and outputs – V2, etc.
3. DEVELOPMENT OF THE METHOD OF
THE SIMPLICIAL ANALYSIS OF FCM
At present, structural analysis is one of the most important investigation stages of regional economic systems, as there is a problem of the analysis of structure as whole. Analysis of the structures designed to identify significant, functionally meaningful connections system, to determine the conditions of structural stability of the system. For these purposes, it is useful to apply the apparatus of algebraic topology, group theory, system theory and binary relations, which allows to analyze the structure of a complex multi-dimensional geometry of education – a simplicial complex elaborated by Atkin (1997), Barcelo et al. (1998), Casti (1979).
The idea of the method of the simplicial analysis has found development in the works of Atkin (1997). In this work, the method of such analysis is adapted to the FCM and consists of processing fuzzy basic data. For realization of this method, three-stage approach is offered.
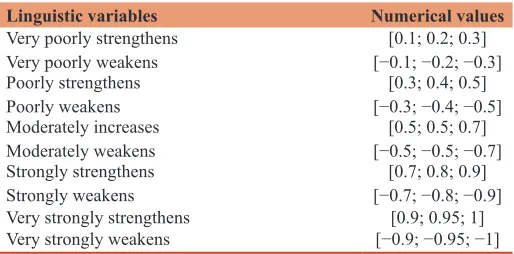
Stage 1: Identify the factors Сi, i = 1,…, h needed for creating the FCM, as well as the relationships between them. It is supposed that the weight of extent of influence wij (i = 1,…, h; j = 1,…, h) between each of factors couple, can be represented in one of the types: 1. Linguistic variables;
2. Fuzzy numbers from the interval wij ∈ [−1;1]; 3. Interval numbers wij = [wijmin, wijmax];
4. Triangular fuzzy numbers wij = [wijmin, wijcp, wijmax]; 5. Trapezoidal fuzzy numbers wij = [wij1, wij2, wij3, wij4].
We shall note that performing the simplicial analyses the parameter values of the vertices are not necessary. Note that while the work
Figure 1: Two-level cognitive map of the regional socio-economic
is not conducted with the FCM as with mathematical apparatus we operate with the terminology of factors. As soon as we started working with the FCM, we operate terminology – vertex. Stage 2: Processing of basic data is carried out. Stage 3: The simplicial analysis is carried out.
For implementation of the simplicial analysis of FCM the algorithm consisting of 14 steps is offered.
Step 1: The basic data are entered (number of vertices and value of relationships between vertices).
Step 2: If values relationships are represented in the form of linguistic variables, then transition to a Step 3; if the condition is not fulfilled, i.e., the values relationships are represented in the form of interval numbers, then transition to Step 4.
Step 3: Is the structuring of values relationships (each linguistic value assigned to a number in the range from minus – to plus units) is carried out (Table 1).
Step 4: If the value relationships are represented in the form of intervals, then transition to Step 5; if the condition is not fulfilled, i.e., the values relationships are represented in the form fuzzy numbers from interval wij∈[−1;1], then transition to Step 6.
Step 5: The rationing of interval values relationships is carried out. For rationing are offered the following formulas:
1. For interval numbers wij = [wijmin, wijmax], = maxmin, maxmax,
ij ij nor
ij w w
w
w w
max
max 1max{≤ ≤ , } = ij
i h
w w , nor∈[0;1]
ij
w ;
2. For triangular fuzzy numbers wij = [wijmin, wijcp, wijmax],
min cp max
max , max , max ,
=
ij ij ij nor
ij
w w w
w
w w w
max
max 1max{≤ ≤ };
= ij i h
w w
3. For trapezoidal fuzzy numbers wij = [wij1, wij2, wij3, wij4],
1 2 3 4
max, max, max, max ,
=
ij ij ij ij nor
ij
w w w w
w
w w w w
max
4 1max{≤ ≤ }; = i h ij
w w
where nor
ij
w – normalized of interval values relationships between
vi and vj; wmax – maximum interval value w
ij.
As a result of normalization, the interval values relationships represent a normalized interval values relationships wijnor,
[0;1]
∈ nor ij
w .
To receive one fuzzy value from an interval for further work with FCM, the following steps are recommended:
1. For a normalized intervals nor =[ normin, normax]
ij ij ij
w w w to choose
min max
*
2
+ = ijnor ijnor nor
ij
w w
w
2. For a normalized triangular fuzzy intervals
wijnor w w w
ijnor ijnor ijnor
=[ min, cp, max] to choose *
cp = nor nor ij ij
w w ;
3. For a normalized trapezoidal fuzzy intervals
wijnor w w w w
ijnor ijnor ijnor ijnor
=[ 1 , 2 , 3 , 4 ] to choose
wij*nor = wijnor1 +wijnor2 +wijnor3 +wijnor4 4
Step 6: The creation of FCM and matrix of relationships is carried out.
Step 7: The replacement of the fuzzy values on “−1”, “0” and “+1” is carried out.
For the application of the simplicial analysis of FCM, the received interval values of relationships are recommended to be transformed as follows: If fuzzy numbers are in the interval [–1; 0], we assigned the “minus one, if in the interval [0; 0.5] is “zero”, if in the interval [0.5; 1] – “the unit.”
Step 8: The creation of the matrix of connections with the replacement of fuzzy values is carried out.
Step 9: The calculation of units in each ith line, and also calculation
of dimension of simplices of the complex is carried out Kx(Y; l). Step 10: The calculation of units in each jth column, and also
calculation of dimension of simplices of the complex is carried out Ky(X; l*).
Step 11: The transformation of matrixes is carried out (L в (1)L,(1)L в(2)L).
Step 12: The creation of simplicial complexes is carried out
Kx( ; ) {Y λ = δq( )i},K
x( ; ) {Y λ = δq( )j}.
Step 13: The first structural vector is determined by a matrix (2)L complexes Kx(Y; l).
Step 14: The first structural vector is determined by a matrix (2)L complexes Ky(X; l*).
4. EXAMPLES OF COGNITIVE MODELING
Most fully the examples illustrating the possibilities of cognitive and simulation modeling and research of the socio-economic mechanism at the regional level are brought up and described
in the monograph of Gorelova and Pankratova (2015). We shall consider one of them in more detail.
Table 1: Evaluation of relationships, represented as triangular fuzzy numbers between vertices
Linguistic variables Numerical values
Very poorly strengthens
Very poorly weakens [−0.1; −0.2; −0.3][0.1; 0.2; 0.3]
Poorly strengthens
Poorly weakens [−0.3; −0.4; −0.5][0.3; 0.4; 0.5]
Moderately increases
Moderately weakens [−0.5; −0.5; −0.7][0.5; 0.5; 0.7]
Strongly strengthens
Strongly weakens [−0.7; −0.8; −0.9][0.7; 0.8; 0.9]
Very strongly strengthens
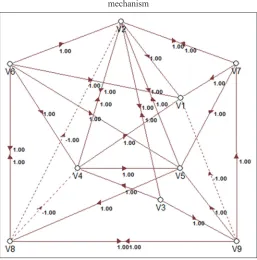
Figure 2 shows a cognitive map of the regional socio-conomic mechanism according to model (2) detailing communications of the two-level cognitive map of the regional socio-economic mechanism represented in Figure 1.
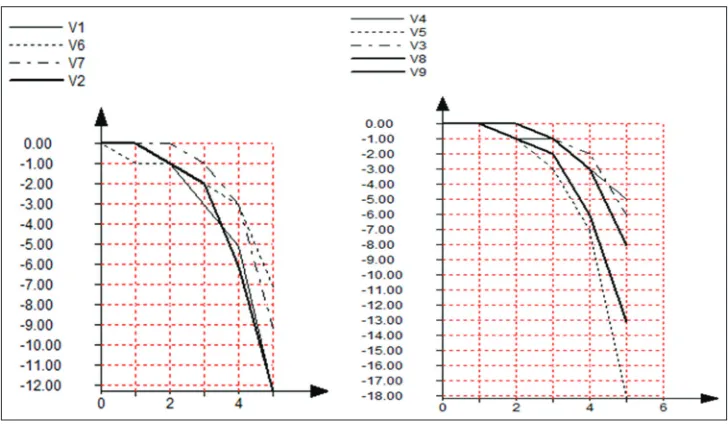
By way of illustration we shall give results of pulse modeling (Figures 3 and 4) on a cognitive map (Figure 2), corresponding with two elementary scenarios when entering indignations into tops of V2 (manufacturing) and V6 (the federal regulating structures).
Schedules reflect changes of signals in tops of a cognitive map. On abscissa axis modeling steps, on ordinate axis – changes of impulses in tops are postponed. Schedules represent pulse processes in total in all nine tops of a cognitive map (splitting into separate groups of schedules is caused by a condition of presentation of the image and convenience of their analysis) and are the simplest option of pulse modeling when indignation is brought in the only top. In full research options of scenarios when entering indignations into several tops can be considered at the same time or consistently. The number of such options is very big; therefore, for their reduction it is required to carry out planning of computing experiment with experts in subject domain. Besides, in respect of computing experiment it is desirable to consider offers of the expert strategies developed by other methods of scientific anticipation for the purpose of their multilateral assessment.
Research of Gorelova and Pankratova (2015), Gorelova et al. (2015), Zakharova et al. (2015) has been conducted using cognitive methodology while analyzing such problems of regional SES as environmental protection, SME development, education.
5. CONCLUSION
In the given example, we do not interpret the given results from positions of the projected strategy of regional development. For this purpose, it is necessary to provide detailed information to the first stage of modeling, initial expert alternatives of scenarios, and all set of results of imitating cognitive modeling of the concrete region. The purpose of the article was describe the opportunities of cognitive modeling of complex systems in composition with methods of scientific foresight, system dynamics and other methods and to briefly present tools of simulation cognitive modeling of complex systems.
Figure 2: Cognitive map of the regional social and economic
mechanism
Figure 3: Schedules of pulse process according to the scenario No. 1: “What will be if the region has the industry,” the revolting influence q2 = +1
The cognitive and simulation methodology of modeling of regional SES developed by authors and partially described in this article enable to provide tools for research of such systems for the purpose of definition of their state, structure, possible ways of development, and governance in the desirable direction on the basis of imitating experiment.
The offered modified method of the topological analysis of structure of FCM differs in rationing of parameters of the communications between tops presented in the form of linguistic variables, both fixed and fuzzy (interval, triangular, trapezoid) numbers. This method allows to construct steady structure of the SES model for the purpose of adoption of administrative decisions on its sustainable and safe development.
Distinctive feature of the presented work is the fact that the methodology of cognitive modeling can be the basis for intellectual systems that support decision-making processes.
6. ACKNOWLEDGMENTS
The study was financially supported by the Russian Foundation for Basic Research: Project No. 15-07-00185a “Methods and algorithms for spatial and temporal control processes in intelligent geoinformation systems based on fuzzy temporal graphs” and project No. 15-08-06129 “Development of methods of analysis and risk management when designing built-in software of the distributed information and control systems for complex technical objects.”
REFERENCES
Atkin, R.H. (1997), Combinatorial Connectives in Social Systems. An Application of Simplicial Complex Structures to the Study of Large Organisations. Interdisciplinary Systems Research. Springer Basel AG. Barcelo, H., Kramer, X., Laubenbacher, R., Weaver, C. (1998), Foundations
of Connectivity. Theory for Simplicial Complexes. Department of
Mathematical Sciences. Available from: https://www.math.la.asu. edu/~helene/papers/atheory_final.pdf. [Last retrieved on 2016 Feb 19]. Bershtein, L., Bozhenyuk, A. (2005), Fuzzy Graphs and Fuzzy
Hypergraphs. Moscow: Scientific World Press. p256.
Bozhenyuk, A.V., Ginis, L.A. (2013), The use of fuzzy graph models for the analysis of complex systems. Control Systems and Information Technologies, 51(1), 122-126.
Bozhenyuk, A.V., Ginis, L.A. (2014), Modeling and analysis of complex systems on the basis of fuzzy graph models. Life Science Journal, 1(11), 187-191.
Casti, J.L. (1979), Connectivity, Complexity, and Catastrophe in Large-scale Systems. New York: J. Wiley Press.
Ginis, L.A. (2015), The use of fuzzy cognitive maps for the analysis of structure of social and economic system for the purpose of its sustainable development. Mediterranean Journal of Social Sciences, 6(3), 113-118.
Gorelova, G.V. (2013), Cognitive approach to simulation modeling complex systems. Engineering Sciences, 3, 239-250.
Gorelova, G.V., Ginis, L.A. (2002), The Construction Hierarchical Multilayered Cognitive Cards of Light-structured Systems. IEEE International Conference of Artificial Intelligence System (ICAIS 2002). Proceedings. Los Alamitos, California. p131-132.
Gorelova, G.V., Pankratova, N.D. (2015), Innovative development of socio-economic systems based on foresight and cognitive modeling methodologies. Kiev: Naukova Dumka Press.
Gorelova, G.V., Thibeault, I.V., Prichina, O.S. (2015), Cognitive Russian modeling in the system of corporate governmance. Mediterranean Journal of Social Sciences, 6(2), 442-452.
Khokher, M.R., Ghafoor, A., Siddiqui, A.M. (2013), Image segmentation using multilevel graph cuts and graph development using fuzzy rule-based system. In IET Image Processing, 7(3), 201-211.
Koptjug, V.A., Matrosov, V.M., Levashov, V.K. (2000), New paradigm of development of Russia (complex researches of problems of a sustainable development). 2nd ed. Moscow: Academia Press.
Kulba, V.V., Kononov, D.A., Kosyachenko, S.A., Kovalevskij, S.S., Nizhegorodcev, R.M., Chernov, I.V. (2002), Scenario analysis of dynamics of behavior of social and economic systems. Moscow: IPU Press, Scientific Publication.
Mesarovich, М.D., Macko, D., Takahara, Y. (1970), Theory of Hierarchical, Multilevel Systems. New York and London: Academic Press.
Figure 4: Schedules of pulse process according to the scenario No. 2: “What will be if the federal regulating system does not work effectively?,”
Miller, J.H., Scott, E. (2007), Complex Adaptive Systems: An Introduction to Computational Models of Social Life. Princeton, NJ: Princeton University Press.
Roberts, F.S. (1986), Discrete Mathematical Models with Application to Social, Biological and Environmental Problems. New Jersey, Englewoo Cliffs: Prentice-Hall, Inc.
Slesarev, D., Yanovskiy, V. (2014), Sustainable development of the regional social-economic system: An innovative dimension. Public Policy and Administration, 13(1), 9-21.
Tretyakova, E.A. (2013), Evolution of research and evaluation methodology of sustainable development of social and economic
systems. World Applied Sciences Journal, 25(5), 756-759. Vovk, S.P., Ginis, L.А. (2012), Modelling and forecasting of transitions
between levels of hierarchies in difficult formalized systems. European Researcher, 20(5-1), 541-545.
Yu, Y.J., Wu, L. (2014), Sustainable development of the Dongting lake flood detention basin’s economic and social based on the system dynamics. Advanced Materials Research, 962, 2249-2252. Zakharova, E.N., Kerashev, A.A., Prokhorova, V.V., Gorelova, G.V.,