Detection of fouling on RO modules by residence time
distribution analyses
David Hasson*, Alexander Drak, Chagai Komlos, Qingfeng Yang,
Raphael Semiat
Rabin Desalination Laboratory, Grand Water Research Institute, Department of Chemical Engineering, Technion-Israel Institute of Technology, Haifa 32000, Israel
Tel.þ972 4 8292936; Faxþ972 4 8295672; email: [email protected]
Received 17 February 2006; accepted 19 March 2006
Abstract
A simple and reliable technique for on line detection and diagnosis of scaling and fouling deposits could improve significantly operational control of RO plants. This paper presents results of an ongoing research project aiming to develop a novel method for online detection of membrane fouling by a residence time distribution (RTD) technique. The method is based on determination of flow dispersion intensities from online RTD signals that can be simply measured. The systems investigated in this paper are spiral wound membranes fouled with either Mg(OH)2 or CaCO3. Analyses of RTD data of fouled membranes show that an increasing membrane permeability loss is accompanied by a systematic increase in the dispersion coefficient, thus providing an indicator for detecting a fouling event. It is also found that the magnitude of the dispersion coefficient is affected by deposit morphology, thus indicating the possibility for diagnosing the nature of the fouling deposit. Another fouling indicator may be derived from the observation that the extent of the dead volume monitored by the RTD signal increases with the fouling level while dead volumes are absent in clean modules.
Keywords: Spiral wound module, Fouling, Scaling, Residence time distribution, Dispersion coefficient
1. Introduction
Reverse Osmosis (RO) desalination is uni-versally recognized as the most cost effective
technology for desalting both brackish and sea-water. Design of RO plants is mostly based on the spiral wound configuration. An
*Corresponding author.
Presented at EuroMed 2006 conference on Desalination Strategies in South Mediterranean Countries: Cooperation between Mediterranean Countries of Europe and the Southern Rim of the Mediterranean. Sponsored by the European Desalination Society and the University of Montpellier II, Montpellier, France, 21-25 May 2006
0011-9164/07/$– See front matterÓ2006 Elsevier B.V. All rights reserved.
overriding operational consideration is to ensure that there is no loss in the water production capacity and in the water quality. Malfunctioning of feed pretreatment preven-tive measures can lead to the development of highly deleterious processes of scaling and fouling. Scaling and fouling deposits have a negative impact on the permeation process and on membrane integrity. They usually evolve slowly and their inception is not easily detected. A simple and reliable technique for on line detection and diagnosis of scaling and fouling deposits could improve significantly operational control of RO plants.
This paper presents results of an ongoing research project aiming to develop a novel method for online detection of membrane fouling by a residence time distribution (RTD) technique. The RTD technique is a powerful tool for characterizing flow patterns and diagnosing malfunctioning in complex flow systems. The basic principle of the tech-nique is to inject at the module entrance a tracer material, such as a dye or a conductive solution in the form of a ‘‘pulse’’ or a ‘‘step change’’ and to monitor the time response of the signal in the exit channel of the module. The shape of the ‘‘response signal’’ can be used to determine important flow parameters such as the average residence time of the fluid in the equipment, the presence of dead volumes and/or bypass streams, as well the intensity of mixing effects along radial and axial directions [1].
The usefulness of the RTD technique, for improving understanding of the flow within spiral wound modules is gaining increasing recognition [2–7]. Van Gauwbergen and Baeyens [2–4] related measured RTD response curves to the flow in the spiral wound module. The experimentally deter-mined mean residence times in the concen-trate channel were found to be smaller than the corresponding theoretical residence times,
indicating the presence of dead volumes. The difference between experimental and theoret-ical mean residence time gradually decreased with increasing solution flow rate. The expla-nation for this phenomenon lay in the obser-vation that at low flow velocities, there was preferential flow at the sides of the module and air bubbles were attached to the spacer.
Roth et al. [5–7] carried out tracer response experiments in new and used mem-branes. Significant differences were observed between response signals of new and used membranes. The permeate channel response curve measured with new membranes was unimodal while those measured with worn and fouled membranes were multimodal. The shape of response curves was modified by changing the nature of the injected solute. The interpretation of these observations was that the permeate response curves in worn membranes were affected by solute leakage.
Residence time distributions experiments carried out in the early stages of this investi-gation [8] clearly indicated that the flow in a spiral wound module deviates significantly from ideal plug flow and that this deviation could be quantified by characterizing the axial mixing intensity through a dispersion coefficient. The phenomenon used to detect the presence of a deposit on the membrane is the additional flow disturbance it induces, which is reflected in an increase in the disper-sion coefficient.
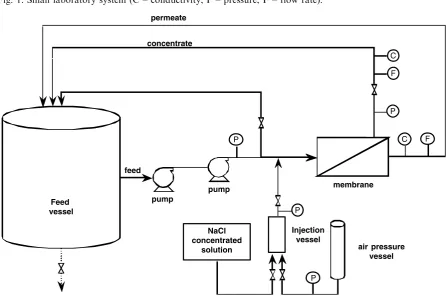
2. Experimental
2.1. Experimental systems
Injection vessel
P
Feed vessel
F C C
P F
concentrate permeate
feed
membrane pump
permeate concentrate heat
exchanger
P
NaCl concentrated
solution
P
[image:3.544.49.492.85.307.2]air pressure vessel
Fig. 1. Small laboratory system (C – conductivity, P – pressure, F – flow rate).
Injection vessel
P
Feed vessel
F C C
P F
concentrate permeate
feed
membrane
pump
P
NaCl concentrated
solution
P
air pressure vessel pump
[image:3.544.48.495.330.627.2]2.5’’ FilmTEC TW30–2514 spiral module having the following dimensions: length – 14’’, diameter – 2.5’’, 2 sheets, membrane area – 0.687 m2. The industrial RO system enabled feed flows in the range of 1 to 10 m3/hr at permeation pressures of 10 to 40 bar. The fouling tests were carried out with a FILMTEC BW30–400 spiral wound module having the following dimensions: length – 40’’, diameter – 8’’, 30 sheets, membrane area – 37 m2.
2.2. RTD measurement technique
Each RO system was provided with a pres-sure vessel containing a concentrated NaCl solution held at a high pressure by com-pressed air. An RTD experiment is carried out while a pressurized feed solution is flow-ing through the spiral wound module. A NaCl pulse is injected into the inlet channel of the membrane by rapid opening and clos-ing of the ball valve of the injection pipe. The NaCl concentrations of the pulse solutions were 10 g/L in the laboratory size system and 200 g/L in the industrial size system. The response of the NaCl tracer solution in the concentrate channel was monitored by a sensitive conductivity meter (Model 759II-131–4A-45, MYRON L Co., USA) which has a response time of the order of millise-conds. The conductivity data were logged in a PC equipped with the TestPoint program.
2.3. Membrane fouling procedure
The effect of fouling on the RTD was studied in three series of experiments:
Series A – 2.5’’ laboratory membrane fouled by a Mg(OH)2 deposit
Series B – 8’’ industrial membrane fouled by a Mg(OH)2 deposit
Series C – 8’’ industrial membrane fouled by a CaCO3deposit
Controlled membrane fouling was achieved by circulating through the system a suspension of the scaling species for several hours. The Mg(OH)2 suspension was prepared by mixing
solutions of MgCl2 and NaOH. The CaCO3
suspension was prepared by mixing solutions of CaCl2 and NaHCO3. The fouling intensity
was characterized by the permeate flow rate decrease induced by the foulant.
The sequence of RTD measurements was as follows:
RTD test performed on a clean membrane
Membrane fouled by recycling the suspension
RTD test performed on fouled membrane
Membrane cleaned
RTD test performed on membrane fouled at a different intensity.
3. Analyses of experimental RTD curves
The conductivity data measured in the response signal emanating from the centrate stream are readily converted to con-centration C versus time t. The experimental mean residence time t is defined by [1]:
t¼
R1
0 tCdt
R
1
0 Cdt
ð1Þ
The dimensionless time is defined by:
¼t
t ð2Þ
and the dimensionless variance2 is given by:
2 ¼
2
t
t2¼
R1
0
ðttÞ2Cdt
R
1
0 Cdt
The main reason for the spread of the response signal is a mixing effect superposed on the main flow. The intensity of this mixing can be characterized by the magnitude of a dispersion coefficient D (analogous to the diffusion coefficient characterizing molecular mixing). The dimensionless dispersion number D/uL is given by [1]:
D uL¼
1þ
ffiffiffiffiffiffiffiffiffiffiffiffiffiffiffiffi
1þ82 q
8 ð4Þ
where uis the flow velocity, and L, the mod-ule flow length.
The dispersion number can serve to char-acterize the mixing effects in the flow passages of the spiral wound module. For an ideal flow system approaching plug flow,D/uL!0. For a highly mixed flow system, D/uL!1.
According to the simplest model, the intensity of axial mixing can also be theoreti-cally modeled by the axial dispersion (AD) expression [1]:
E;OO¼
V
MC¼
1
ffiffiffiffiffiffiffiffiffiffiffiffiffiffiffiffiffiffiffiffiffi
4ðD=uLÞ
p
exp ð1Þ
2
4ðD=uLÞ
" #
ð5Þ
whereE,OOis the dimensionless age
distribu-tion, V – the module flow volume, and M – the tracer mass.
In the axial dispersion model (dispersed plug flow model), the fluctuations of velocity profile are due to different flow velocities and to molecular and turbulent diffusions. The model implies that there exist no stagnant pockets and no gross bypassing or short-circuiting of fluid in the vessel [1]. However, for spiral wound RO module, it is difficult to eliminate stagnant regions and there is an
evidence of the presence of dead volumes in the concentrate channel [2–4,9].
A much better fit of the data measured in this study was provided by the Exponentially Modified Gaussian Model (EMG). The EMG function has been widely used to model chro-matographic peaks [10]. It is a convolution of a Gaussian and an exponential function. The form of this equation is [11]:
CðtÞ ¼ A
2t0
exp w
2
2t2 0
txc
t0
erf tffiffiffixc
2
p
w
w ffiffiffi
2
p
t0
þ1
ð6Þ
whereAis the area,xcis the retention time of
the Gaussian component, w is the standard deviation of the Gaussian component, t0 is
the standard deviation of the exponential component. The mean residence time is given by t¼xcþt0 and the variance by
2t ¼w2þt2
0. Analysis of data according to
the EMG model was carried out using the Origin software.
4. RTD diagnosis of fouled membranes 4.1. Mg(OH)2tests in the laboratory system
The membrane was fouled with Mg(OH)2
suspensions having concentrations in the range of 0.3–1.3 g/L at temperatures in the range of 28–33C. The suspensions were fed
to the membrane at a flow rate of 975 L/h and a permeation pressure of 15 bar. Both concentrate and permeate were recycled to the feed vessel. The duration of the fouling operation was about 8–9 h.
The RTD tests were carried out at an operating pressure of 20 bar on membranes fouled at different intensities characterized by the membrane permeability level. In each case
0 1 2 3
0.0 0.5 1.0 1.5 2.0
t error 2%
Experimental, t=5.2 s
EMG model, t=5.3 s
Re=210 P=10bar
Eθ
[image:6.544.52.258.77.254.2]θ Run 24710
Fig. 3. Modeling RTD curve by EMG model in the laboratory system.
0 1 2 3 4
0.0 0.2 0.4 0.6 0.8 1.0 1.2 1.4 1.6 1.8
Experimental, t=5.2 s
AD model, t=4.2 s
t error 19%
Re=210 P=10bar
Eθ
θ Run 24710
Fig. 4. Modeling RTD curve by AD model in the laboratory system.
0.0 0.4 0.8 1.2 1.6 2.0
0.0 0.5 1.0 1.5 2.0 2.5 3.0
t error 0.65%
Experimental, t=15.4 s
EMG model, t =15.3 s
Eθ
θ
[image:6.544.292.494.79.246.2]Re=105 P= 20bar Run 1-13-034
Fig. 5. Modeling RTD curve by EMG model in the industrial system.
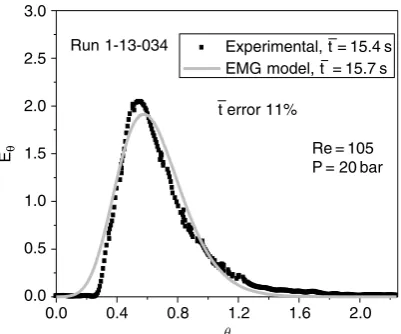
0.0 0.4 0.8 1.2 1.6 2.0
0.0 0.5 1.0 1.5 2.0 2.5 3.0
t error 11%
Experimental, t =15.4 s
EMG model, t =15.7 s
Eθ
θ
Re=105 P= 20bar Run 1-13-034
[image:6.544.48.258.427.611.2] [image:6.544.293.494.442.609.2]RTD measurements were performed at differ-ent flow rates, covering a Reynolds number range of 40–240. The permeability of the clean FilmtecTW30–2514 membrane was 3.2 L/m2h bar.
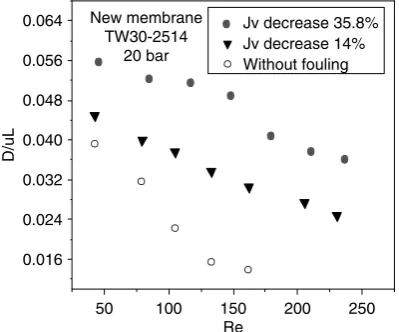
Fig. 7 shows the effect of Reynolds num-ber on the dispersion coefficient on a clean membrane and on fouled membranes. It is seen that the presence of a fouling deposit increases systematically the dispersion coeffi-cient. The dispersion coefficients for the clean membrane (D=6–10 cm2/sec at Re =
45–170) increased to D=8–27 cm2/sec at
Re =45–240 in the presence a fouling layer causing a 14% permeate flow reduction and to D= 12–47 cm2/sec at Re=45–240 in the presence a fouling layer causing 36% perme-ate flow reduction. The plot of the data in dimensionless coordinates (Fig. 8) shows that the dispersion numberD/uLtends to decrease with the increase in Reynolds number.
The important conclusion derived from the above results is that a fouling deposit exerts a considerable effect on the flow dis-persion, indicating a possibility for
convenient in-line detection of membrane fouling by RTD measurements.
4.2. Mg(OH)2 tests in the industrial system
The effect of a fouling deposit on flow dispersion was more extensively investigated in the industrial size module. The 8’’ BW30– 400 membrane which had an initial perme-ability of 1.06 L/m2/h/bar was fouled by recy-cling Mg(OH)2suspensions for about 2 h at a
feed pressure of 19 bar, a feed flow rate of 7700 L/h and at a feed temperature in the range of 26–30 C.
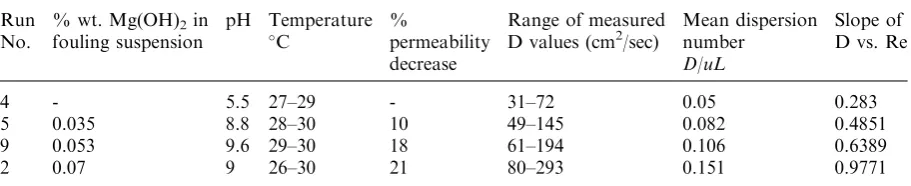
[image:7.544.293.493.79.245.2]Table 1 describes suspension concentra-tions used for forming different fouling inten-sities and the resulting fouling level, characterized by the decrease in the mem-brane permeability coefficient. The highest fouling level was achieved with a 0.07% wt. suspension which decreased the permeability by 21%. The RTD tests were performed at an operating pressure of 19 bar over a Reynolds number range of 80–300.
Fig. 9 shows the effect of Reynolds num-ber on the dispersion coefficient on a clean membrane and on fouled membranes. The
50 100 150 200 250
5 10 15 20 25 30 35 40 45 50
Jv decrease 35.8% Jv decrease 14% Without fouling
New membrane TW30-2514
20 bar
D
[cm
2/s]
Re
Fig. 7. Effect of Mg(OH)2 fouling intensity on the dispersion coefficient in the laboratory system.
50 100 150 200 250
0.016 0.024 0.032 0.040 0.048 0.056
0.064 New membrane
TW30-2514 20 bar
Re
D/uL
Jv decrease 35.8% Jv decrease 14% Without fouling
[image:7.544.50.258.434.613.2]increase in dispersion coefficient with Rey-nolds number is substantially linear. The slope of the dispersion D (cm2/sec) vs. Re increases systematically with the membrane fouling intensity, from 0.28 for a clean membrane to 0.98 for a membrane fouled by a deposit leading to a 21% loss in permeabil-ity (Table 1). The plot of the data in dimen-sionless coordinates (Fig. 10) shows that the dispersion number D/uLis almost constant at each fouling level, with a slight trend for a decrease of D/uL with Re. The results obtained confirm the main finding of the tests carried out with the laboratory
membrane, that the dispersion coefficient is significantly affected by a fouling deposit. The main differences in the results of the two systems are that, as may be anticipated, dispersion levels are much higher in industrial membranes.
[image:8.544.45.501.110.203.2]Apart from increasing the dispersion intensity, a fouling deposit appears to induce another effect. The data measured with clean membranes (Section 3) invariably showed that the theoretical mean residence time (ratio of membrane volume to solution flow Table 1
Fouling conditions and dispersion results of Mg(OH)2tests in the industrial system
Run No.
% wt. Mg(OH)2in fouling suspension
pH Temperature
C
%
permeability decrease
Range of measured D values (cm2/sec)
Mean dispersion number
D/uL
Slope of D vs. Re
4 - 5.5 27–29 - 31–72 0.05 0.283
5 0.035 8.8 28–30 10 49–145 0.082 0.4851
9 0.053 9.6 29–30 18 61–194 0.106 0.6389
2 0.07 9 26–30 21 80–293 0.151 0.9771
0 50 100 150 200 250 300
50 100 150 200 250 300 350
without fouling
0.035%w Mg(OH)2 solution, 10% permeate decrease 0.053%w Mg(OH)2 solution, 18% permeate decrease 0.07%w Mg(OH)2 solution, 21% permeate decrease
D
[cm
2/s]
Re
Fig. 9. Effect of Mg(OH)2 fouling intensity on the dispersion coefficient in the industrial system.
0 0.04 0.08 0.12 0.16 0.2
50 100 150 200 250 300 350
without fouling
0.035%w Mg(OH)2 solution, 10% permeate decrease 0.053%w Mg(OH)2 solution, 18% permeate decrease 0.07%w Mg(OH)2 solution, 21% permeate decrease
D/uL
[image:8.544.47.259.226.614.2]Re
[image:8.544.288.496.400.611.2]rate) coincided with the experimental mean residence time evaluated from the RTD curve. Fig. 11 shows that, in the case of fouled membranes, the residence time evalu-ated from the RTD curve was significantly lower than the theoretical time, indicating the presence of dead volumes. The dead volume appears to increase with Reynolds number. This interesting phenomenon might also serve to detect membrane fouling and is currently investigated.
4.3. CaCO3 tests in the industrial system
Deposit morphology can be expected to be one of the parameters influencing the degree of flow dispersion induced in a fouled mem-brane. Some preliminary RTD tests were car-ried out with the industrial membrane fouled by a CaCO3 deposit in order to explore the
possibility of identifying the nature of the deposit from its dispersion characteristics. As deposit morphology is known to be mod-ified by the presence of anti-scalants, it was
also of interest to explore deposits formed in the presence of an anti-scalant.
Fouling of the membrane in Runs 11 and 13 was carried out by recycling highly turbid CaCO3 suspensions, formed without the
pre-sence of an anti-scalant. Runs 12 and 14 were carried out with feed solutions having identi-cal make-ups as in Runs 11 and 13 respec-tively, but with the addition of 15 PPM of the anti-scalant Calgon (SHMP). The presence of the anti-scalant fully suppressed bulk precipi-tation. In all cases, the fouling procedure was carried out for about 2 h under similar con-ditions as in the Mg(OH)2 experiments (flow
rate of 7700 L/h, pressure of 19 bar and tem-perature in the range of 26–30 C).
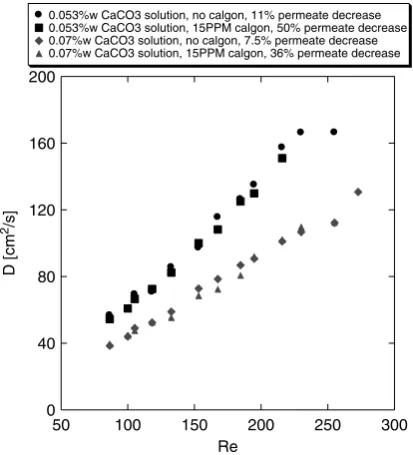
Experimental conditions and results are summarized in Table 2. A striking observa-tion is the marked difference in fouling inten-sities between the feed solutions prepared without and with the anti-scalant. The turbid suspensions of the anti-scalant free solutions which foul the membrane by a particulate deposition mechanism, led to a relatively low permeability decrease, amounting to 11% in Run 11 and to 7.5% in Run 13. The feed solutions having the same carbonate make-up but in which bulk precipitation was suppressed by the anti-scalant, formed a deposit on the membrane by a wall crystal-lization mechanism. The wall crystalcrystal-lization process was induced by concentration polar-ization which acts to increase the supersatura-tion potential, thus overcoming the scale prevention capability of the anti-scalant. The fouling deposit formed in this case led to a much higher permeability decrease, amount-ing to 50% in Run 12 and to 36% in Run 14. Fig. 12 shows the effect of Re on the dis-persion coefficient in the CaCO3 fouling
experiments while Fig. 13 depicts the disper-sion data in dimendisper-sionless form. As in the case of the Mg(OH)2 fouled membrane, the
increase of D with Re is substantially linear.
–5% 0% 5% 10% 15% 20% 25%
50 100 150 200 250 300 350
without fouling
0.07%w Mg(OH)2 solution, 21% permeate decrease
Dead Volume
[image:9.544.49.257.69.274.2]Re
Table 2
Dispersion results of industrial membranes RTD data fouled by CaCO3deposits
Run No.
Feed solution conditions
pH Temperature
C
% permeability decrease
Range of measured D values (cm2/sec)
Mean dispersion number
D/uL
Slope of D vs. Re
11 no anti-scalant; 0.053% wt. CaCO3 in highly turbid suspension
7.6 27 to 29 11 57–166 0.1 0.776
12 solution of make-up of Run 11;
15 ppm anti-scalant; No turbidity
8.4 27 to 29 50 54–151 0.1 0.753
13 no anti-scalant; 0.07% wt. CaCO3in highly turbid suspension
7.6 26 to 28 7.5 39–131 0.07 0.474
14 solution of make-up of Run 13;
15 ppm anti-scalant; No turbidity
7.9 26 to 29 36 39–112 0.07 0.458
0 40 80 120 160 200
50 100 150 200 250 300
0.053%w CaCO3 solution, no calgon, 11% permeate decrease 0.053%w CaCO3 solution, 15PPM calgon, 50% permeate decrease 0.07%w CaCO3 solution, no calgon, 7.5% permeate decrease 0.07%w CaCO3 solution, 15PPM calgon, 36% permeate decrease
D [cm
2/s]
[image:10.544.286.497.375.613.2]Re
Fig. 12. Effect of CaCO3 fouling intensity on the dispersion coefficient.
0 0.02 0.04 0.06 0.08 0.1 0.12
50 100 150 200 250 300
0.053%w CaCO3 solution, no calgon, 11% permeate decrease 0.053%w CaCO3 solution, 15PPM calgon, 50% permeate decrease 0.07%w CaCO3 solution, no calgon, 7.5% permeate decrease 0.07%w CaCO3 solution, 15PPM calgon, 36% permeate decrease
D/uL
Re
[image:10.544.51.258.385.613.2]However, the dispersion number D/uL shows a slight trend for increasing as Re is increased, contrary to the trend in the Mg(OH)2 fouling runs. In the case of fouling
deposits formed without the presence of an anti-scalant (Runs 11 and 13), the dispersion intensities at Re =80–250 in a membrane of 11% decrease in permeability (D= 57– 166 cm2/sec) are, as expected, higher than those in a membrane of the lower permeabil-ity decrease of 7.5% (D =39–131 cm2/sec).
An intriguing result was obtained in the two experiments (Runs 12 and 14) carried out with a membrane fouled in the presence of an anti-scalant by a wall crystallization mechanism. Despite the marked differences in permeability decrease, deposits formed with and without the presence of an anti-scalant led to almost identical dispersion intensities. Dispersions in the range of D= 54–151 cm2/sec were obtained in Run 12 with the membrane fouled to a high permeability loss of 50% by the anti-scalant stabilized solution. Virtually identical disper-sions values of D =57–166 cm2/sec were obtained in Run 11 with a membrane fouled to the much lower permeability loss of 11% by the anti-scalant free suspension. Similarly, dispersions in the range of D =39–112 cm2/ sec were obtained in Run 14 with the mem-brane fouled to a high permeability loss of 36% by the anti-scalant stabilized solution. Again, virtually identical dispersions of
D=39–131 cm2/sec were measured in Run 13 with a membrane fouled to the much lower permeability of 7.5% by the anti-sca-lant free suspension.
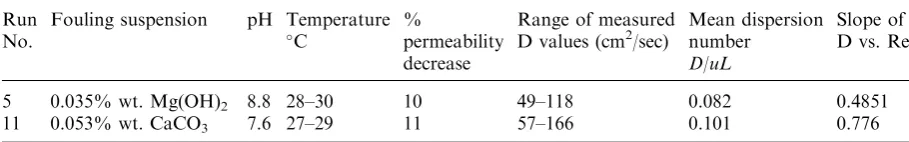
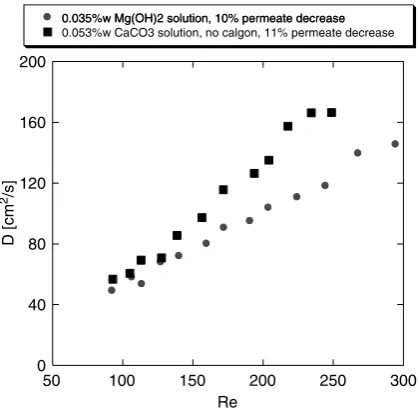
The data so far obtained provide some indication that deposit morphology can have a noticeable effect on the dispersion. This property might serve to characterize the nat-ure of the fouling deposit. Table 3 and Figs. 14 and 15 compare results obtained with membranes comparably fouled, by the same permeability decrease (10–11%), with two morphologically different scaling species. It is seen that the dispersion levels for the CaCO3 deposit are systematically higher
than those for the Mg(OH)2 deposit. It also
appears that the dimensionless dispersion number for CaCO3 tends to increase with
Re while that for Mg(OH)2 shows an
oppo-site trend.
5. Conclusions
The residence time distribution (RTD) tech-nique, which is widely used for characterizing chemical reactors, was applied in the study of fouled spiral wound modules. Dispersion coefficients were measured for membranes fouled at different intensities with Mg(OH)2
and CaCO3deposits. The flow dispersion level
[image:11.544.44.499.572.643.2]of a clean membrane was found to be markedly affected by the presence of a fouling deposit. For instance a Mg(OH)2 deposit causing a
Table 3
Comparison between dispersion results obtained with membranes fouled to a similar extent by Mg(OH)2 and CaCO3
Run No.
Fouling suspension pH Temperature
C
%
permeability decrease
Range of measured D values (cm2/sec)
Mean dispersion number
D/uL
Slope of D vs. Re
5 0.035% wt. Mg(OH)2 8.8 28–30 10 49–118 0.082 0.4851
permeability decrease of 10%, augments the dispersion coefficient by 50 to 100% in an
industrial membrane operated at Reynolds numbers in the range of 80 to 300.
The growth in the dispersion level was found to increase systematically with the degree of fouling. Moreover, the limited data so far avail-able for comparavail-able Mg(OH)2 and CaCO3
fouling deposits, show a distinct difference in the dispersion coefficients of two morphologi-cal varieties. These results indicate a clear potential for developing online RTD monitor-ing techniques, enablmonitor-ing early detection of a fouling event and possibly, also diagnosing the nature of the fouling deposit.
Symbols
A — Area, m2
C — Tracer concentration, g/L
C(t) — Tracer concentration, g/L
D — Dispersion coefficient, cm2/sec
E,OO — Dimensionless age distribution
function
L — Module flow length, m
t — Time, sec
t — Mean residence time, sec
t0 — Standard deviation of exponential
component, sec
u — Flow velocity, m/sec
w — Standard deviation of Gaussian component, sec
xc — Retention time of Gaussian
com-ponent, sec
Greek
— Dimensionless time 2
t — Variance, sec
2
2 — Dimensionless variance
Acknowledgments
This ongoing research is carried out within the framework of a Multi-Institutional Infra-structure Project sponsored by the Israel Ministry of Science, aiming to optimize
0 40 80 120 160 200
50 100 150 200 250 300
0.035%w Mg(OH)2 solution, 10% permeate decrease 0.035%w Mg(OH)2 solution, 10% permeate decrease 0.053%w CaCO3 solution, no calgon, 11% permeate decrease
D
[cm
2/s]
[image:12.544.50.260.77.282.2]Re
Fig. 14. Comparison between dispersion coefficients of a Mg(OH)2 fouled membrane and a CaCO3 fouled membrane.
0 0.02 0.04 0.06 0.08 0.1 0.12
50 100 150 200 250 300
0.035%w Mg(OH)2 solution, 10% permeate decrease 0.053%w CaCO3 solution, no calgon, 11% permeate decrease
D/uL
[image:12.544.49.262.391.601.2]Re
membrane processes for water treatment and desalination. It also forms part of the Ph.D thesis of A.D. and of the M.Sc. thesis of C.K. undertaken at the Technion in partial fulfill-ment of the requirefulfill-ments for a high degree. Thanks are due to Technion’s Grand Water Research Institute for providing seed funds and to the Israel Ministry of Science for sup-porting the project.
References
[1] O. Levenspiel, Chemical Reaction Engineering, 3rd ed., John Wiley, New York, 1999
[2] D. Van Gauwbergen and J. Baeyens, Macroscopic fluid flow conditions in spiral wound membrane elements. Desalination, 110 (1997) 287–299. [3] D. Van Gauwbergen and J. Baeyens, Assessment
of the design parameters for seawater treatment by reverse osmosis. Water Sci. Technol., 40 (1999) 269–276.
[4] D. Van Gauwbergen and J. Baeyens, Macro-scopic fluid flow conditions in spiral wound membrane elements: packed bed approach. Water Sci. Technol., 41 (2000) 85–91.
[5] E. Roth, B. Fabre, A. Accary and G. Thomas, Modeling of stimulus response experiments in the
feed channel of spiral-wound reverse osmosis membranes. Desalination, 127 (2000) 69–77. [6] E. Roth, M. Kessler, B. Fabre and A. Accary,
Sodium chloride stimulus-response experiments in spiral wound reverse osmosis membranes: a new method to detect fouling. Desalination, 121 (1999) 183–193.
[7] E. Roth, B. Fabre and A. Accary, Identification of diffusion modes of solutes in spiral wound reverse osmosis membranes by interpreting tra-cing experiments by a plug flow model. Desali-nation, 129 (2000) 23–33.
[8] A. Drak, Q. Yang, D. Hasson and R. Semiat, Detection of spiral wound module defects by RTD analyses, Proc. IDA World Congress on Desalination and Water Reuse, Singapore, 11–16 Sept. 2005, Paper SP05–033, p. 20.
[9] A. G. Pervov, Scale formation prognosis and cleaning procedure schedules in reverse osmosis systems operation. Desalination, 83 (1991) 77–118. [10] D. Hanggi and P. W. Carr, Errors in exponen-tially modified Gaussian equations in the litera-ture. Anal. Chem., 57 (1985) 2394–2395. [11] S. B. Howerton, C. Lee and V. L. McGuffin,