www.ann-geophys.net/27/1331/2009/
© Author(s) 2009. This work is distributed under the Creative Commons Attribution 3.0 License.
Annales
Geophysicae
Occurrence of polar mesosphere summer echoes at very
high latitudes
M. Zecha1and J. R¨ottger2
1Leibniz-Institut f¨ur Atmosph¨arenphysik, K¨uhlungsborn, Germany
2EISCAT-CAWSES-Copernicus and Max-Planck Institute for Solar System Research, Katlenburg-Lindau, Germany
Received: 7 November 2007 – Revised: 16 December 2008 – Accepted: 17 December 2008 – Published: 30 March 2009
Abstract. Observations of polar mesosphere summer echoes
(PMSE) have been carried out during the summer periodes 1999–2001 and 2003–2004 at the very high latitude of 78◦N using the SOUSY Svalbard Radar (53.5 MHz) at Longyear-byen. Although the measurements could not be done con-tinuously in these seasons, PMSE have been detected over more than 6600 h of 9300 h of observation time overall. Using this data base, particular PMSE occurrence charac-teristics have been determined. PMSE at Svalbard appear from the middle of May to the end of August with an al-most permanent total occurrence in June and July. Diur-nal variations are observable in the height-depend occur-rence rates and in PMSE thickness, they show a maximum around 09:00–10:00 UTC and a minimum around 21:00– 22:00 UTC. PMSE occur nearly exclusively between a height of 80 km and 92 km with a maximum near 85 km. How-ever, PMSE appear not simultaneously over the entire height range, the mean vertical PMSE extension is around 4–6 km in June and July. Furthermore, typically PMSE are separated into several layers, and only 30% of all PMSE are single lay-ers. The probability of multiple layers is greater in June and July than at the beginning and the end of the PMSE season and shows a marked 5-day-variation. The same variation is noticeable in the seasonal dependence of the PMSE occur-rence and the PMSE thickness. We finally discuss potential geophysical processes to explain our observational results.
Keywords. Atmospheric composition and structure (Aerosols and particles; Middle atmosphere – composition and chemistry) – Meteorology and atmospheric dynamics (Climatology)
Correspondence to: M. Zecha ([email protected])
1 Introduction
Strong mesospheric VHF radar echoes are observed dur-ing summer months at polar latitudes and with a lower oc-currence rate at middle latitudes as well. They are called polar mesosphere summer echoes (PMSE) and mesosphere summer echoes (MSE), respectively. The phenomenon of these radar echoes is observed more or less sporadically for nearly three decades since the first detections in mid latitudes (Czechowsky et al., 1979) and polar latitudes (Ecklund and Balsley, 1981). The latter authors first pointed out their par-ticular traits, which discriminate them from standard VHF radar echoes resulting from backscatter by ionisation irregu-larities created by neutral turbulence in the mesosphere.
In order to create backscatter, irregularities at the scale of half the radar wavelength (Bragg scale) need to be present. At the PMSE altitudes, the spatial scale of typically used VHF radars is in the viscous subrange of neutral turbu-lence (e.g. 3 m for observations at 50 MHz). Consequently, these irregularities are destroyed by viscous damping, mak-ing backscatter of this kind undetectable. However, the ion-isation irregularity destruction is prevented when the diffu-sion of electrons is reduced in the presence of heavy aerosol or ice particles. This process shifts the turbulence-driven spectrum of the ionisation irregularities to markedly shorter scales than those observed in the neutral turbulence (Kelley et al., 1987; Cho et al., 1992; Rapp and L¨ubken, 2003) and then results in the strong PMSE backscatter.
demonstrated by von Zahn and Bremer (1999). The clouds appear in the summer mesopause region due to very low temperatures and a sufficient water vapour content. Hence, the radar echoes can provide information about these atmo-spheric parameters and can be used to display features of at-mospheric dynamics. Reviews of the subject have been pre-sented by Cho and Kelley (1993), Cho and R¨ottger (1997) and most recently by Rapp and L¨ubken (2004).
Mesosphere summer echoes at mid latitudes have been in-vestigated so far only with VHF radars on frequencies near 50 MHz and only at a few stations near 50◦N. They are less frequent and weaker than polar mesosphere summer echoes and their occurrence is normally limited to daylight hours (Czechowsky et al., 1979; Thomas et al., 1996; Zecha et al., 2003).
Far more summer echoes have been detected at polar lati-tudes. They have been observed mostly at northern latitudes between 60◦N and 75◦N, and mostly with radars operating near 50 MHz (e.g. Ecklund and Balsley, 1981; Czechowsky et al., 1989; Kirkwood et al., 1998; Bremer et al., 2006). In addition, observations for differing Bragg scales were reported at higher frequencies on 224 MHz (Hoppe et al., 1988), on 933 MHz (R¨ottger et al., 1990), and on 1.29 GHz (Cho et al., 1992), as well as at lower frequencies on 15 MHz (Ogawa et al., 2003) and on 3 MHz (Bremer et al., 1996). In more recent years, PMSE were also detected in the South-ern Hemisphere at 62◦S–73◦S (e.g. Woodman et al., 1999; Morris et al., 2004, 2007; Kirkwood et al., 2007).
In this paper, the occurrence of PMSE at very high lati-tudes is statistically analysed for the first time. We present the results of observations carried out at Longyearbyen, Svalbard (78◦N, 17◦E) during the summer months of the years 1999–2001 and 2003–2004 using the SOUSY Svalbard Radar. After a brief description of the radar and the experi-ments in Sect. 2, the occurrence of PMSE and their variations in time and height are discussed in Sect. 3. Furthermore, the PMSE thickness and the multi-layered structure of PMSE are presented. Some concluding remarks follow in Sect. 4.
2 Instrumentation and experiment configuration
In 1998 the SOUSY Svalbard Radar (SSR) was installed on Svalbard to study the mesosphere, stratosphere and tropo-sphere at very high northern latitudes (Czechowsky et al., 1998). Here other systems allowed collocated observations, such as using rockets and lidars (e.g. L¨ubken et al., 2004; Strelnikov et al., 2006). The radar system has been oper-ated by the Max-Planck-Institut f¨ur Aeronomie Katlenburg-Lindau and by the University of Tromsø with substan-tial support by the Leibniz-Institut f¨ur Atmosph¨arenphysik K¨uhlungsborn.
The radar operates on 53.5 MHz. An almost circular array of 356 Yagi-antennas is used for both transmission and re-ception. Czechowsky et al. (1998) quote a one-way antenna
gain of 33 dB and a half power beam width of 4◦. Besides the vertical beam direction, it is possible to steer the beam by 5◦in a north-east, south-east, south-west and north-west direction. The transmitter operates with about 70 kW peak power and 4% duty cycle. For the mesosphere studies a 20-bit-complementary code of 2µs baud length was applied al-lowing a height resolution of 300 m. Coherent integrations were done online to reduce the data flow.
In this paper, only the results of measurements with the vertical beam are presented. The received power from this di-rection is usually expected to be the highest due to the known aspect sensitivity, as described in detail, e.g. in Czechowsky et al. (1988). In 1999–2001 eight original data dumps – each with 64 data point time series in which each data point re-sults from 21 coherent integrations – were combined to get a resulting time resolution of four minutes. In 2002 suitable measurements were not carried out. In 2003–2004 the ber of coherent integrations was reduced to 16 and the num-ber of data points in one time series was extended to 128. Only five time series were then combined resulting in a four minute resolution again. Hence, all the results presented in this paper are based on the same height and time resolutions. The main radar system parameters and experiment config-urations are summarized in Table 1.
Because the results of radar measurements depend on a lot of different technical radar parameters and experiment configuration factors, generally the comparison of radar mea-surements should be carried out on the basis of an absolute calibration (Latteck et al., 2007, 2008) to obtain the volume reflectivity. However, due to the similar configurations of the SSR during the considered years, for the purpose of this pa-per it is not strictly required to apply an absolute calibration. We are considering only the signal-to-noise ratio (SNR), which provides a qualitative measure of the PMSE signal oc-currence. The occurrence rates OR(SNR>SNRmin) of PMSE
greater than a given threshold value SNRminare determined.
This limit has been defined by SNRmin=0 dB in the years
1999–2001, but it has been modified to SNRmin=−10 dB in
the years 2003 and 2004 when the 10 dB power amplifier was removed. These thresholds were found to be sufficient for eliminating very low and doubtful signals near the noise level and, therefore, to be favourable for obtaining significant and consistent information on the diurnal and seasonal character-istics of PMSE as well as on their vertical structure.
3 Results and discussion
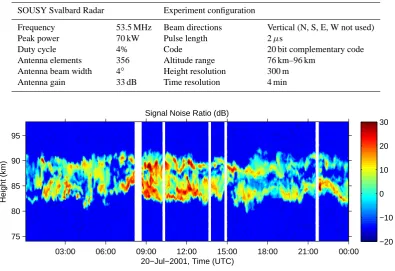
Table 1. Technical radar parameters and experiment configuration.
SOUSY Svalbard Radar Experiment configuration
Frequency 53.5 MHz Beam directions Vertical (N, S, E, W not used)
Peak power 70 kW Pulse length 2µs
Duty cycle 4% Code 20 bit complementary code
Antenna elements 356 Altitude range 76 km–96 km
Antenna beam width 4◦ Height resolution 300 m
Antenna gain 33 dB Time resolution 4 min
Signal Noise Ratio (dB)
20−Jul−2001, Time (UTC)
Height (km)
03:00 06:00 09:00 12:00 15:00 18:00 21:00 00:00 75
80 85 90 95
−20 −10 0 10 20 30
Fig. 1. Image plot of PMSE height-time intensity over Svalbard during a single day. The colours show the signal-to-noise ratio, white gaps
mark short interruptions resulting from transmitter inhabits due to local air traffic security.
but more frequently the echoes appear in two or more ver-tically separated layers. Most of the strong echoes occur in the hours around 10:00 UTC (around 11:00 LT; UTC=68 min difference to real local time at Longyearbyen, 17◦E) when also the largest vertical extents of PMSE have been observed. In the following, the general details of these properties will be discussed.
3.1 Seasonal variation
Due to constraints in transmitter reliability and manpower limitations, it was not possible to sustain measurements every day during all five summers resulting in gaps of some days or weeks. These gaps differ from season to season and limit sig-nificant inter-annual comparisons. However, the sum of all measurements covers the complete summer season between beginning of May and beginning of September. This pro-vides us to obtain mean PMSE characteristics for the years 1999–2004 at Svalbard.
Some properties of PMSE, such as day-to-day variations, could be smeared when averaging over a few years. There-fore, it is advisable to show these properties for a single sea-son. Because measurements were most continuous in 2001, we particularly concentrated on this year. Nearly continu-ous observations are available in the beginning, at the end,
and during a long period of the main PMSE season in July and August. In this period the ROMA campaign took place at Svalbard which provided simultaneous temperature mea-surements by meteorological rockets and lidars. This allows new comparisons with PMSE. Hence, in this paper both five-year-averaging and single-year results are shown. Finally it should be noted that the presented results from 2001 do not differ very strongly from results of the other investigated years.
In Fig. 2 the occurrence rate of PMSE averaged over the measurement period during one day is presented. This is for all days from the beginning of May to the beginning of September and the height range 76 km to 96 km. For each day it was tested for all 300-m range gates and for all 4-min-timeslots whether the estimated SNR value was larger than the threshold value SNRmin. The sum of these timeslots
events NPMSEwas compared with the sum of the time
inter-vals Ntwhen radar measurements were done. This yields the
occurrence rate OR=100 NPMSE/Ntin percent.
Daynumber
Height (km)
PMSE occurrence rate (in %)
140 160 180 200 220 240
76 78 80 82 84 86 88 90 92 94 96
[image:4.595.50.286.63.261.2]0 10 20 30 40 50 60 70 80
Fig. 2. Mean daily PMSE occurrence (averaged over 5 years) over
Svalbard as a function of season and height. PMSE are present quasi exclusively between 80 and 92 km from mid May to end of August (daynumbers about 140–245).
at the upper PMSE edge, and the occurrence gradient in time is somewhat steeper at the beginning compared to the fin-ishing period. The total altitude extension of PMSE grows rapidly in May, is fairly constant throughout June and July, and shrinks in August.
During the ROMA campaign, which was carried out from middle of July to middle of September 2001, PMSE were observed by radar and temperatures by meteorological rock-ets. Comparisons of results obtained by simultaneous mea-surements show good agreement between PMSE occurrence at height ranges, where the temperature is cold enough for the existence of ice particles (120–150 K). The seasonal and height variation of PMSE agrees well with the seasonal vari-ation of supersaturvari-ation, which is deduced from measured temperatures and pressures, and water vapor mixing ratios from models (L¨ubken et al., 2004). These results are gen-erally confirmed using the most recent available resonance lidar temperature measurements (Lautenbach et al., 2008; L¨ubken et al., 2009). The latter authors also showed that the uppermost portion of the supersaturated altitude range is void of PMSE due to the exponentially increasing kine-matic viscosity with height. This efficiently destroys any small scale irregularities, and hence also Bragg-scale struc-tures and PMSE (L¨ubken et al., 2009).
We now investigate the total occurrence rate, which we define as follows: It is searched for each 4-min-timeslot whether there is PMSE (SNR>SNRmin) within at least one
300 m range gate between 76 km and 96 km altitude. The upper panel in Fig. 3 shows the results related to the mea-surement time during each day of year.
1200 140 160 180 200 220 240 260
20 40 60 80 100
Daynumber
PMSE Occurrence (in %)
mean
1200 140 160 180 200 220 240 260
20 40 60 80 100
Daynumber
PMSE Occurrence (in %)
5 5 5 4 5 5 5 5 5 5 4 6 5
2001
SNR>SNR min
SNR>SNR
[image:4.595.311.544.66.367.2]min+15dB
Fig. 3. Mean seasonal variations of daily total PMSE occurrence
rates from SOUSY Svalbard Radar observations at Longyearbyen during five summers (upper panel) and the individual year 2001 (lower panel). The blue curve represents the development of the
occurrence rate for all echoes with SNR>SNRminand the green
curve for the strong echoes with SNR>SNRmin+15 dB. The
thresh-old was assigned to SNRmin=0 dB in the year 2001.
The earliest PMSE was found on 18 May in 2004 and the latest PMSE on 31 August in 2000. At the beginning of the PMSE period the daily occurrence increased during the very short time of about two weeks from 0% to nearly 100%. This means that the mean rate of occurrence increase from mid May to the beginning of June is about 7% per day. Sub-sequent to this period, for about 10 weeks PMSE are present almost all the time (i.e., the occurrence rate OR is nearly con-stant at 100%) before the occurrence rate decreases in about three weeks to 0% again (about−5% per day).
1200 140 160 180 200 220 240 260 2
4 6
Daynumber
daily mean
PMSE Thickness (km
)
mean
1200 140 160 180 200 220 240 260
2 4 6
Daynumber
daily mean
PMSE Thickness (km)
[image:5.595.311.546.64.262.2]2001
Fig. 4. Seasonal variation of daily mean PMSE thickness averaged
over all PMSE events during five summers (upper panel) and during the year 2001 (lower panel).
Further to the south at K¨uhlungsborn (54◦N) OR drops to 7% for some days at end of June and beginning of July (Bremer et al., 2006).
We note that in general comparison of observations at dif-ferent sites requires absolute calibration of the radars in-volved (Latteck et al., 2007). For the radars utilised here, however, system parameters are comparably similar (see Lat-teck et al., 1999, for the relevant technical parameters) so that an initial comparison seems to be acceptable. A more in depth quantitative comparison will be dealt within a different paper.
It is noticeable in the upper panel of Fig. 3 that the de-crease is not steady. To show these potential variations more clearly, the seasonal development of the occurrence rates OR(SNR>SNRmin with SNRmin=0 dB as defined above) in
the individual year 2001 is displayed in Fig. 3 (lower panel, blue chart). The routine measurements are started at the be-ginning of May, are interrupted from middle of June to mid-dle of July due to other radar experiments, and are contin-ued from middle of July until beginning of September. It is shown that beside the rapid increase and decrease of the occurrence rate and the nearly constant 100% occurrence in June and July, there is an indication of a quasi-periodic vari-ation of the occurrence rate.
Instead of considering all PMSE-detections we may also investigate a subset of the observation which we call the “strong events” and which we define with a threshold of SNRmin=15 dB. The total OR for this high threshold is
dis-played as the green curve in the lower panel of Fig. 3. Here, even in June and July, the maximum occurrence rates do not reach 100%. However, it becomes more evident that indi-cations of periodic variations in the total OR appear during
Time of Day (UTC)
Height (km)
PMSE occurrence rate (in %)
00:00 03:00 06:00 09:00 12:00 15:00 18:00 21:00 00:00 76
78 80 82 84 86 88 90 92 94 96
[image:5.595.51.284.65.245.2]0 5 10 15 20 25 30 35 40 45 50 55
Fig. 5. Mean PMSE occurrence as a function of height and time.
All mesosphere measurements during the summers 1999–2001 and 2003–2004 were analysed and combined. The maximum PMSE occurrence rate is observable over a wide height range (about 83-89 km) at the same time (09:00–10:00 UTC).
the whole summer. The period of this variation is about five days. These quasi-5-day-distances are marked by the black lines at the relative maxima of the total OR in Fig. 3. Similar characteristics were found in all the other observation years. Hence, it can be assumed that this quasi-5-day variation is a pronounced feature of PMSE occurrence at Svalbard.
To get information about the mean vertical extent of the PMSE for each 4-min-slot, all 300-m-resolution height bins with SNR>SNRminare counted and averaged over the
com-plete measurement time during the day. Figure 4 (upper panel) shows the mean seasonal variation of these data – hereafter called PMSE thickness – for the years 1999–2004 except 2002.
At the beginning of the summer season, PMSE layers are thin but the thickness grows rapidly and reaches 4–6 km mean values in June/July before it comes down to smaller values again at the end of the season (middle/end of August). The increase in the first 2 weeks and the decrease in the last 3 weeks of the PMSE season are about +0.25 km/day and −0.25 km/day, respectively. Although the total occurrence rate is practically 100% in the 10 weeks in-between (Fig. 3) the PMSE thickness varies between about 4 km and 6 km.
00:00 03:00 06:00 09:00 12:00 15:00 18:00 21:00 00:00 30
35 40 45 50 55 60 65 70 75
SNR>SNR min
Time of Day (UTC)
mean occurrence rate of PMSE (in %)
SNR>SNR
[image:6.595.52.281.63.238.2]min+15 dB
Fig. 6. Mean diurnal variation of PMSE occurrence during five summers between 1999 and 2004 for different thresholds:
SNR>SNRmin (blue curve) and SNR>SNRmin+15 dB (green
curve, indicating strong events).
3.2 Diurnal variation
The mean diurnal variation of the PMSE occurrence dur-ing the five PMSE seasons based on the maximum height and time resolution is shown in Fig. 5 as a function of time and altitude. PMSE have been observed between 80 km and 92 km. The diurnal variation in the lower and upper 2 km of this range is not well pronounced but in the middle part it is identifiable that most PMSE appear between 03:00 UTC and 18:00 UTC with a clear maximum at 09:00–10:00 UTC. The daily minimum is noticeable near 21:00–22:00 UTC. These temporal characteristics can be observed more or less pro-nounced at all altitudes.
Figure 6 displays the diurnal variation of the mean total occurrence rate. Separately for each hour of the day it was counted, how often PMSE with SNR>SNRmin(blue curve)
occur in at least one range gate in the 4-min bins and then this value was related to all measurements in this hour. The diagram shows a very slight variation with a maximum at 09:00–10:00 UTC and minimum at 22:00–23:00 UTC. The mean value of about 70% here is certainly influenced by the length of the averaging period, i.e., it certainly matters whether the initial rise and final decay of the season are in-cluded or not.
If only strong echoes are regarded, for example PMSE with SNR>SNRmin+15 dB as demonstrated by the green
line in Fig. 6, the variation with the maximum at 09:00– 10:00 UTC and the minimum at 21:00–22:00 UTC is more pronounced. It shows that before and around noon more strong echoes appear and less in in the evening.
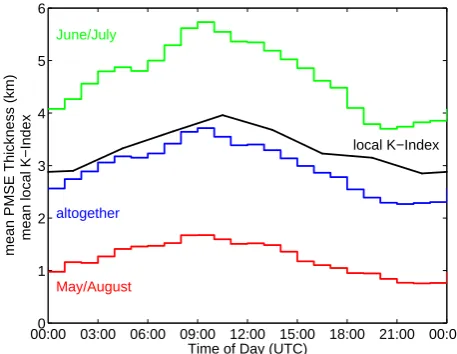
The mean diurnal variations of PMSE thickness is dis-played in Fig. 7 with a one-hour-resolution. This value for
00:000 03:00 06:00 09:00 12:00 15:00 18:00 21:00 00:00 1
2 3 4 5 6
June/July
May/August
altogether
local K−Index
Time of Day (UTC)
mean PMSE Thickness (km)
[image:6.595.311.540.65.242.2]mean local K−Index
Fig. 7. Colored lines: Mean diurnal variation of PMSE thickness
averaged over all PMSE events during five summers between 1999 and 2004 for the periods May/August (red), June/July (green) and the complete summer season (blue). The mean K-index for geomag-netic activity at Longyearbyen (averaged over the complete summer seasons of five years) shows the same diurnal variation (black line).
the vertical extent of PMSE is shown for the complete mea-surement season (blue curve), for May and August as the beginning and the end of the season (red curve) and for June and July when PMSE occur nearly permanently (green curve). It is noticeable that all the time PMSE are most extended at 09:00–10:00 UTC and narrowest near 21:00– 22:00 UTC. Hence, this characteristic is not a function of the season. The mean daily times for maximum and minimum of the PMSE thickness and of the PMSE occurrence are the same.
Over Svalbard daylight conditions are permanent during the summer and the solar zenith angle varies only slightly (maximum 24◦difference from local midnight to local high noon). The absolute solar zenith angle reaches a minimum of about 55◦at high noon at summer solstice and a maximum of about 90◦at midnight at end of August. Hence, there is only a minor diurnal solar influence. However, the PMSE occurrence is also influenced by particle precipitation events (e.g. Bremer et al., 2001; Barabash et al., 2002; Morris et al., 2005) which are closely related to geomagnetic variations. The geomagnetic local K-index of Longyearbyen, Svalbard, in a three-hour-resolution (provided by the Tromsø Geophys-ical Observatory, http://geo.phys.uit.no/geomag.html) aver-aged over the period from May to August of the five years (black curve) is displayed also in Fig. 7. It shows the same diurnal variations with a maximum between 09:00 and 12:00 UTC and a minimum between 21:00 and 24:00 UTC as the PMSE occurrence rates and PMSE thickness. This could be a hint to the prominent influence of electron den-sity enhancements during auroral disturbances on PMSE at Svalbard.
3.3 Height distribution and layering
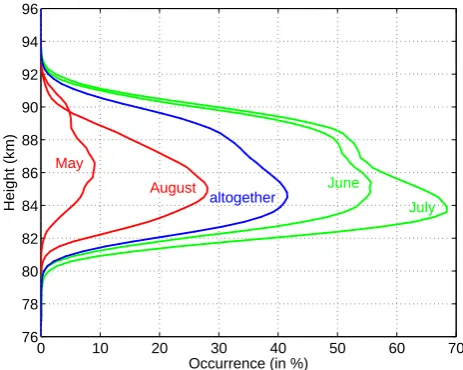
The cumulative height distribution of PMSE occurrence rate is shown in Fig. 8 where the seasonally integrated occur-rence time for PMSE is plotted in dependence on height (blue curve). PMSE occur most frequently in the center of the height region (∼82–88 km) with a peak near 85 km. They are quite rare (<10%) below 81 km and above 91 km. Prac-tically no coherent echoes were observed below 80 km and above 92 km. These facts are similar to the results from mid-dle and moderate polar latitudes (e.g. Zecha et al., 2003; Lat-teck et al., 2007). However, in contrast to these locations the PMSE distribution over Svalbard is not symmetrically ar-ranged with height around its maximum but shows a “shoul-der” at heights above the maximum. This is a typical feature which has been observed in all years and which has been reported also in earlier works (R¨uster et al., 2001; L¨ubken et al., 2004).
Due to the seasonal variations, the presented PMSE oc-currence rates as a function of height depend on the averag-ing period, the mean occurrence rates are greater in June and July (green curves) than in May and August (red curves). The limitation of PMSE to the region between 80 km and 92 km is obvious for every month. The height of maxi-mum occurrence varied from 86 km in May to 84 km in July, which suggest a mean downward movement of PMSE during the season. Investigations of the daily mean PMSE heights of the single years have shown downward movements from mid May to end August with maximum 34 m/day in 2001 and minimum 0 m/day in 2004 (not displayed here). The maximum PMSE occurrence for the complete PMSE sea-son is near 85 km and comparable to the maximum at mid and lower polar latitudes (e.g. Zecha et al., 2003; Latteck
0 10 20 30 40 50 60 70
76 78 80 82 84 86 88 90 92 94 96
Occurrence (in %)
Height (km)
May
August
altogether
June
[image:7.595.311.543.65.250.2]July
Fig. 8. Mean height dependence of the PMSE occurrence rate
(av-eraged over five years) for the periods May and August (red), June and July (green), and the complete summer season (blue).
et al., 2007). The “shoulder” is especially prominent in June and July (green curves), it seems that especially during this time the PMSE are not symmetrically distributed around the height of the maximum occurrence.
To interpret this characteristic, it has to be remarked that the PMSE often occur not continuously over the complete al-titude range but also in some distinct separated layers. This layer structure is very common for PMSE observations over Svalbard (R¨uster et al., 2001; R¨ottger, 2003). The latter au-thor evaluated case studies and reported up to three or some-times even more PMSE structures separated on the average by less than a few kilometers in height.
Also in other latitudes such layering was observed. For example Hoffmann et al. (2005, 2008) performed in-depth statistical analyses of multiple layer PMSE events observed at Andenes. They quote that about 50% of all PMSE events are single layered and 50% are multiple layered at 69◦N. The mean heights of the maximum of the height distributions are given in this papers with about 85 km for single layers, about 83 km for the lowest layers and about 86 km for the second layers in the multiple layer cases.
In the following, we will investigate the statistics of such events at Svalbard based on the five years of observations. To determine the layer structure, the individual vertical profiles with the four minute time resolution and 300 m height resolu-tion are analysed. The layers are identified by echoes greater than the general threshold (SNR>SNRmin) and are separated
0 500 1000 1500 78
80 82 84 86 88 90 92 94
Height (km)
number 1 layer (30%)
0 1000 2000 3000
78 80 82 84 86 88 90 92 94
Height (km)
number 2 layers (34%)
0 1000 2000 3000 78
80 82 84 86 88 90 92 94
Height (km)
number 3 layers (24%)
0 500 1000
78 80 82 84 86 88 90 92 94
Height (km)
[image:8.595.56.547.61.262.2]number 4 layers (10%)
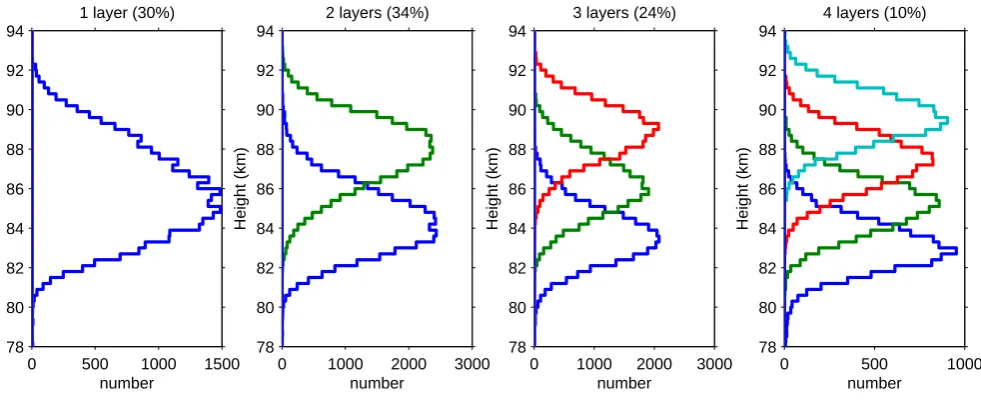
Fig. 9. For 1 to 4 layers structure occurrence (left panel to right panel, respectively): mean height dependence of the maxima of the first
(blue), second (green), third (red) and forth (cyan) of all layers, averaged over five summers between 1999 and 2004.
In Svalbard the number of single layer events is only about 30%. They are nearly symmetrically distributed between 80 km and 92 km around a maximum near 85 km as shown in the left panel of Fig. 9. Because the number of multiple layer cases outweighs the single layer cases they are further split into cases of two layers (34%), three layers (24%) and four layers (10%) as shown in the other panels of Fig. 9. The small remainder of about 2% is more than four layer events and are not shown here. If there are two layers then the max-imum of the lower layers (blue curve) is near 84 km and the maximum of the higher layers (green curve) near 88 km. For the three layer events the maxima of the height distributions are at about 83, 86 and 89 km and for the four layer events they are at about 83, 85, 88 and 90 km. If multiple layers oc-cur, than it is remarkable that in each case the distributions of the layers have nearly the same maximum value, nearly the same gaussian shape with nearly the same variance, and the heights of the maxima are nearly equally spaced.
The complete height distribution as displayed in Fig. 8 is related to a combination of all height distributions shown in Fig. 9. Its shape can be explained by the different appearance frequencies and vertical extensions of the various layers. The pronounced “shoulder” in June and July give a hint that in this period the occurrence of multiple layers is higher than in May and August.
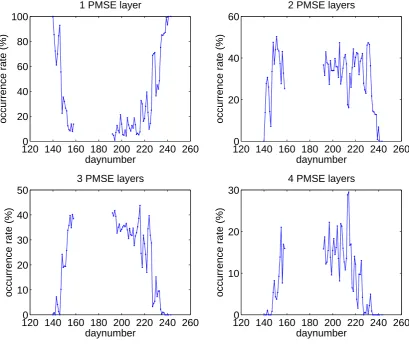
To explain this fact in detail in Fig. 10, the seasonal vari-ations of single, double, tripple and quadruple layering are shown for the year 2001. The diagram for single layers (upper left panel) shows that really the occurrence rate of these events starts at 100% in mid May, falls down rapidly to about 10%, varied around 10–20% during June and July, and rises up to 100% again in August. The other cases (upper right, lower left, and lower right panel for double, triple, and
quadruple layering, respectively) show the opposite charac-teristic. The curves rise up in the first 2 weeks of the PMSE appearance, remain at a relative constant level in June/July and fall down in August. This confirms the assumption that the layering is markedly dependent on season. Investigations for June and July of all five summers 1999–2001 and 2003– 2004 show that a single layer appears only in about 20% of all PMSE events in this period. The relations for double, triple and quadruple layers are then 36%, 28% and 12%, re-spectively.
What could be the reason for this layering. Hoffmann et al. (2005, 2008) found for the latitude of 69◦N an en-hanced formation of multiple PMSE layer structures in the presence of long period gravity waves and tidal activity as expected from their own microphysical modeling based on Rapp et al. (2003). They proposed that the observed multiple layer structures are mainly caused by layering of ice parti-cles due to subsequent nucleation cyparti-cles in the cold phases of long period gravity waves. They have confirmed this idea by comparisons from multiple layer occurrence with estima-tions of gravity waves based on continuous MF radar wind measurements at the same location. Some authors have dis-cussed the contribution of different physical parameters on the morphology of PMSE, like the general thermal structure, Kelvin-Helmholtz-instabilities, turbulence, tides and gravity waves (e.g. R¨ottger, 1994; Klostermeyer, 1997; Hill et al., 1999; Morris et al., 2006). All these physical processes could be reasons for the occurrence of multiple layers at 78◦N. However, more investigations are necessary to confirm this and the results will be published in the future.
120 140 160 180 200 220 240 2600 20
40 60 80 100
daynumber
occurrence rate (%)
1 PMSE layer
120 140 160 180 200 220 240 2600 20
40 60
daynumber
occurrence rate (%)
2 PMSE layers
120 140 160 180 200 220 240 2600 10
20 30 40 50
daynumber
occurrence rate (%)
3 PMSE layers
120 140 160 180 200 220 240 2600 10
20 30
daynumber
occurrence rate (%)
[image:9.595.93.503.64.410.2]4 PMSE layers
Fig. 10. Seasonal variation of the relative rate for the occurrence of 1, 2, 3 or 4 layers in all PMSE events during the year 2001.
some variations with a period of about five days. Five-day periodicities have been reported also in previous works about the mesopause region by some authors (e.g. Kirkwood et al., 1998; Kirkwood and Stebel, 2003; von Savigny et al., 2007; Merkel et al., 2008). They reported that observations of tem-peratures, zonal wind, NLC, PMSE and PMC show varia-tions correlating with the passage of 5-day planetary waves. These waves could also be the reason for the strong 5-day-variations in PMSE occurrence, thickness and layering over Svalbard.
The long data sets obtained with the SSR between 1999 and 2004 which we have treated here statistically can form a basis for further investigations of these long-period waves. The variations in PMSE occurrence and the analysis of wind profiles, which are available due to the SSR beam steer-ing, could verify the potential modulation by the long-period waves at these high polar latitudes. This issue will be left for a future investigation.
4 Conclusions
Extensive VHF radar observations at 53.5 MHz have been carried out at 78◦N at Svalbard with the SOUSY Svalbard Radar during five summer seasons between 1999 and 2004. One of the main aims of this project was the investigation of the occurrence of polar mesosphere summer echoes at this very high latitude. It is worth mentioning that measurements are available for every individual day between 2 May and 9 September at least in one of the five years. Based on the anal-ysis of more than 9300 h of measurements with more than 6600 h when PMSE were detected, the following results have been derived:
Diurnal variations of PMSE occurrence and thickness are dominated by a maximum around 09:00–11:00 UTC and a minimum around 21:00–23:00 UTC. This could be caused by precipitating particles as the geomagnetic impact shows in average the same variation.
A prominent property of PMSE at Svalbard is the layering of the echoes. The relative occurrence of single, double and triple layer events amount to about one third each, in June and July the number of single layers is only as little as 20%. Because the multiple layers are more often than in moderate and middle latitudes, the combined height distribution also differs from the other latitudes. It is not symmetrically ar-ranged around the maximum value near 85 km, but shows a characteristic “shoulder” above the maximum.
Hence, the common occurring characteristics of PMSE are observable at Svalbard too, but they are much more pronounced than comparable characteristics of mesosphere summer echoes in moderate polar latitudes and in middle lat-itudes. The utilisation of this fact could give advantages in further investigations regarding the creation and development of PMSE.
Acknowledgements. The SOUSY Svalbard Radar was operated by
the Max-Planck-Institut f¨ur Aeronomie Katlenburg-Lindau and by the University of Tromsø with support by the Leibniz-Institut f¨ur Atmosph¨arenphysik K¨uhlungsborn. Many scientists and engeneer-ing staff were involved in activities relatengeneer-ing to the radar. Rep-resentatively the authors would like to thank P. Czechowsky and colleagues, C. Hall and colleagues, J. Trautner, N. Engler, and J.-S. Chen, for their permission to use data, commitment and support in organising, system operating and data collecting, respectively.
Topical Editor U.-P. Hoppe thanks M. Rietveld and another anonymous referee for their help in evaluating this paper.
References
Barabash, V., Kirkwood, S., and Chilson, P. B.: Are variations in PMSE intensity affected by energetic particle precipitation?, Ann. Geophys., 20, 539–545, 2002,
http://www.ann-geophys.net/20/539/2002/.
Baumgarten, G., Fiedler, J., L¨ubken, F.-J., and von Cossart, G.: Particle properties and water content of noctilucent clouds and their interannual variation, J. Geophys. Res., 113, D06203, doi: 10.1029/2007JD008884, 2008.
Brasseur, G. and Solomon, S.: Aeronomy of the middle atmosphere, D. Reidel, Norwell, Mass., 1984.
Bremer, J., Hoffmann, P., Manson, A. H., Meek, C. E., R¨uster, R., and Singer, W.: PMSE observations at three different frequen-cies in northern Europe during summer 1994, Ann. Geophys., 14, 1317–1327, 1996,
http://www.ann-geophys.net/14/1317/1996/.
Bremer, J., Hansen, T., Hoffmann, P., and Latteck, R.: Dependence of polar mesosphere summer echoes on solar and geomagnetic activity, Adv. Space Res., 28, 1071–1076, 2001.
Bremer, J., Hoffmann, P., H¨offner, J., Latteck, R., Singer, W., Zecha, M., and Zeller, O.: Long-term changes of mesospheric summer echoes at polar and middle latitudes, J. Atmos.
So-lar Terr. Phys., 68, 1940–1951, doi:10.1016/j.jastp.2006.02.012, 2006.
Cho, J. Y. N. and Kelley, M. C.: Polar mesosphere summer radar echoes: Observations and current theory, Rev. Geophys., 31, 243–265, doi:10.1029/93RG01535, 1993.
Cho, J. Y. N. and R¨ottger, J.: An updated review of polar meso-sphere summer echoes: Observation, theory, and their relation-ship to noctilucent clouds and subvisible aerosols, J. Geophys. Res., 102, 2001–2020, 1997.
Cho, J. Y. N., Hall, T. M., and Kelley, M. C.: On the role of charged aerosols in polar mesosphere summer echoes, J. Geophys. Res., 97, 875–886, 1992.
Czechowsky, P., R¨uster, R., and Schmidt, G.: Variations of meso-spheric structures in different seasons, Geophys. Res. Lett., 6, 459–462, 1979.
Czechowsky, P., Reid, I. M., and R¨uster, R.: VHF radar measure-ments of the aspect sensitivity of the summer polar mesopause
echoes over Andenes (69◦N,16◦E), Norway, Geophys. Res.
Lett., 15(11), 1259–1262, 1988.
Czechowsky, P., Reid, I. M., R¨uster, R., and Schmidt, G.: VHF radar echoes observed in the summer and winter polar meso-sphere over Andoya, Norway, J. Geophys. Res., 94(D4), 5199– 5217, 1989.
Czechowsky, P., Klostermeyer, J., R¨ottger, J., R¨uster, R., and Schmidt, G.: The SOUSY-Svalbard-Radar for middle and lower atmosphere research in the polar region, Proceedings of the Eighth Workshop on Technical and Scientific Aspects of MST Radar (MST8), Bangalore, India, SCOSTEP Secret., pp. 318– 321, 1998.
Ecklund, W. L. and Balsley, B. B.: Long-term observations of the arctic mesosphere with the MST radar at Poker Flat, Alaska, J. Geophys. Res., 86, 7775–7780, 1981.
Goldberg, R., Pfaff, R., Holzworth, R., Schmidlin, F.-J., Voss, H., Tuzzolino, A., Croskey, C., Mitchell, J., Friedrich, M., Murtagh, D., Witt, G., Gumbel, J., von Zahn, U., Singer, W., and Hoppe, U.-P.: DROPPS: A study of the polar summer mesosphere with rocket, radar and lidar, Geophys. Res. Lett., 28, 1407–1410, 2001.
Hill, R. J., Gibson-Wilde, D. E., Werne, J. A., and Fritts, D. C.: Turbulence-induced fluctuations in ionization and application to PMSE, Earth Plan. Space, 51, 499–513, 1999.
Hoffmann, P., Singer, W., and Bremer, J.: Mean seasonal and diur-nal variations of PMSE and winds from 4 years of radar observa-tions at ALOMAR, Geophys. Res. Lett., 26, 1525–1528, 1999. Hoffmann, P., Rapp, M., Serafimovich, A., and Latteck, R.: On the
occurrence and formation of multiple layers of polar mesosphere summer echoes, Geophys. Res. Lett., 32, L05812, doi:10.1029/ 2004GL021409, 2005.
Hoffmann, P., Rapp, M., Fiedler, J., and Latteck, R.: Influence of tides and gravity waves on layering processes in the polar sum-mer mesopause region, Ann. Geophys., 26, 4013–4022, 2008, http://www.ann-geophys.net/26/4013/2008/.
Hoppe, U.-P., Hall, C., and R¨ottger, J.: First observation of summer polar mesosphere backscatter with a 224 MHz radar, Geophys. Res. Lett., 15, 28–31, 1988.
noc-tilucent cloud occurrence over NW Europe, J. Geophys. Res., 108, 8440, doi:10.1029/2002JD002356, 2003.
Kirkwood, S., Barabash, V., Chilson, P., R´echou, A., Stebel, K., Espy, P., Witt, G., and Stegman, J.: The 1997 PMSE season – its relation to wind, temperature and water vapour, Geophys. Res. Lett., 25, 1867–1870, doi:10.1029/98GL01243, 1998.
Kirkwood, S., Wolf, I., Nilsson, H., Dalin, P., Mikhaylova, D., and Belova, E.: Polar mesosphere summer echoes at Wasa,
Antarc-tica (73◦S): First observations and comparison with 68◦N,
Geo-phys. Res. Lett., 34, L15803, doi:10.1029/2007GL030516, 2007. Klostermeyer, J.: A height- and time-dependent model of polar mesosphere summer echoes, J. Geophys. Res., 102, 6715–6727, 1997.
Latteck, R., Singer, W., and Bardey, H.: The ALWIN MST radar: Technical design and performances, pp. 179–184, Eur. Space Agency, Neuilly, France, 1999.
Latteck, R., Singer, W., Morris, R. J., Holdsworth, D. A., and Mur-phy, D. J.: Observation of polar mesosphere summer echoes
with calibrated VHF radars at 69◦ in the northern and
south-ern hemispheres, Geophys. Res. Lett., 34, L14805, doi:10.1029/ 2007GL030032, 2007.
Latteck, R., Singer, W., Morris, R. J., Hocking, W. K., Murphy, D. J., Holdsworth, D. A., and Swarnalingam, N.: Similarities and differences in polar mesosphere summer echoes observed in the Arctic and Antarctica, Ann. Geophys., 26, 2795–2806, 2008, http://www.ann-geophys.net/26/2795/2008/.
Lautenbach, J., H¨offner, J., L¨ubken, F.-J., and Zecha, M.: The ther-mal structure at the topside and above of polar mesosphere
sum-mer echoes over Spitsbergen 78◦N, Ann. Geophys., 26, 1083–
1088, 2008,
http://www.ann-geophys.net/26/1083/2008/.
L¨ubken, F.-J., Zecha, M., H¨offner, J., and R¨ottger, J.: Tempera-tures, polar mesosphere summer echoes, and noctilucent clouds
over Spitsbergen (78◦N), J. Geophys. Res., 109, D11203, doi:
10.1029/2003JD004247, 2004.
L¨ubken, F.-J., Lautenbach, J., H¨offner, J., Rapp, M., and Zecha, M.: First continuous temperature measurements within polar meso-sphere summer echoes, J. Atmos. Solar Terr. Phys., 71, 453–463, doi:10.1016/j.jastp.2008.06.001, 2009.
Merkel, A. W., Garcia, R. R., Bailey, S. M., and Russell III, J. M.: Observational studies of planetary waves in PMCs and meso-spheric temperature measured by SNOE and SABER, J. Geo-phys. Res., 113, D14202, doi:10.1029/2007JD009396, 2008. Morris, R. J., Murphy, D. J., Reid, I. M., Holdsworth, D. A., and
Vincent, R. A.: First polar mesosphere summer echoes observed
at Davis, Antarctica (68◦S), Geophys. Res. Lett., 31, L16111,
doi:10.1029/2004GL020352, 2004.
Morris, R. J., Terkildsen, M. B., Holdsworth, D. A., and Hyde, M. R.: Is there a causal relationship between cosmic noise ab-sorption and PMSE ?, Geophys. Res. Lett., 32, L24809, doi: 10.1029/2005GL024568, 2005.
Morris, R. J., Murphy, D. J., Vincent, R. A., Holdsworth, D. A., Klekociuk, A. R., and Reid, I. M.: Characteristics of the wind, temperature and PMSE field above Davis, Antarctica, J. Atmos. Solar Terr. Phys., 68, 418–435, doi:10.1016/j.jastp.2005.04.011, 2006.
Morris, R. J., Murphy, D. J., Klekociuk, A. R., and Holdsworth, D. A.: First complete season of PMSE observations above Davis, Antarctica, and their relation to winds and temperatures,
Geo-phys. Res. Lett., 34, L05805, doi:10.1029/2006GL028641, 2007. Ogawa, T., Arnold, N. F., Kirkwood, S., Nishitani, N., and Lester, M.: Finland HF and Esrange MST radar observations of po-lar mesosphere summer echoes, Ann. Geophys., 21, 1047–1055, 2003,
http://www.ann-geophys.net/21/1047/2003/.
Rapp, M. and L¨ubken, F.-J.: On the nature of PMSE: Electron dif-fusion in the vicinity of charged particles revisited, J. Geophys. Res., 108(D8), 8437, doi:10.1029/2002JD002857, 2003. Rapp, M. and L¨ubken, F.-J.: Polar mesosphere summer echoes
(PMSE): Review of observations and current understanding, At-mos. Chem. Phys., 4, 2601–2633, 2004,
http://www.atmos-chem-phys.net/4/2601/2004/.
Rapp, M., Gumbel, J., L¨ubken, F.-J., and Latteck, R.: D re-gion electron number density limits for the existence of polar mesosphere summer echoes, J. Geophys. Res., 107(D19), 4187, doi:10.1029/2001JD001323, 2002.
Rapp, M., L¨ubken, F.-J., Hoffmann, P., Latteck, R., Baumgarten, G., and Blix, T.: PMSE dependence on aerosol charge num-ber density and aerosol size, J. Geophys. Res., 108(D8), 8441, doi:10.1029/2002JD002650, 2003.
R¨ottger, J.: Middle atmosphere and lower thermosphere processes at high latitudes studied with the EISCAT radar, J. Atmos. Terr. Phys., 56, 1173–1195, 1994.
R¨ottger, J.: About multiple layering and aspect sensitivity of po-lar mesosphere summer echoes, Proceedings of the Tenth Inter-national Workshop on Technical and Scientific Aspects of MST Radar (MST10), Radio Observatorio de Jicamarca and Universi-dad de Piura, Peru, pp. 54–57, 2003.
R¨ottger, J., Rietveld, M. T., LaHoz, C., Hall, C., Kelley, M. C., and Swartz, W. E.: Polar mesosphere summer echoes observed with the EISCAT 993-MHz radar and the CUPRI 46.9-MHz radar, their similarity to 224-MHz radar echoes, and their relation to turbulence and electron density profiles, Radio Sci., 25, 671–687, 1990.
R¨uster, R., R¨ottger, J., Schmidt, G., Czechowsky, P., and Kloster-meyer, J.: Observations of mesospheric summer echos at VHF in the polar cap region, Geophys. Res. Lett., 28, 1471–1474, 2001. Strelnikov, B., Rapp, M., Blix, T. A., Engler, N., H¨offner, J., Laut-enbach, J., L¨ubken, F.-J., Smiley, B., and Friedrich, M.: In situ observations of small scale neutral and plasma dynamics in the
mesosphere/lower thermosphere at 79◦N, Adv. Space Res., 38,
2388–2393, 2006.
Thomas, G. E. and McKay, C. P.: On the mean particle size and water content of polar mesospheric clouds, Planet. Space Sci., 33, 1209–1224, doi:10.1016/0032-0633(85)90077-7, 1985. Thomas, L., Marsh, A. K. P., Wareing, D. P., Astin, I., and Chandra,
H.: VHF echoes from the midlatitude mesophere and the thermal structure observed by lidar, J. Geophys. Res., 101, 12867–12877, doi:10.1029/96JD00218, 1996.
von Cossart, G., Fiedler, J., and von Zahn, U.: Size distributions of NLC particles as determined from 3-color observations of NLC by ground-based lidar, Geophys. Res. Lett., 26, 1513–1516, 1999.
von Savigny, C., Robert, C., Bovensmann, H., Burrows, J. P., and Schwartz, M.: Satellite observaions of the quasi 5-day wave in noctilucent clouds and mesopause temperatures, Geophys. Res. Lett., 34, L24808, doi:10.1029/2007GL030987, 2007.
observations of noctilucent clouds and polar mesosphere summer echoes, Geophys. Res. Lett., 26, 1521–1524, 1999.
Woodman, R. F., Balsley, B. B., Aquino, F., Flores, L., Vazquez, E., Sarango, M., Huamann, M. M., and Soldi, H.: First observations of polar mesosphere summer echoes in Antarctica, J. Geophys. Res., 104, 22577–22590, doi:10.1029/1999JA900226, 1999.
Zecha, M., Bremer, J., Latteck, R., Singer, W., and Hoffmann, P.: Properties of midlatitude mesosphere summer echoes after three
seasons of VHF radar observations at 54◦N, J. Geophys. Res.,