ENGINEERING HONOURS THESIS
BACHELOR OF ENGINEERING
(INSTRUMENTATION AND CONTROL AND INDUSTRIAL COMPUTER SYSTEMS)
2017
School of Engineering and Information Technology
SINGLE INVERTED PENDULUM WITH NOVEL
HARDWARE
Student Name: Mohd Fauzul Rizal Abdul Halim
i
Abstract
The purpose of this project is to stabilize an inverted pendulum from its rest position
using a feedback control. The single inverted pendulum (SIP) is a classical nonlinear
system. SIP used in this thesis consists of a pole attached to the cart and driven by a
DC motor which is supplied via a motor driver. The position of the pendulum is
measured by an encoder that is positioned behind the pendulum cart. SIP used in
this project were controlled by a single microprocessor and programmed using a
LabVIEW. The microprocessor will process the pendulum’s position, and a controller
designed in LabVIEW will react according to the position of the pendulum.
Statechart design and State Machine Design are two methods used in this project to
combine the swing up routine and stabilizing routine. The on-off controller is used
inside the swing up routine while in stabilizing mode, four types of controller has
been tested which is P, PI, PD and PID controller.
The main objective of this project is to balance the pendulum at its upright position
from its stable position. Another objective of this thesis is to integrate the software
and hardware of the system. Overall, this project can be considered success, and
most of the objective has been achieved even though the pendulum can only be
stabilized about a few second it still consider a great achievement consider that the
ii
Contents
1.0 Introduction ... 1
1.1 Problem Statement ... 2
1.2 Project Objective ... 3
2. Literature Review ... 4
2.1 Inverted Pendulum ... 4
2.1.1 SEGWAY PT... 5
2.1.2 Rocket Stability ... 6
2.2 Modelling ... 7
2.3 Hardware Components ... 11
2.4 Actuator Selection ... 11
2.4.1 Electrical Actuator ... 11
2.4.2 Pneumatic and Hydraulic Actuator ... 13
2.5 Feedback Network ... 15
2.5.1 Sensor for Angle ... 15
2.5.2 Sensor for Distance ... 16
2.6 Control Theory ... 17
3. Hardware & Overall System ... 20
3.1 Overall System ... 20
3.2 Absolute Encoder ... 22
3.3 Incremental Encoder ... 25
3.4 DC MOTOR & MOTOR DRIVER ... 27
3.5 Myrio ... 30
4. Software & Programming ... 34
4.1 Statechart Module ... 35
4.2 State Machine Programming ... 41
5. System Design & Implementation ... 42
5.1 Overall Sequence ... 42
5.2 Swing-up routine ... 45
5.3 Stabilize routine ... 47
6. Results ... 48
6.1 State machine ... 48
6.2 Statechart ... 52
7. Summary ... 55
iii
8. Reference ... 57
9.Appendix ... 58
List of Figures
Figure 1: Free Body Diagram of the inverted pendulum system [1]... 4Figure 2: SEGWAY HT [3]. ... 5
Figure 3: Three cases of the rocket which the flight direction is exactly vertical [5]. ... 6
Figure 4: Free Body Diagram of the inverted pendulum [1]. ... 7
Figure 5: Self-balancing robot on RC car [6]. ... 12
Figure 6: Servo motor [8]. ... 13
Figure 7: Stepper Motor [9]. ... 13
Figure 8: DC Motor [10]. ... 13
Figure 9: Hydraulic Cylinder [12]. ... 14
Figure 10: Pneumatic Cylinder [13]. ... 14
Figure 11: Inverted Pendulum with Servo Pneumatic by Enfield Technologies [14]. ... 15
Figure 12: Single turn potentiometer [16]. ... 16
Figure 13: Multi-turn potentiometer [17]... 16
Figure 14: Ultrasonic Sensor HC-SR04 [18]. ... 17
Figure 15: Overall physical System of the inverted pendulum. ... 20
Figure 16: Overall Wiring diagram. ... 21
Figure 17: SICK ARS60-A4A08192 Absolute Encoder. ... 23
Figure 18: Program for the absolute encoder. ... 24
Figure 19: Incremental Encoder Pulse Diagram [21]. ... 25
Figure 20: Incremental encoder attached to the DC motor. ... 26
Figure 21: Build in Express VI for the incremental encoder. ... 26
Figure 22: M48x60 24V KAG DC motor. ... 27
Figure 23: PWM express VI. ... 27
Figure 24: Program for motor control. ... 28
Figure 25: BTS-7960 Motor Driver. ... 29
Figure 26: NI MyRIO Hardware Block Diagram [22]... 30
Figure 27: MXP connector A and B [22]. ... 31
Figure 28: Analog Input Circuitry [22]. ... 32
Figure 29: Analog output Circuitry [22]. ... 32
Figure 30: DIO lines 0 to 13 on MXP connector A and B [22]. ... 33
Figure 31: DIO lines 14 and 15 on MXP connector A and B [22]... 33
Figure 32: Run Statechart function [24]. ... 36
Figure 33: Statechart Development Palette [24]. ... 39
Figure 34: Statechart Editor Window. ... 40
Figure 35: Example of state machine programming [24]. ... 41
Figure 36: Operational modes bound by the limit. ... 42
Figure 37: State Diagram for the Inverted Pendulum Project. ... 44
Figure 38: Inverted Pendulum in swing mode. ... 45
Figure 39: Block diagram for stabilizing the program. ... 47
iv
Figure 41: PI controller with four as a gain and 0.005 integral value. ... 50
Figure 42: PD Controller with gain 4 and 0.001 Derivative value. ... 50
Figure 43: PID Controller with gain 4, Integral 0.1 and 0.01 Derivative value. ... 51
Figure 44: Swing up controller with 25% duty cycle. ... 52
Figure 45: Swing up controller with 80% duty cycle. ... 53
Acknowledgement
I would like to express my gratitude to my supervisor, Associate Professor Graeme
R. Cole, for all the invaluable guidance advice and encouragement given throughout
the course of this project. I would like to thank you to the both of the following
individual Mr. lafeta Laava and Mr. Will Stirling as they provide me with hardware
knowledge and help me troubleshoot the hardware.
I would like to thank and appreciate my family for their continuous love, patience,
and support from the beginning up until the end of my project.
Last but not least, a word of appreciation are given to all my friends at the Murdoch
University and everyone who helped or contributed in one way or another towards
v
List Of Abbreviation
SIP-Single Inverted Pendulum
LabVIEW-Laboratory Virtual Instrument Engineering Workbench
PWM-Pulse Width Modulation
AI-Analog Input
AO-Analog Output
DIO-Digital Input and Output
ADC-Analog to Digital Converter
DAC-Digital to Analog Converter
SSI-Synchronous Serial Interface
SPI-Serial Peripheral Interface
PPR-Pulses Per Revolution
FPGA-Field Programmable Gate Array
PID- Proportional-Integral-Derivative
LQR-Linear Quadratic Regulator
1
1.0 Introduction
At some point in our lives, almost all of us have attempted to balance a stick on the
palm of our hand. The stick represents as an inverted pendulum with the difference
that the stick on our palm can move freely in a three-dimensional space meanwhile
in this project, the pendulum is mounted on the cart, and the movement limited to
one degree of freedom. Single Inverted Pendulum (SIP) is highly unstable system
and proper force need to be applied to maintain the balance at the upright position.
Despite its simple structure, SIP regard as one of the most difficult systems to
control. This difficulty arises because of the equation of the motion used for the
system is inherently nonlinear plus the upright position is an unstable equilibrium.
SIP involves many basic elements of control methodology. Because of the
non-linearity of the system, SIP often used to test the performance and efficiency of the
control methodology.
The SIP control problem consists of two task which is to swing up the pendulum from
its resting position and then stabilize the pendulum in an upright position. These two
tasks usually required two different controllers to accomplish both tasks. One for
swinging the pendulum high enough until it reaches the certain limit before the
second controller takes place to stabilize the pendulum. In this project, both
controllers has been designed using a LabVIEW software. 2 methods of designing
the SIP system using a LabVIEW is using a Statechart method or state machine
2
1.1 Problem Statement
The purpose of this project is to keep the pendulum in an upright position from its
stable position. This inverted pendulum system having only one input which is the
voltage applied to the motor and produce two output which is the position of the
pendulum and the angle produced by the pendulum.
Based on the above statement, a few problems have been identified to make the
pendulum stay in the upright position;
1. What is the control method used to stabilize the pendulum at the upright
position?
2. What kind of controller is suitable to swing the pendulum?
3
1.2 Project Objective
There are four main objectives for this thesis which is:
1. Complete the commissioning and operability of the SIP machine.
The SIP was constructed before by the previous student. At the beginning of
the thesis, it is a must to check the machine status before going any further to
avoid more unknown and complex problem in the future. After all the
apparatus and the connection have been tested, and in a good state, then the
next phase can proceed.
2. Implies Completion of Interfacing and software control by MyRIO.
In this thesis, MyRIO has been choosing as the heart of the system.
Developing a LabVIEW program for MyRIO is quite different compare to
developing the LabVIEW program in a computer. Additional knowledge and
research are used to find the correct way to design the LabVIEW program
using MyRIO.
3. Statechart and State Machine Design Implementation.
SIP system in this thesis uses two controllers to swing up the pendulum and
to stabilize the pendulum at its upright position. Because of that, Statechart
and State machine design methods are used to switch between the two
controllers.
4. Balance the pendulum from its resting position.
The previous student only concerns stabilizing the pendulum starting with the
pendulum already at its upright position. In this thesis, swing up routine is
developed to bring the pendulum up to the upright position from its stable
4
2. Literature Review
This chapter discusses the relevant background information that related to the
project. This chapter also reveals some of the technology and methodologies that
have been done by previous student or researchers.
2.1 Inverted Pendulum
Figure 1: Free Body Diagram of the inverted pendulum system [1].
Simple an inverted pendulum system consists of a pole attached to the cart as
shown in figure 1 above. When there is no force acting on the cart, the pendulum is
stable where the pole is facing downward [2]. For the pole to be hanging upward, the
system naturally unstable and need to actively apply forces to the cart to hang
upward [2].
To achieve the stability, proper control theory is required. Because of the complexity
of this unstable system, many researchers and engineers used the inverted
pendulum modelling as a starting to study and apply the knowledge for more
complex system such as maintaining rocket trajectory during take-off or a
self-balancing scooter, SEGWAY PT can balance a human standing on its platform while
5 double inverted pendulum is used where additional pole is attached at the end of the
first pole as now there are two angles need to be controlled instead of one.
2.1.1 SEGWAY PT
Figure 2: SEGWAY HT [3].
Inventor of the scooter, Dean Kamen holds more than 150 U.S and foreign patents
related to the medical devices climate control system and helicopter design [2].
Segway only has two wheels where the user needs to lean slightly forward or
backward to move the Segway forward or backward.
Segway operation can be modeled by a human standing. For example, if you lean
forward, you will be out of balance and could befall on the face but the brain will act
as a controller and automatically trigger your leg to move forward to prevent the fall
[4]. The Segway does the same thing but uses a motor instead to move forward and
backward [4]. Instead of a brain, Segway used a microcontroller to read the state of
the art tilt sensors and gyroscope to balance the Segway [4]. Three gyroscopes are
6 2.1.2 Rocket Stability
When the rocket is in flight, small gusts of winds could cause the rocket to wobble
and thus changing the flight direction [5]. When the rocket changes the flight
directions means the rocket had been rotating at its center of gravity, cg as shown in
figure 3 as a yellow dot [5]. Whenever the rocket is moving away from the original
flight direction, a lift force is generated by the rocket body and fins plus the
aerodynamic drag remain constant where only for small inclination [5]. Lift and drag
actions both taking place at the center of pressure, cp as shown in figure 3 as a
black and yellow dot [5].
Figure 3: Three cases of the rocket which the flight direction is exactly vertical [5].
There are three cases where the flight direction is exactly vertical which is powered,
stable and coasting [5]. The rocket stays in the flight direction axis. Thus, there is no
lifting force involve and the drag force is along the axis with the flight direction [5].
When the rocket is in powered and coasting cases, the lifting force will act towards
7 During powered cases, both lift and drag force will produce a counter-clockwise
torque which in turn swing the tail of the rocket to the right and the nose of the rocket
to the left direction [5]. Same goes for coasting case where this time both the lift and
drag force produce clockwise torque and swing the tail of the rocket to the left and
the nose of the rocket to the right [5]. Engineer call this a restoring force because the
forces recovered the rocket to be at its correct flight direction again and the rocket
remains stable [5].
2.2 Modelling
Figure 4: Free Body Diagram of the inverted pendulum [1].
M=Mass of the cart m=Mass of the pendulum
b=Friction of the cart I=Inertia of the pendulum
l=Length to the pendulum’s centre of mass F=Impulse force applied cart
8 By summing all the forces of the cart in the horizontal direction in figure 4, we can
get the following equation of motion:
M ẍ + bẋ + N = F (2.1)
The force exerted in the horizontal direction due to the moment on the pendulum is:
τ = r x F +lθ̈
F = l θ̈/r = ml2θ̈/l = mlθ̈
Centripetal force acting along the horizontal axis:
F = lθ̇2/r = ml2θ̇2/l = mlθ̇2
Summing all the forces in the Free body diagram in the horizontal direction to get the
equation for the N:
N=mẍ + mlθ̈cosθ - mlθ̇2sinθ (2.2)
Substitute equation (2.1) and (2.2)
(M+m) ẍ + bẋ +mlθ̈cosθ -mlθ̇2sinθ = F (2.3)
For the second equation of motion, sum the forces perpendicular to the pendulum.
The vertical components of those are:
9 To remove the P and N from the equation, the moments around the centroid need to
be sum:
-Plsinθ – Nicosθ = lθ̈ (2.5)
Combining equation [4] and [5]:
(l+ml2)θ̈+mglsinθ = -mlẍcosθ (2.6)
Set of equations that define the dynamics of the inverted pendulum are:
(M+m) ẍ + bẋ +mlθ̈cosθ -mlθ̇2sinθ = F (2.3)
(l+ml2)θ̈+mglsinθ = -mlẍcosθ (2.6)
These two equations are nonlinear because it includes sin and cos value so that the
equation need to be linearize about θ=π since the pendulum needs to be stabilize at
an unstable equilibrium position which is π radians.
Assume that θ=π + ø where ø represent a small deviation angle from the vertically
upward direction.
Therefore, cosθ = -1, sinθ = - ø and 𝑑2𝜃
𝑑𝑡2 = 0
After Linearization process, equation (2.3) and (2.6) become:
(M+m)ẍ +bẋ - ml ø =u (2.7)
10 U in this case represent input which is the force applied to the cart. To get the
transfer function for the system where later could be useful for controller tuning is by
taking the Laplace transform of the system equation. The Laplace Transform are:
(M+m) X(s)s2 +bX(s)s – ml ø(s)s2 = U(s) (2.9)
(l+ml2) ø(s)s2 - mgl ø(s) = mlX(s)s2 (2.10)
Solving equation (2.9) and having angle phi as the output of interest:
X(s) = [(𝑙+𝑚𝑙
2)
𝑚𝑙 - 𝑔
𝑠2] ø(s) (2.11)
Then sub into equation (2.10)
(M+m) [(𝑙+𝑚𝑙
2)
𝑚𝑙 + 𝑔
𝑠] ø(s). s
2 +b [(𝑙+𝑚𝑙2)
𝑚𝑙 + 𝑔
𝑠 ]ø(s). s - ml ø(s)s
2 = U(s)
The transfer function become:
ø(s) 𝑈(𝑠)
=
𝑚𝑙 𝑞 .𝑠
2
𝑠3+𝑏(𝑙+𝑚𝑙2)
𝑞 .𝑠2−
𝑚𝑔𝑙(𝑀+𝑚)
𝑞 .𝑠−
𝑏𝑚𝑔𝑙 𝑞
(2.12)
Where q =(M+m) (l+ml2)-(ml)2
The transfer function can be simplified to:
ø(s) 𝑈(𝑠)
=
𝑚𝑙𝑠
𝑞𝑠3+𝑏(𝑙+𝑚𝑙2)𝑠2−𝑚𝑔𝑙(𝑀+𝑚)𝑠−𝑏𝑚𝑔𝑙 (2.13)
If we ignore the friction b=0, then the transfer function will be:
ø(s) 𝑈(𝑠)
=
𝐾𝑝 𝑠2 𝐴𝑝2−1 (2.14) Kp= 1(𝑀+𝑚)𝑔 and Ap= ±√
(𝑀+𝑚)𝑚𝑔𝑙
11
2.3 Hardware Components
Any system needs a good guideline what to choose during implementation time. For
the inverted pendulum project, a set of requirements need to be fulfilled for this
project to be a success which is [2]:
• Good working mechanical system [2].
• Noiseless sensor for feedback.
• Good communication between the microcontroller and mechanical system.
• Software platform.
2.4 Actuator Selection
There are plenty of choices to consider whenever choosing an actuator. Most people
choose actuator based on the project requirement and amongst the famous choose
for the actuator are electrical actuator and pneumatic and a hydraulic actuator.
2.4.1 Electrical Actuator
An electric actuator usually powered by a motor that uses electrical energy to
convert into mechanical torque. Electrical actuator considers as one of the cleanest
actuators as it doesn’t involve with oil. Most inverted pendulum systems consist of
the electrical actuator as it offers great function such as fast response and easy for
maintenance. For example, a self-balancing robot using RC car having the same
model as an inverted pendulum as shown in figure 5. The motor inside the car will
12
Figure 5: Self-balancing robot on RC car [6].
There are three main types of the motor available in the market which is DC motor,
stepper motor, and servo motor. Good DC motors have high torque and high speed
but it is more expensive compared to the stepper and servo motor [2, 7]. When using
the DC motor, when the torque and speed of the DC motor increase, the power to
run the motor also increase [2]. This, of course, will be limited to the circuitry used to
control the motor. The control circuitry for a DC motor is a motor driver which used to
change the direction and speed of the motor.
Stepper motor, on the other hand, has a high torque but suffer regarding speed [2].
Bipolar stepper motor should be chosen to turn the motor in both directions. Stepper
motor is also costly and consumes more power compared to DC motor [2, 7].
The servo motor, in this case, are harder to incorporate into the design. This is
because most of the servo motor has the ability only to rotate up to 360° [2]. To use
this motor, the cart that attached to the motor need to arrive at the end of the rail with
only one full rotational of the stepper motor [2]. This would require a large wheel or
gear thus reducing the amount of torque provided by the motor. Also, to be noted
that the voltage level supplied to the motor tells the motor which angles to be at [2]. It
13
Figure 6: Servo motor [8].
Figure 7: Stepper Motor [9].
Figure 8: DC Motor [10].
2.4.2 Pneumatic and Hydraulic Actuator
Pneumatic actuators consist of a piston inside a hollow cylinder. When external air
pressure applied to the piston, as the pressure inside the cylinder increases, the
14 operates the same way as a pneumatic actuator but using incompressible oil to
accumulate pressure instead of air in pneumatic actuators [11]
Figure 9: Hydraulic Cylinder [12].
Figure 10: Pneumatic Cylinder [13].
There are many inverted pendulum projects that use a pneumatic actuator, for
example, this inverted pendulum system created by Enfield Technologies shown in
figure 9 below. Figure 11 shows the inverted pendulum system that uses pneumatic
cylinder as the actuator for this system. Pendulum pole is attached to the cart and
the cart is attached to the cylinder rod which later will move the pendulum left and
15
Figure 11: Inverted Pendulum with Servo Pneumatic by Enfield Technologies [14].
2.5 Feedback Network
The good feedback network is necessary to produce a stabilizing system. Thus, the
sensor needs to be noiseless and fast response to the event so that the information
can be transmitted to the controller and controller can use the information to stabilize
the system. For this project, there are two parameters that need to be measured
which is the angle in between pendulum and cart and the displacement or cart.
2.5.1 Sensor for Angle
2.5.1.1 Potentiometer
The potentiometer is an electrical component with a variable resistance.
Potentiometer consists of 3 terminals [15]. Two terminals are connected to the
resistive element while the other terminal is connected to the sliding contact or wiper
[15]. The position of the knob or the wiper will determine the resistance of the
potentiometer and also can determine the output voltage of the potentiometer [15].
There are many types of the potentiometer such as a multi-turn potentiometer,
16 remains the most popular types of the potentiometer in an application where the
resolution and precision are not so important. When precision and resolution is
important, a multi-turn potentiometer could be used where it can provide up to 20
rotations for precision.
Figure 12: Single turn potentiometer [16].
Figure 13: Multi-turn potentiometer [17].
2.5.2 Sensor for Distance
2.5.2.1 Ultrasonic Sensor
Ultrasonic sensor can measure distance without actual contact. The ultrasonic
17 distance of the object, the ultrasonic sensor will produce an ultrasonic sound and
wait for the sound to bounce back to the origin [18]. After we get the traveling time
for the ultrasonic sound, and the speed of sound is fixed, we can calculate the
distance of the object by formula was given [18];
Distance= (total time the sound travel * speed of sound)/2
Figure 14: Ultrasonic Sensor HC-SR04 [18].
Figure 14 shows the ultrasonic sensor HC-SR04 is used to measure distance with a
range up to 400 cm [18]. The sensor consists of an ultrasonic transmitter, receiver
and the control circuit [18].
2.6 Control Theory
Because of the difficulty in controlling the SIP system, there are many existing
control methods for the inverted pendulum [19]. Many of the controllers developed
only tested in simulation and not in a real-time experiments [19]. Because almost all
the simulations used simplifies model to represent the behavior of the SIP system,
the simulations result is often different from the experiment results. This simplified
model often ignores the effect of the friction and fail to include some physical
restriction such as the finite track length and the capacity of the DC motor that drives
the SIP cart.
18
• Fuzzy Logic and Neural Network Controller.
This controller is very popular because of the simple structure and doesn’t
need complicated computation [19]. This method can be used for both
swing-up and stabilization implementation but somehow this method often lacks
specification of the stability condition [19].
• Proportional-Integral-Derivative (PID) Adaptive Control
This method is best used for stabilizing the pendulum but requires fine tuning
for a better result. P controller can be introducing to implement the on-off
controller for a swing-up mode.
• Energy-Based Control
One of the most popular to implement the swing up sequence. The stability
condition is proven using a Lyapunov technique [19]. An energy-based
method was introduced by Astrom and Furuta in 1996 using rotatory inverted
pendulum [19]. Later, their method was adapted to use with a cart-pendulum
system that having a finite length of the track [19].
• Hybrid Control
This method is based on the energy based control that can be used for both
swings up and stabilization of the pendulum without switching the controller
[19].
• Sliding Mode Control
One of the powerful and robust control method that can be used in many
19
• Linear Quadratic Regulator (LQR)
Simple and easy to implement the controller and can be performing well for
stabilizing the pendulum [19]. However, this controller relies heavily on the
selection of the weighing matrices, Q and R in the cost functional [19].
• Linear Quadratic Gaussian (LQG)
This controller combines LQR with a Kalman filter to improve disturbance
rejection [19]. However, during implementation they found out that the LQR
controller produces better response compare to the LQG controller [19].
• Approximate Linearization
This method involves finding a nonlinear point of change in order to construct
a linear approximation that behaves same as first order or second order
system [19]. The algorithm first constructed for the stabilization of the SIP at
the cart by Renon and Saydy [19]. Their experiment shows an improvement
in the system’s transient response but have a small region of stabilization
20
3. Hardware & Overall System
In this chapter, all the hardware used in this system is introduced and explanation
about the device used also included in this chapter.
3.1 Overall System
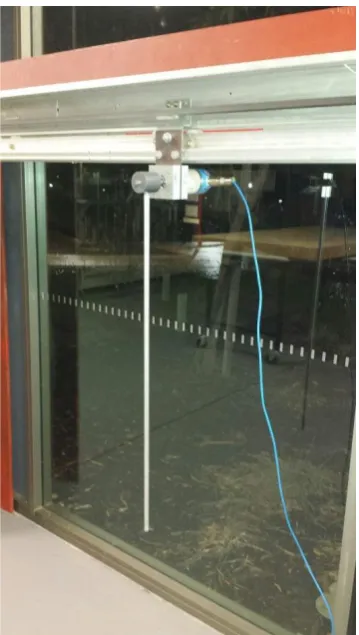
Figure 15: Overall physical System of the inverted pendulum.
Figure 15 above shows the overall physical system of the SIP. The pendulum used
in this project is connected to the pendulum cart made from the aluminum base
attach to the wheel that can move freely to the left and right of the rail. 24 V DC is
mounted with a sprocket onto its shaft and attach to the belt which the pendulum cart
is attached to. Absolute Encoder that are used to detect the angle of the pole is
attached at the back of the pendulum. The incremental encoder in other hand is
21
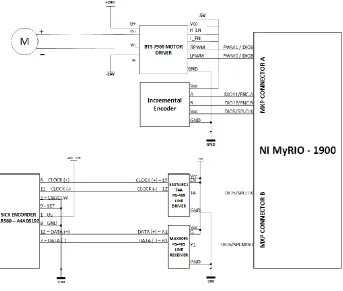
Figure 16: Overall Wiring diagram.
Figure 16 shows the overall wiring diagram of the SIP system used for this thesis.
PWM 0 and PWM 1 is connected to the RPWM an LPWM of the motor driver to
control the speed and direction of the motor. For incremental encoder, ENC A, ENC
B and SPI CLK port in MXP connector A are used. The absolute encoder in other
hand needs to be connected first to the RS-485-line driver and line receiver. This is
22
3.2 Absolute Encoder
An absolute encoder generates multi-bit digital words that indicate actual position
directly as well as its speed and direction of motion [20]. If there is power lost, the
output will always correct whenever the power is restored compared to the
incremental encoder that needs to move to the reference position [20, 21]. An
absolute encoder output can be a binary or gray code which changes only a single
bit at each time to reduce errors [20, 21].
There are two types of absolute encoder which are single turn and multi-turn
encoder [20]. Single turn can only measure up to 360° only while multi-turn encoder
can turn beyond 360° [20, 21]. In a single turn encoder, the output codes are only
limited up to 360 means that after one full revolution, the code will repeat itself again.
There is no information generates from the encoder to indicate that the encoder had
made one revolution [20]. With multi-turn encoder, the output will stay different even
23
Figure 17: SICK ARS60-A4A08192 Absolute Encoder.
SICK ARS60-A4A08192 Absolute Encoder is used in this project as shown in figure
17. This encoder has 8192 step and is a single turn encoder means that this encoder
has a resolution up to 0.005° [21].
The encoder supports Synchronous Serial Interface (SSI) that is commonly used for
point to point connection or master and slave protocol which in this case MyRIO will
serve as a master and the encoder as a slave [21]. Apart from that, the SSI used
RS-422 standard communication protocol.
Previous student uses an RS485 differential line driver “SN75LBC174A” and RS485
differential line receiver “MAX3095” to send the clock signal from the master and in
24 The encoder uses gray code to send the angle value to the Myrio. As per gray code,
one bit of data will change as the angle of the pendulum is changed. In other words,
each of the angles is unique in the gray code. Since the encoder sends the value of
the angle in gray code, a conversion from gray code to decimal value need to done
inside the program. The reason why the gray code need to be converted to the
decimal value so that the value could be less complicated and easy to read as at the
end of it, the value will be used for the controller as an input and the controller
cannot process the gray code because of its complexity. Other than that, because of
the decimal value is less complicated and easy to read, it could be useful for
troubleshooting the encoder to see if the encoder sends a correct value to the
controller.
Figure 18: Program for the absolute encoder.
Figure 18 shows the program used for absolute encoder. Noted that SPI build-in
function is used to obtain gray code from the encoder. Later, the gray code is
converted to the decimal value and divided by the number of steps the encoder has
which in this case is 8192. After that, the value can be used to convert to degree or
25 in the form of degree or radian is more useful to display at the user interface as it is
easier to read.
3.3 Incremental Encoder
The incremental encoder produces spaced pulses per revolution (PPR) in a linear
motion [20]. To use the encoder to sense the direction of the movement, quadrature
output is used with two channels 90° out of phase from each other where the
direction is determined based on the phase relation between the two outputs [20].
To determine the pendulum position, the encoder used counter to count the pulses
generated by the encoder. The count value will be loss during power shortage so
that when the power is restored, the equipment needs to be driven to the reference
point to reset the counter [20, 21]. Some encoder has a third channel called marker,
index or z channel [20].
Figure 19: Incremental Encoder Pulse Diagram [21].
The encoder used in this thesis is sharp GP1A71R which is mounted behind the DC
motor as shown in figure 20. This encoder consists of two channel A and B same as
26
Figure 20: Incremental encoder attached to the DC motor.
For incremental encoder, Myrio Labview provides an express VI for an incremental
encoder for easier implementation as shown in figure 21. After finishing setting up
the express VI, the counter value and the direction can be used later to control the
inverted pendulum.
27
3.4 DC MOTOR & MOTOR DRIVER
Figure 22: M48x60 24V KAG DC motor.
For this project, 24 V DC motor has been selected by the previous student. M48x60/I
from KAG has ability to rotate both clockwise and anti-clockwise direction [21]. This
motor also has multiple combination possibilities with gears, encoder and brakes
mean that it is possible to attach the encoder and gears used in this project. The
worm gear is used to slow down the rotational speed and fully transmit the torque.
Figure 22 above shows how the belt is connected to the motor via a toothed pulley
wheel.
Figure 23: PWM express VI.
Figure 23 shows an express VI used in this thesis to control the DC motor. The duty
28 of the motor thus we know that manipulating the duty cycle means manipulating the
speed of the inverted pendulum.
Based on the overall wiring diagram we can see that the motor is connected to the
motor driver and then the motor driver connected to the MyRIO. The motor driver
has two input for the direction which is used to drive the motor which is in forward or
backward.
Figure 24: Program for motor control.
Figure 24 shows how the motor control is achieved in this project. Noted that there is
two PWM express VI to control the speed and direction of the motor. In figure 24
also show how the PID output value is directed to each desired PWM express.
To get started, absolute value for PID is obtained because negative value cannot be
used with the PWM express only positive value is allowed. The value of the PID is
either in positive or negative depending on the error the controller calculated. For this
project, we can use the PID sign to specify which direction we want out the motor to
29
Figure 25: BTS-7960 Motor Driver.
To control the speed and direction of the motor, motor driver Bts7960 is used. BTS
7960 provide pulse width modulation (PWM) control which is very important because
in this project, pwm will be used as the process variable for the controller.
This motor driver also has a good protection circuit such as :
• Under voltage Shut Down:
To avoid the motor moves with a small voltage. For this device, if the
supply voltage is dropped under 5.4V, the motor driver will be switched
off and will not turn on until the voltage is increased to 5.5V or more.
• Over Temperature Protection:
The device is protected by an integrated temperature sensor. Over
30
3.5 Myrio
The National Instrument MyRIO controller was chosen for this project as the heart of
the inverted pendulum project. MyRIO is a portable reconfigurable I/O device that
can be used for designing a robot, system simulation and mechatronic system.
MyRIO provides analog input (AI), analog output (AO) digital input and output, audio
and power output in a single device [22]. MyRIO can be connected to the computer
via USB or wireless 802.11b,g,n [22].
Figure 5 below shows the arrangement and function of the MyRIO. MyRIO has two
main processor which is a real-time processor and Field Programmable Gate Array
(FPGA) [22]. When combining both processors, the number of Digital Input Output
(DIO) increased up to 40, eight single-ended AI, four AO, two differential AI and two
grounds respect to AO [22].
31 MyRIO has two port which is MXP A and MXP B which both having an identical pin
number, and the signal are can only be differentiated by software shown in figure 6
[22]. For example, connector A/ DIO1 and connector B/ DIO1 both using same DIO1
but only the connector is different.
Figure 27: MXP connector A and B [22].
MXP connector A and B have eight single-ended analog input in total and having
only single analog to digital converter (ADC) to sample all channels [22]. Figure 7
32
Figure 28: Analog Input Circuitry [22].
Analog output on MXP connector A and B has its own digital to analog converter
(DAC) for each channel so that MyRIO can supply data to the analog output channel
simultaneously [7]. MXP connector A and B have four total of analog output channel
which is both name AO0 and AO1 show in figure 8 above.
Figure 29: Analog output Circuitry [22].
MyRIO has 3.3V general purpose DIO line which the user can choose to program it
as a digital input or output [22]. There are 16 DIO lines per MXP connector and for
DIO line start from 0 to 13 has a 40 kΩ pullup resistor and 2.1kΩ pullup resistor for
33 (PWM) for speed control on the motor and also can be connected to quadrature
encoder input as well [22]. Figure 30 and 31 below show the architecture for DIO
lines on connector MXP A and B [22].
Figure 30: DIO lines 0 to 13 on MXP connector A and B [22].
34
4. Software & Programming
For this project, LabVIEW program considered the best tool to programming
compare to the others text based programming because of its graphical
programming environment, and easier to learn. One of the advantages that
LabVIEW have is it can communicate with thousands of device and instrument at the
same time by using it built-in function libraries to help the user to quickly obtain and
process the data [23].
Every function in LabVIEW work same as real instruments like multimeters, signal
generator or oscilloscope [8]. Because of this factor, it is called virtual instruments of
Vis. Every LabVIEW files have its own front panel, an icon pane and block diagram
[23]. The front panel serves as the platform for the user to imitate the real-world user
interface of the device [23].
In LabVIEW Vis can call other Vis called subVIs in which they are all connected and
resulted that each of the Vis can contain another Vis inside them similar to the
function call or function block with a Programmable Logic Control (PLC) or others
text-based programming language [23].
Unlike others text-based language programming such as Forth, C, Java and Visual
basic Labview utilize icons instead of a line of text to create a program [23].
LabVIEW execution control is handled by a set of rules for data flow rather than
sequentially execute the line in text-based programming [23].
Next subtopic will discuss about the two-method used to program the sequence of
this inverted pendulum system used in this thesis which is using a Statechart
35
4.1 Statechart Module
The NI LabVIEW Statechart Modules provides a programming model that proves to
be useful in designing much more complicated programming. With the help of the
LabVIEW Statechart, we can develop a graphical Statechart diagrams and set
behaviors with LabVIEW dataflow programming.
Compare to the classic way of using a state diagram method, Statechart offers some
additional features that are not available with a classical state diagram approach
such as hierarchy, concurrency and comprehensive actions [24]. Statechart also can
be used to program an event-response application and also used to implement
dynamic system controller, machine control logic and digital communication
protocols [24].
There are two steps to use LabVIEW Statechart modules [24]:
• Use Statechart Editor Window to create a Statechart.
• Create a VI that used to execute the Statechart and also sends
information to and receive information from the Statechart.
Building a Statechart consist of the following items [24]:
• States
• Entry and Exit actions
• Static reactions
• Transition between states
• Triggers
When creating a Statechart, the programmer needs to define the unique states in
which the Statechart will possibly can be. The programmer also needs to define a
36 the programmer needs to define what actions these transitions take. The
programmer also can define a trigger which the Statechart begin to execute a certain
transition. For example, imagine a Statechart used to control a chemical process.
This process only has two states which are state 1 and state 2, and a trigger is
needed to move between these two states.
States and transition also have their own associated actions, which could be used to
change the state data or output associate with the Statechart [24].
After all trigger has been assigned, in order for the Statechart to react to that trigger,
the programmer needs to send those triggers to the Statechart.
To send triggers to Statechart, another VI need to be created and known as Caller
VI. Caller VI is used to send trigger at a specific time [24]. For example, a caller VI is
designed to send a Stop trigger after stop button at the front panel is activated.
Caller VI also supplied input data to the Statechart so that the Statechart can act on
the input data and then the Caller VI will receive output data from the Statechart as a
result of a state or transition action [24]. Additionally, all the input, output and trigger
data from the Statechart could be sent and use by others VI by using a global
variable as one of the many examples to transfer data between others VI [24].
Figure 32: Run Statechart function [24].
Figure 32 above show how the caller VI send the trigger and input value to the
Statechart which in returns send back the output data to the caller VI [24]. Noted that
37 activated. Sending a trigger to the Statechart cause the Statechart to begin
executing the action that has been programmed [24].
Statechart communication function is crucial in designing a Statechart because the
function can be used to send a trigger to the Statechart and determine which state is
active at that time.
The Statechart Communication palette [24]:
• Run Statechart
• Send External Trigger
• IsIn
• Send Internal triggers
Run Statechart is used to execute the linked Statechart [24]. Send External
Trigger is used to send the external queue to be executed by Statechart [24]. This
function can be used inside the caller VI that runs parallel with the caller VI. IsIn is
used to determine whether the specified state is active [24]. This function mostly
used when designing an action for a guard. Send internal trigger is used to send
the internal queue to the Statechart [24]. This function is useful within an action or in
38 Statechart Development objects can be used to construct the Statechart [24]. The
Statechart development palette are:
1. State: is used to define the state with a unique condition in where the
Statechart will execute [24].
2. Region: Area where the programmer can put another substrate and
pseudostate [24]. Each region needs to have at least one initial pseudostate
and one substrate [24].
3. Initial: Use to initialize which state that the Statechart will execute first
when the Statechart enters the region [24]. To use this palette, create a
transition from the initial to the state that needs to be executed first. Each
region inside the state could only have one initial pseudostate only [24].
4. Terminal: Use to terminate the execution of the enclosing region [24]. To
use this palette, create a transition from a state or region to the terminal
pseudostate. When the Statechart executes the state that has terminal
pseudostate inside it, the Statechart will terminate the program.
5. Fork: Splits the incoming transition segment into multiple outgoing
segments [24].
6. Join: Merge multiple incoming transitions into one outgoing segments
[24].
7. Port: Indicate either a transition leaving a state or connector and also
39 8. ShallowHistory: Use when the Statechart leaves a region and when the
Statechart returns back to the region, the Statechart will go to the
highest-level sub-state that were active when the Statechart leaves the region at first
[24].
9. Deep History: Use when the Statechart leaves and enter the region, the
Statechart will execute the lowest-level sub-state that were active when the
Statechart leaves the region at first [24].
Statechart Editor window is used to edit and create all the logic of the Statechart.
Statechart editor window show full display of the Statechart diagram, similar to the
LabVIEW window that displays a block diagram [24].
Following ways show the difference between programming with Statechart editor
window and LabVIEW window:
1. Only Statechart Development object is allowed to use on a Statechart
diagram. No LabVIEW functions can be used directly on a Statechart diagram
[24].
40 2. The Statechart editor window used the “Generate Code” button to compile
and generate code for the Statechart while run button is used in LabVIEW
block diagram to run the program [24].
3. Statechart Editor window doesn’t have any front panel window compare to the
LabVIEW block diagram that has a front panel window [24].
4. Wiring tool is used in LabVIEW block diagram to create a wire between Vis
and function while in Statechart editor window, the wiring tool is used to
create a transition between states and other objects [24].
5. The LabVIEW block diagram provides an option for debugging the Vis while in
Statechart editor window there is no debugging option provided [24]. The only
way to debug the Statechart is to using another separate window that can be
accessed while the Statechart is running [24].
41
4.2 State Machine Programming
State machine approach in LabVIEW uses case structure and while loop to handle
the different states while programming [24]. The shift register is used to save and
move between different states.
Figure 35: Example of state machine programming [24].
Figure 35 shows an example of how to program a state machine using a LabVIEW.
While loop inside the program will repeat the execution of the case structure. The
case structure has one or more sub diagrams or cases inside the case structure. The
value wired to the selector will determine which cases need to be executed and
could be either Boolean, string or any enumerated types.
The case structure then will have as many cases as much as a number of string
wired. The shift register then will change the state at next iteration if the condition to
change to the next cases is true. Figure 35 shows that if the start-up VI is true, then
the case structure will execute the shutdown state while if the start-up VI is not true,
42 Both methods was used and tested for this thesis. Following chapter will explain in
detail how was the program were designed by using both Statechart and state
machine approach.
5. System Design & Implementation
This chapter explains about designing the sequence of the inverted pendulum
system. Each sub topic will explain more about the designing of each mode that this
inverted pendulum machine could have.
5.1 Overall Sequence
To begin with, this program is designed to make the pendulum swing until it reaches
a certain angle then the motor will stop for a while before the pendulum entering
stabilizing mode. Revise back in chapter 3 where the single turn absolute encoder is
used to measure the angle produce by the pendulum. Figure 36 shows the modes of
operation the machine could have depending on the position of the pendulum.
43 Based on figure 36 below, there are three modes when operating the SIP machine
according to the position of the pendulum pole which is swinging mode, stabilizing
mode and motor stop mode. Swinging mode happened only when the position of the
pendulum is lower than lower limit angle and should be bigger than upper limit angle.
As for stabilizing mode could be executed when the pendulum is between the lower
middle limit angle and upper middle limit angle. As the pendulum position is in
between the lower middle limit and lower limit or in between the upper middle limit
and upper limit, the SIP machine will enter the motor stop mode. Inside the motor
stop mode, the program will stop the pendulum movement by stopping the DC motor
from moving. This causes the pendulum to lose some of its energy and it is useful to
ensure a smooth transition from swinging mode to stabilizing mode. When SIP
machine undergoes the swinging mode, the pendulum position will eventually rose
up to its upright position. Note that after the pendulum almost at its upright position
or in between the lower middle limit and upper middle limit, SIP machine will change
to the stabilizing mode. Noted that the motor stop mode is sandwiched between the
stabilizing mode and swinging mode, this is because we want the pendulum to enter
the stabilizing mode as slow as it can. If the pendulum moving too fast, noted that
the stabilizing mode active region is small so the pendulum will eventually skip the
stabilizing mode and fall back to the swinging region thus making the pendulum will
44
Figure 37: State Diagram for the Inverted Pendulum Project.
Figure 37 shows the state diagram used for the SIP implementation. Noted that the
machine starts with the manual mode until someone press the start button then the
machine will go through the auto mode. Inside the manual mode, the motor will be
manually controlled by the user while in auto mode, the SIP will try to swing the
pendulum high enough to enter the stabilizing mode.
Noted that there are three modes of operation inside the auto mode which is
swing-up, stabilizing and stop mode. There is a condition to enter each mode and every
condition is different in every mode. The condition to enter the required mode can be
adjusted by the programmer to suit their project best.
45
5.2 Swing-up routine
Assume that the pendulum is at the rest position facing downward and is in the
stable equilibrium position. To stabilize the pendulum, the pendulum needs to be
brought up to the position where the stabilizing mode can activate to balance the
pendulum [25]. The on-off controller has been choosing to swing the pendulum cart
until it reaches stabilizing mode. The goal for the controller is to supply the pendulum
with energy high enough until it can reach the stabilizing mode [25].
To understand better how this idea is implemented, noted that the motor could
accelerate the pendulum back and forth and cause the pendulum to either turn in
positive or negative rotation show in figure 38.
46 For the pendulum to gain energy to swing, the pendulum cart needs to constantly
change the direction to give the pendulum energy to swing up higher. Noted that the
angle at the bottom half is divided by two which is from 0° up to the lower limit and
from upper limit up to the 360°. Imagine the motor is driven to the right thus making
the pendulum also swing to the right half of the machine and eventually the
pendulum will swing back and enter the left half of the machine. As soon as the
pendulum drop down and enter the left side of the machine, the motor will change
direction to the left thus dragging the pendulum cart in other direction causing the
pendulum swing more in the other half. This sequence is repeated until the
pendulum gets to swing high enough to enter the stabilizing mode.
In this thesis, P controller with high gain is used to implement the sequence
described above. We feed the angle as the manipulated variable (mv) and position at
the upright position which is 180° as the setpoint. The P controller will detect the
drastic changes in the angle as the pendulum swinging and thus resulting error
either positive or negative depends on which half the pendulum located. The positive
error causing the motor to go in the right direction and the negative error will
resulting the motor to go in other direction.
A normal p controller will detect this drastic changes and directing the motor to rotate
forward or backward according to the location of the pendulum. When the motor
accelerates forward or backward, the angular speed will increase until the pendulum
47
5.3 Stabilize routine
When we look back at the diagram 36, we can see that the pendulum needs to be
positioned in its upright position which means that we want the pendulum to stay at
180°. PID controller was selected to stabilize the pendulum at 180.
Figure 39: Block diagram for stabilizing the program.
Figure 28 shows how the PID controller was designed in this project. The PID
controller requires two inputs and returns one output. The setpoint, which is 0 in this
case and the latest reading from the encoder are given as an input. The output
produce from the PID controller is a Pulse Width Modulation (PWM) indicate the
speed of the motor, and the signage of the PID will indicate the direction of the
motor.
Next chapter will discuss about the result produce after the sequence of the modes
48
6. Results
This section show the result and performance of the SIP system followed by a
discussion about the result that have been obtained. The results were logged from
MyRIO and plotted using an excel. The following section will explain about the result
from using two method which is state machine design and Statechart.
6.1 State machine
In State machine design, four types of controller have been tested which is P, PI,
PID and PD controller. The execution loop in the program is set to the fastest
because we want the graph to resemble the same response as that of a continuous
time. Based on the data logging, we know that the SIP is sampled at 1ms rate which
is fast enough for the system to resemble the continuous time. Because the system
can be sampled at high speed, we can ignore the delay in our system.
Figure 40: P controller with gain 2.5.
Figure 40 shows the behavior of the angle and PWM signal in a function of time
when the auto mode use P controller to stabilize the pendulum. From the figure
above, the orange data represent the angle of the pendulum while the blue data
49 represents the highest reading of the angle which is 360° while the lowest reading in
angle represents 0°. The goal here is to maintain the angle to be at zero which in this
case, the pendulum located at its upright position which is 180°. PWM signal in other
hand is scale from 1 to -1. 1 indicate the motor drive in a forward position at high
speed while -1 indicate the motor drive in reverse position in a high speed. The
x-axis represents time that the SIP operates before the pendulum hit the edge of the
track.
The pendulum is at the rest position before the auto program is executed. Noted that
because of the pendulum at the rest position, the swing mode is activated to swing
the pendulum high enough to enter the stabilizing mode. In the beginning, from the
graph we know that the pendulum stays within the swing mode before the pendulum
frequently changing state between the stop and swing mode. After the pendulum has
been swing high enough to kick in the stabilizing mode, P controller will try to
stabilize the pendulum in upright position.
Noted that in figure 40, the pendulum can only be balanced about 3 to 4 second
before it hit the edge of the track. This is simply because the controller couldn’t
eliminate the error produce by the pendulum. What the error means in this thesis is
that which way the pendulum tends to move is. If the pendulum moves in the right
positions means that the error is positive and if the pendulum moves oppositely, the
controller can be said having a negative error. Noted that the motor is already driven
up to its maximum speed which is one but the error still couldn’t be eliminate causing
50
Figure 41: PI controller with four as a gain and 0.005 integral value.
Figure 41 shows the pendulum angle and PWM when using a PI controller. We could
see that the balance time is not improved when using a PI controller plus by
increasing the integral value, the performance of the P will decrease resulting the
motor to react slower compare to P controller.
51
Figure 43: PID Controller with gain 4, Integral 0.1 and 0.01 Derivative value.
Figure 42 and 43 show the machine performance when using PD and PID controller.
Both controllers behave similarly in stabilizing mode where the output fluctuates
between the maximum and minimum value. The effect of the derivative value use in
the controller causes the noise at the motor to amplify and causing the motor to
oscillate back and forth at high speed. While operating the system, sudden minor
changes in the angle of the pendulum led to large PID outputs
As a result, both PD and PID controller couldn’t stabilize the pendulum at its upright
position. Furthermore, because of the motor frequently changing the direction at high
speed causing the mechanical system in SIP system vibrating. This is not good as
such a vibration can reduce the lifespan of the motor.
Advanced PID used in the software enables the user to filter out the noise using the
software. In this case, alpha and gamma value for the PID controller is changed to
filter the noise. Alpha represents the derivative filter time constant while the gamma
52 Even though the value were changed, the noise still happens. This requires some
hardware insulation to minimise the noise.
6.2 Statechart
Same step use for the Statechart where the pendulum starts at the rest position and
will execute the swing up mode. Apparently, there have been some instance where
instead of swinging up to the upright position, the pendulum is eventually swinging
left and right without building up more energy to swing higher as shown in figure 44
below.
Figure 44: Swing up controller with 25% duty cycle.
Figure 44 above show that the pendulum’s angle is increasing until 20th second
where the pendulum swings back and forth at the same amplitude without creating
53 25% duty cycle as a state design to swing up the pendulum, the pendulum still
couldn’t able to reach high enough to kick in the stabilizing mode.
The duty cycle then was increased up to 70% show in figure 45 above.
Figure 45: Swing up controller with 80% duty cycle.
After increasing the duty cycle, the pendulum cart now moves faster than before
causing the pendulum to gain more energy. The pendulum successfully driven to the
stabilizing mode. Noted that after the pendulum enters the stop mode, the pendulum
lost energy during that time. As a result, the pendulum having some difficulties to
swing the pendulum up to the stabilizing region. Eventually, based on figure 45, the
controller managed to push the pendulum up to the stabilizing point around 45th
second.
After the pendulum managed to get into the stabilizing region, the stabilizing
controller in other hand couldn’t be able to balance the pendulum at all. This is
because the controller takes a late action to stabilize the pendulum due to the big
54 All type of controller used in state machine design is tested and none of them can
balance the pendulum at its upright position.
The only problem that the Statechart have compared to state machine design is that
the Statechart is sampled at 100ms compare to the state machine design where it
sampled at 1ms. If we observe the state machine design graph we can see that the
graph is thicker than Statechart design means that the state machine design collect
more data per second compare to Statechart design. This huge difference in
sampled time resulting the Statechart adding a delay element inside the SIP system.
This is because to run the Statechart, caller VI need to be created first. After caller VI
has been created, the caller VI will run and execute the Statechart. The problem is
that because the caller VI need to run simultaneously with Statechart diagram
causing overload to the MyRIO as the MyRIO need to run multiple VI at the same
time and thus slowing the execution rate. Even though we already set the execution
55
7. Summary
Overall, the project can be considered as a success because all the objectives have
been achieved in this thesis. Despite the fact that the pendulum can only be stabilize
up to 3s before the pendulum cart hit the end of the rail. This is due to the finite
length of the track and the motor is not fast enough to compensate for the error. The
derivative value on the other hand amplifies the noise thus making the motor to drive
at full speed and constantly changing direction. As a result, PD and PID controller is
not considered the best solution to implement inside the stabilizing mode. P
controller is much more suitable to use in this project because of its fast response
and no derivative value inside the controller thus the controller doesn’t amplify the
noise in the system.
Secondly, both Statechart and state machine design method were developed to
cooperate with the SIP machine. State machine design doesn’t cause any problem
to the SIP system because the execution loop run is fast. While Statechart in order
hand causing the system to have delay. This causes the system to lose energy as
indicated in figure 45. The reason why the pendulum lost the energy is that the
controller takes a late action to correct the error made by the pendulum. This cause
for example in swinging mode the motor was late to change the direction of the
pendulum cart resulting the pendulum to lost energy during the swing up routine. Big
sample rate can affect the swing up mode and also heavily affects the stabilizing
mode. Imagine the pendulum is already in the stabilizing region but because of the
big sample time, the program late to switch the controller from the swing up the
controller to stabilizing controller. By the time the program enters the stabilizing
56 machine and its already too late to the controller to balance the pendulum at its
upright position.
7.1 Future Work/ Recommendation
While operating the SIP project, there are plenty of the future can be done by the
future student to achieve a better result. The following is a recommendation for the
future student who decides to continue developing this SIP system:
1. Use high torque DC motor.
The most physical hardware that needs an upgrade in this system is the DC
motor. DC motor used in this thesis is not strong enough to eliminate the error
causing the pendulum. By having a high torque motor, the pendulum can be
move fast enough to reduce the error.
2. Implement a cascade controller to control the position of the pendulum.
In this thesis, the position of the pendulum cart is not taken into consideration.
By having a cascade controller, P controller can be used inside the inner loop
where the inner loop will try to balance the pendulum and the outer loop will
try to position the pendulum cart at the desired position.
3. Implement the controller in Field Programming Gate Array (FPGA)
Myrio used in this project comes with the build in FPGA. FPGA can be used
as a platform because it offers some superior qualities over traditional
![Figure 1: Free Body Diagram of the inverted pendulum system [1].](https://thumb-us.123doks.com/thumbv2/123dok_us/9631270.1945209/10.595.208.403.234.385/figure-free-body-diagram-inverted-pendulum.webp)
![Figure 2: SEGWAY HT [3].](https://thumb-us.123doks.com/thumbv2/123dok_us/9631270.1945209/11.595.242.347.162.339/figure-segway-ht.webp)
![Figure 4: Free Body Diagram of the inverted pendulum [1].](https://thumb-us.123doks.com/thumbv2/123dok_us/9631270.1945209/13.595.129.467.320.523/figure-free-body-diagram-inverted-pendulum.webp)
![Figure 6: Servo motor [8].](https://thumb-us.123doks.com/thumbv2/123dok_us/9631270.1945209/19.595.230.364.87.211/figure-servo-motor.webp)
![Figure 11: Inverted Pendulum with Servo Pneumatic by Enfield Technologies [14].](https://thumb-us.123doks.com/thumbv2/123dok_us/9631270.1945209/21.595.171.425.69.262/figure-inverted-pendulum-servo-pneumatic-enfield-technologies.webp)
![Figure 13: Multi-turn potentiometer [17].](https://thumb-us.123doks.com/thumbv2/123dok_us/9631270.1945209/22.595.222.378.194.351/figure-multi-turn-potentiometer.webp)
![Figure 14: Ultrasonic Sensor HC-SR04 [18].](https://thumb-us.123doks.com/thumbv2/123dok_us/9631270.1945209/23.595.214.384.226.343/figure-ultrasonic-sensor-hc-sr.webp)