UNIVERSITY OF TRENTO
International PhD Program in Biomolecular Sciences
30
thCycle
“Cell-free expression systems for the construction
of artificial cells”
Tutor
Professor Sheref S. Mansy Cibio – University of Trento
Ph.D. Thesis of
Giuliano Berloffa CIBIO – University of Trento
Abstract
Contents
Introduction ... 6
Chapter 1.
Homemade cell-free expression systems ... 8
1.1. Introduction ... 8
Cell-free protein synthesis for the construction of artificial cells ... 11
1.2. Results ... 12
T7 RNA polymerase cloning, purification and test ... 12
E. coli RNA polymerase, σ70 purification and test ... 14
PURE factors purification ... 17
Church Factors purification ... 20
Homemade PURE system (Church) reaction ... 21
TrpR transcription regulation in the homemade PURE system (Church) ... 22
S30 Crude Extract preparation and transcription-translation reaction ... 23
1.3. Discussion ... 25
1.4. Materials and Methods ... 28
E. coli chemically competent cells preparation ... 28
Transformation of E. coli chemically competent cells ... 28
PURE Components purification ... 28
PURE system cell-free protein synthesis ... 29
Church Factors purification ... 30
Church PURE system cell-free protein synthesis ... 31
Gibson Assembly ... 31
T7 RNA polymerase cloning, overexpression and purification ... 32
T7 RNA polymerase transcription ... 33
E. coli RNA polymerase core enzyme purification ... 33
σ70 transcription factor purification ... 34
E. coli RNA polymerase holoenzyme in vitro transcription reaction ... 35
His-tagged 70S ribosomes purification ... 36
SDS-PAGE ... 36
RNA agarose gel ... 37
S30 Crude Extract preparation ... 37
S30 in vitro protein synthesis reaction ... 38
Buffers table ... 38
1.5. References ... 41
Chapter 2.
Cell-free transcription is more variable than translation ... 44
2.1. Introduction ... 44
2.2. Results ... 45
Variability of RNA and protein levels in an E. coli cell-free extract ... 45
Influence of RNA folding on transcription-translation ... 46
2.3. Discussion ... 49
2.4. Materials and methods ... 50
S30 Extract cell-free transcription-translation ... 50
2.5. References ... 52
Chapter 3.
Towards artificial cells networks ... 53
3.1. Introduction ... 53
3.2. Results ... 57
In vitro screening of liposomes permeabilization ... 57
E. coli 3OC6-HSL-induced death ... 59
In vivo permeabilization of calcein vesicles ... 61
3.3. Discussion ... 63
3.4. Materials and methods ... 66
Preparation of calcein liposomes ... 66
3.5. References ... 67
Chapter 4.
A microfluidic dialysis chip for synthetic biology ... 68
4.1. Introduction ... 68
Microfluidics ... 68
PDMS ... 70
Cell-free protein synthesis in microfluidics compartments ... 72
4.2. Results ... 74
Polypropylene chip preparation and dialysis chip mounting ... 74
Polypropylene chip loading ... 78
E. coli 3OC6 HSL in vivo communication ... 79
In chip 3OC6-HSL E. coli communication ... 81
S30 E. coli Extract3OC6 HSL in vitro communication ... 82
In chip 3OC6-HSL S30 communication ... 82
4.3. Discussion ... 84
4.4. Materials and methods ... 86
Mask design and silicon mold fabrication ... 86
PDMS chip casting and preparation ... 89
Polypropylene chip printing and preparation ... 90
Dialysis chip assembly ... 91
Storage layer loading ... 91
Dialysis chip in vivo 3OC6-HSL sending and receiving ... 92
4.5. References ... 94
Conclusions and future perspectives ... 96
Appendix ... 99
Plasmid constructs table ... 99
Peer-reviewed Publication ... 99
Manuscript in preparation ... 99
Introduction
The regulation and control of living systems behavior have always represented a major concern and interest for mankind. Some of the most crucial steps in the development of modern society are due to the successful control of biological entities neighboring the human beings, see the outbreak of agriculture and livestock breeding. More sophisticated techniques for the control of living systems have evolved together with the increase of knowledge of the systems themselves. As an example, understanding how plants work allowed to develop grafting procedures for the creation of more productive and resistant cultivars and crossbreeding was introduced to obtain the same result for livestock.
information about the function of the system, usually encoded into nucleic acids, iii) a machinery that can interpret the information and translate it into a desired output.
This work focuses on cell-free protein expression systems which may constitute the interior machinery of artificial cells. Cell-free protein expression systems can be prepared in different ways and can be based on diverse host organism but share the common feature of lacking the host genetic information. The desired function can be given to an artificial cell by encapsulating cell-free protein expression system provided with a specific template, thus allowing for the synthesis of one or more desired proteins.
Chapter 1.
Homemade cell-free expression systems
1.1.
Introduction
One of the most important discoveries in molecular biology was that lysates from shredded bacteria or cells could still provide evidences of occurring protein synthesis. Rapidly, cell-free or in vitro protein synthesis systems were developed by removal of the heavier components by centrifugation at 30,000 xg, the S30 Extracts.
The first reports of cell-free protein synthesis were mainly studies of the mechanisms at the core of translation. The investigation of how amino acids are incorporated into nascent polypeptides was indeed tackled in the early 50s and mostly featured cell-free expression systems based on different organisms. Among the others, systems based on rat liver cells1, bacteria2,3, human and rabbit reticulocites4,5 allowed for the discovery of the key role of ribosomes and the ATP- and GTP-dependent operation of protein synthesis6,7. At that time, designing protein expression experiments with cell-free systems was more appealing than working in vivo, as recombinant DNA technologies and genetic engineering protocols were not available until some decades later8,9. One of the most remarkable achievements using cell-free expression systems was the finding of amino acids codification in nucleotide triplets. In 1961 Nirenberg and Matthaei, awarded with the Nobel Prize in Medicine a few years later, demonstrated cell-free synthesis of polyphenylalanine from synthetic polyuridylic acid in the E. coli extract10. Described in this work there is also one of the first reports of translation of exogenous message after the removal of all endogenous mRNA.
of procedures, another major step was taken towards more efficient in vitro systems. The introduction of coupled transcription-translation cell-free systems allowed to prime the protein production reaction with DNA, rather than using mRNA15. This breakthrough not only simplified the protocol, bypassing the initial in vitro transcription step, but also opened new possibilities for the study of gene regulation.
Innovation continued with the introduction of heterologous systems which combined the high processivity of bacteriophage RNA polymerases with the previously mentioned translation machineries. SP6 RNA polymerase and T7 RNA polymerase16,17 were employed for driving the specific transcription of genes placed behind the correspondent promoter with several advantages. In bacteria-based extract, the selective inhibition of endogenous RNA polymerase by the addition of rifampicin18 allows for highly selective expression of the protein of interest. Moreover, the mRNA levels provided by phage RNA polymerases are higher than the ones obtained with endogenous polymerases19.
In 2001, the issues related to inhibitory factors and residual synthesis of non-specific endogenous proteins were addressed by the Ueda group with the creation of the PURE system (Protein synthesis Using Recombinant Elements)20. The PURE system features i) the full set of components required for efficient protein synthesis i.e the 20 tRNA synthetases (ARSs), 3 translation initiation factors (IF1, IF2, and IF3), 3 translation elongation factors (EF-G, EF-Tu, and EFTs), 3 translation termination factors (RF1, RF2, and RF3), methionyl-tRNA transformylase (MTF), T7 RNA polymerase, and ribosomes; ii) the substrate molecules needed for efficient transcription and translation reactions to occur i.e. 46 transfer RNAs (tRNAs), ribonucleotides (NTPs), 10-formyl-5,6,7,8-tetrahydrofolic acid (folinic acid) and 20 amino acids; iii) an energy storage system based on ATP regeneration and side products disposal i.e. creatine phosphate, creatine kinase, myokinase, nucleoside-diphosphate kinase, and pyrophosphatase.
ribosome display23,24. The highly controlled content of the system allows also for its customization for the expression of proteins which require particular folding conditions. The addition of glutathione, disulfide isomerase and chaperons to the system specifically meant for protein disulfide bonds enhancement21,25 whereas the implementation with membrane integration/translocation systems led to the successful expression and folding of integral membrane proteins26. Another well-covered advantage in using the PURE system is the possibility to omit one of the release factors (RF1) for the incorporation of un-natural amino acids at specific amber codon sites (UAG) using chemically mis-acylated suppressor tRNA20,27–29.
Cell-free protein synthesis for the construction of artificial cells
Cell-free protein synthesis is the natural starting point for any bottom-up approach to the creation of an artificial cell as opposed. Indeed, a large part of the essential genes believed to be sufficient for the sustainment of a living bacterium are involved in protein synthesis36. Although a completely bottom-up viable artificial cell has not yet been delivered, cell-free protein synthesis has successfully been performed in phospholipid vesicles37,38 and water-in-oil droplets39 also to establish working communication with natural and engineered cells40,41. In light of the key role of cell-free protein systems in powering the first functioning synthetic cell entities, it becomes clear how the study and development of these tools are essential for bottom-up reconstruction of the minimal cell42,43. Numerical modelling approaches has also been shown to provide a valuable resource for the characterization of compartmentalization efficiency44 and cell-free transcription-translation systems output45.
1.2.
Results
To obtain more flexibility on template choice and transcription-translation levels in the reconstituted PURE system, both T7 and E. coli RNA polymerases were purified. Indeed, T7 RNA polymerase is well known for its high processivity and efficiency, while E. coli RNA polymerase can drive transcription from a wide set of promoters with different levels of activity.
T7 RNA polymerase cloning, purification and test
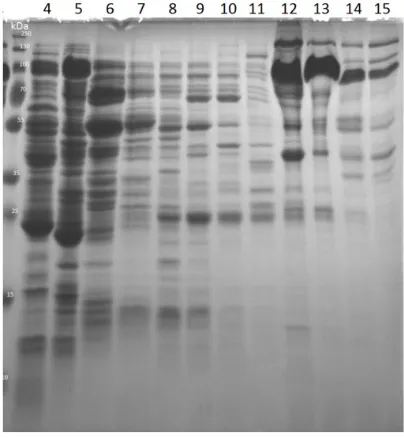
Figure 1. His-tagged T7 RNA polymerase Ni++ affinity chromatography
purification SDS-PAGE. Lane 1: PageRuler Plus Protein Ladder (Thermo Fisher Scientific); lane 2: flow through; lane 3: wash; lanes 4 through 15: elution fractions 5 through 16. His-tagged T7 RNA polymerase expected mass is 100 kDa. Pooled fractions: 8 through 13.
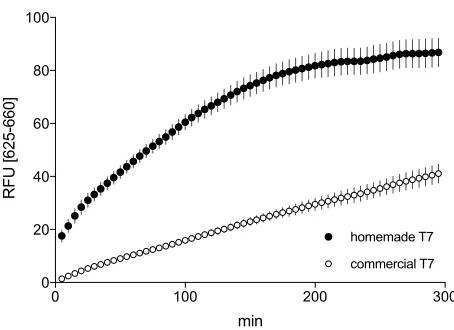
Figure 2. T7 RNA polymerase activity test. His-tagged T7 RNA polymerase function was tested in an in vitro transcription reaction using FC001A plasmid as template. FC001A carries malachite green aptamer coding sequence under transcription regulation of T7 promoter. Commercial T7 RNA polymerase (New England Biolabs) was used as a positive control. RNA polymerase amount used in the in vitro reaction was 1/10 of the reaction volume as recommended in commercial T7 manual. Reactions were run in duplicate at 37 °C and malachite green fluorescence data was acquired with Rotor-Gene Q 6plex (Qiagen) (excitation: 625±5 nm; emission: 660±10 nm)
0 100 200 300
0 20 40 60 80 100
min
RFU [625-660]
homemade T7
The preparation of T7 RNA polymerase yielded a sub-homogeneous stock. The purified His-tagged protein seemed more efficient compared to the commercial T7 RNA polymerase, using the malachite green aptamer detection system. In fact, using the same amount of enzyme recommended by the manufacturer, fluorescence was 2-fold higher.
E. coli RNA polymerase, σ70 purification and test
E. coli RNA polymerase and σ70 were overexpressed and purified to be reconstituted in the homemade PURE system in order to drive the transcription of genes under the regulation of constitutive E. coli promoter or different promoters recognized by E. coli RNA polymerase, such as T5 promoter.
His-tagged E. coli RNA polymerase core enzyme was prepared in three purification steps. First by benchtop Ni++ affinity chromatography, then by Heparin affinity chromatography and finally by ion-exchange chromatography using Äkta FPLC (GE Healthcare). SDS-PAGE was run to assess the content of elution fractions after each purification step. In particular elution fractions of ion-exchange chromatography are shown in Figure 3.
SDS-PAGE shows that the three purification steps allowed for a quasi-homogeneous preparation of E. coli RNA polymerase core enzyme.
His-tagged σ70transcription factorwas prepared in two purification steps. First by benchtop Ni++ affinity chromatography then by ion-exchange chromatography using Äkta FPLC (GE Healthcare). SDS-PAGE was run to assess the content of elution fractions after each purification step. In particular elution fractions of ion-exchange chromatography are shown in Figure 4.
Figure 4. His-tagged σ70 transcription factor ion exchange chromatography
purification SDS-PAGE. Lane 1: PageRuler Plus Protein Ladder (Thermo Fisher Scientific); lanes 2 through 13: elution fractions 4 through 15. His-tagged σ70
transcription factor has expected mass of: 36.5 kDa (α), 150.6 kDa (β), 155.1 kDa (β’), 10.2 kDa (ω). Pooled fractions: 12 through 14.
SDS-PAGE shows that the two purification steps yielded a sub-homogeneous stock of σ70 transcription factor.
carries the MGA sequence located in a bigger aptamer, called pRNA, which is specifically designed for enhancing and protecting the structure of the hosted aptamers45. By testing various concentrations and combinations of the core enzyme and σ70 factor, it was possible to determine the best performing ratio of the core to σ70 factor to be 1:2.5. Optimal working concentrations are shown in Table 1. In this condition, the reconstituted E. coli RNA holoenzyme performed better in in vitro transcription reaction compared to the commercial one (Figure 5a). Moreover, the pRNA scaffold seems to increase transcription efficiency only in the presence of the homemade polymerase (Figure 5b).
Figure 5. E. coli RNA polymerase activity test. His-tagged E. coli RNA polymerase holoenzyme function was tested by in vitro transcription of MGA (solid traces) and compared to commercial E. coli RNA polymerase (New England Biolabs) (dotted line). Plasmid templates used for the reaction were a) DC129A and b) GB008A. Both the plasmids have the E. coli constitutive promoter pTac regulating the transcription of RFP coding sequence followed by MGA coding sequence. Whereas DC129A features a simple MGA sequence, GB008A allows for the transcription of MGA as part of the pRNA scaffold which secondary structure was designed to improve aptamers folding. Reactions were run in duplicate at 37 °C and malachite green fluorescence was monitored using Rotor-Gene Q 6plex (Qiagen) (excitation: 625±5 nm; emission: 660±10 nm).
0 2 4 6 8 10
0 20 40 60
hours
RFU [625-660]
a)
0 2 4 6 8 10
0 20 40 60
hours
RFU [625-660]
Mass Stock Working conc.
E. coli RNA polymerase
core enzyme ~ 390 kDa [2x α, ß, ß' and ω] 2.3 µM 126 nM σ70 transcription factor ~ 70 kDa [σ] 15.6 µM 311 nM
Table 1. E. coli RNA polymerase core enzyme reconstitution. Different concentrations were tested for both the core enzyme and the transcription factor. Reported are the working concentrations used in the in vitro transcription reaction in Figure 5.
PURE factors purification
Translation factors and tRNA synthetases were purified to reconstitute the factors mix of the homemade PURE system together with the purchased enzymes responsible for ATP regeneration.
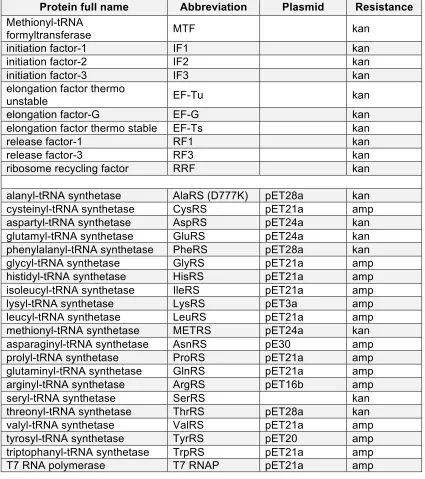
Protein full name Abbreviation Plasmid Resistance
Methionyl-tRNA
formyltransferase MTF kan
initiation factor-1 IF1 kan
initiation factor-2 IF2 kan
initiation factor-3 IF3 kan
elongation factor thermo
unstable EF-Tu kan
elongation factor-G EF-G kan
elongation factor thermo stable EF-Ts kan
release factor-1 RF1 kan
release factor-3 RF3 kan
ribosome recycling factor RRF kan
alanyl-tRNA synthetase AlaRS (D777K) pET28a kan
cysteinyl-tRNA synthetase CysRS pET21a amp
aspartyl-tRNA synthetase AspRS pET24a kan
glutamyl-tRNA synthetase GluRS pET24a kan
phenylalanyl-tRNA synthetase PheRS pET28a kan
glycyl-tRNA synthetase GlyRS pET21a amp
histidyl-tRNA synthetase HisRS pET21a amp
isoleucyl-tRNA synthetase IleRS pET21a amp
lysyl-tRNA synthetase LysRS pET3a amp
leucyl-tRNA synthetase LeuRS pET21a amp
methionyl-tRNA synthetase METRS pET24a kan
asparaginyl-tRNA synthetase AsnRS pE30 amp
prolyl-tRNA synthetase ProRS pET21a amp
glutaminyl-tRNA synthetase GlnRS pET21a amp
arginyl-tRNA synthetase ArgRS pET16b amp
seryl-tRNA synthetase SerRS kan
threonyl-tRNA synthetase ThrRS pET28a kan
valyl-tRNA synthetase ValRS pET21a amp
tyrosyl-tRNA synthetase TyrRS pET20 amp
triptophanyl-tRNA synthetase TrpRS pET21a amp
T7 RNA polymerase T7 RNAP pET21a amp
Figure 6. Purification of translation factors and tRNA synthetases. On the left, the SDS-PAGES with samples from the translation factors purified stocks. From left to right: PageRuler Plus Protein Ladder (Thermo Fisher Scientific), IF1 (8.1 kDa), IF2 (97.3 kDa), IF3 (20.4 kDa), G (77.5 kDa), Tu (43.3 kDa), Ts (31 kDa), EF-Ts from another purification (31 kDa), RF1 (39.6 kDa), RF3 (58.2 kDa), RRF (20.3 kDa), MTF (35 kDa). On the right, the SDS-PAGE with elution fractions samples from Glu-rRNA synthetase (52 kDa) purification.
In most cases, the benchtop purifications of the translation yielded a good amount of protein with a good grade of homogeneity. Some proteins showed a running pattern different from the expected one. The purified tRNA synthetases not always were expressed optimally, an example is Glu-tRNA synthetase as shown in Figure 6b. In some cases, the product of more purifications had to be pooled to reach a concentrated stock.
Church Factors purification
The six protein pools were prepared to verify the possibility to reconstitute a homemade PURE system with a significantly faster protocol. The number of purifications to be carried out using this approach are 5-fold less compared to the classical PURE system preparation35.
Engineered E. coli strains purifications allowed for the preparation of 6 protein pools. Each strain was grown and the protein pools purified by benchtop Ni++ affinity chromatography, being all His-tagged. The protein content of each stock was verified by SDS-PAGE (Figure 7). The contents of the individual pools are reported in Table 3.
E. coli strain His-tagged factors
IEF EF-Ts, EF-G, EF-Tu(a), EF-Tu(b), EF4, IF1, IF2, IF3
RF RRF, RF1, RF2, RF3
RS1 Ile-tRNA Synthetase, Pro-tRNA Synthetase, Cys-tRNA Synthetase, Leu-tRNA Synthetase, Gln-tRNA Synthetase, Ser-tRNA Synthetase
RS2 Asn-tRNA Synthetase, Tyr-tRNA Synthetase, Phe-tRNA Synthetase A, Phe-tRNA Synthetase B,Thr-tRNA Synthetase, Asp-tRNA Synthetase
RS3 Arg-tRNA Synthetase, Met-tRNA Synthetase, Glu-tRNA Synthetase, His-tRNA Synthetase, Ala-tRNA Synthetase, Lys-tRNA Synthetase
RS4 Met-tRNA Formyltransferase, Trp-tRNA Synthetase, Gly-tRNA Synthetase A, Gly-tRNA Synthetase B, Val-tRNA Synthetase
Table 3. Church strains His-tagged components. The genome of each strain was engineered by Church and colleagues in order to constitutively express a set of His-tagged components.
The purified component pools contained all the relative His-tagged proteins. A set of recurring unwanted bands can be observed among the pools, but the concentration of such protein contaminants is low and tolerable.
Homemade PURE system (Church) reaction
Figure 8. Homemade PURE system in vitro expression of RFP-spinach. Homemade PURE reaction was templated with DC032A plasmid providing the coding sequences of RFP and spinach aptamer under the transcriptional regulation of T7 promoter. Showed are real time fluorescence data relative to a) RNA and b) protein. Reactions were run in duplicate at 37 °C and fluorescence was monitored using Rotor-Gene Q 6plex (Qiagen). DFHBI fluorescence was acquired with the green channel (excitation: 470 ± 10 nm; emission: 510 ± 5 nm). RFP fluorescence was acquired with the orange channel (excitation: 585±5 nm; emission: 610±5nm).
The homemade PURE system works well both in transcription, monitored via spinach aptamer binding to DFHBI (Figure 8a), and translation, observed from RFP production (Figure 8b). However, even though the homemade T7 RNA polymerase was very well performing as shown above, the whole homemade PURE reaction is not as efficient as the commercial one (data not shown).
TrpR transcription regulation in the homemade PURE system (Church)
To assess whether simple transcriptional control could be reconstituted in the homemade PURE system, tryptophan repressor (TrpR) activity was tested in an in vitro transcription-translation reaction (Figure 9). Two different homemade PURE reactions were run using DC032A plasmid (described above) or DC076A as templates. DC076A differs from DC032A for the presence of the tryptophan operator sequence (trpO) downstream the T7 promoter controlling RFP expression. Moreover, a pT7-TrpR sequence is cloned downstream of the RFP-spinach sequence, so that TrpR is synthesized as well. The
0 100 200 300 400
0 2 4 6 8 min RFU [470-510] a)
0 100 200 300 400
expression of RFP-spinach should be repressed in DC076A-templated reaction as a result of TrpR binding to trpO.
Figure 9. TrpR transcriptional regulation of RFP expression in homemade PURE system. Homemade PURE reactions were templated by plasmid vectors DC032A (non-repressed, black circles) and DC076A (repressed, white circles). Showed are real-rime fluorescence data relative to a) RNA and b) protein. DC032A has T7 promoter driving the expression of RFP and spinach aptamer. DC076A has in addition the pT7-TrpR sequence and trpO element downstream the T7 promoter driving RFP expression. When using DC076A as template, synthesized TrpR should block transcription of RFP. Reactions were run in duplicate at 37 °C and fluorescence was monitored using Rotor-Gene Q 6plex (Qiagen). DFHBI fluorescence was acquired with the green channel (excitation: 470 ± 10 nm; emission: 510 ± 5 nm). RFP fluorescence was acquired with the orange channel (excitation: 585±5 nm; emission: 610±5nm).
Tryptophan is already present in the PURE system reaction being one of the amino acids provided for protein synthesis. Therefore, TrpR, once synthesized, binds the available tryptophan and represses RFP-spinach transcription. Repression is not total, as shown by the RNA traces in Figure 9a, probably because some transcription of RFP-spinach was already started before trpR synthesis and activation.
S30 Crude Extract preparation and transcription-translation reaction
S30 Crude Extract yield was approximately 1 mL per liter of culture. S30 in vitro transcription-translation control reaction was performed using the plasmid FC045A as
0 100 200 300
0 2 4 6 8 min RFU [470-510] non-repressed repressed a)
0 100 200 300
template. The plasmid template carries RFP coding sequence behind the T5 promoter, recognized by endogenous E. coli RNA polymerase.
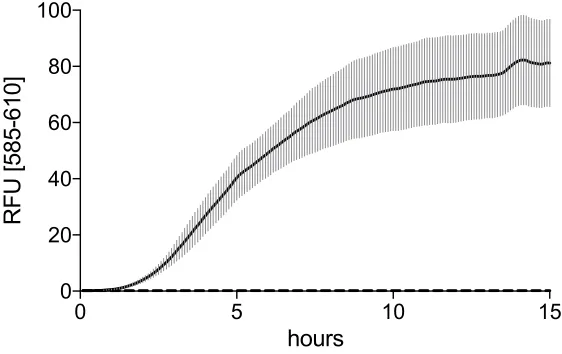
Figure 10. S30 Extract in vitro synthesis of RFP. S30 cell-free protein expression was tested using FC045A plasmid template allowing for the E. coli RNA polymerase-dependent expression of RFP. Reactions were run in duplicate at 37 °C and fluorescence was monitored using Rotor-Gene Q 6plex (Qiagen). RFP fluorescence was acquired with the orange channel (excitation: 585±5 nm; emission: 610±5nm).
0 5 10 15
0 20 40 60 80 100
hours
1.3.
Discussion
The aim of this study was to reconstitute an in vitro transcription-translation system comparable to the commercially available ones to be used for synthetic biology applications. The classic preparation of the homemade PURE led to a non-functioning system. The simplified procedure for assembling the PURE led to a poorly performing system which activity was very low when compared to the commercial kit. The S30 E. coli Extract is performing the best. Moreover, the procedure to prepare the S30 Crude Extract is relatively quick, robust and reproducible even if not trivial and in some parts delicate.
The RNA polymerases were tested for transcription activity and compared to their commercial counterparts. To monitor RNA traces in real time, aptamers were used that bind fluorophores enhancing their quantum yield. T7 RNA polymerase performed better than commercial polymerase when the same amount was used for transcription, meaning that the purified stock was characterized by a higher U/µL count. E. coli RNA polymerase core enzyme and σ70transcription factor were mixed in an in vitro transcription reaction to reconstitute the RNA polymerase holoenzyme. After testing different ratios between the two purified components, the optimal reaction concentrations observed were 126 nM and 311 nM for the core enzyme and the σ70 transcription factor, respectively. These concentrations are consistent with the fact that specific and efficient RNA synthesis from bacterial and phage promoters is achieved when the core enzyme is saturated with σ70 transcription factor. Purified E. coli RNA polymerase holoenzyme was performing better than the commercial holoenzyme. When testing in vitro transcription with E. coli RNA polymerase holoenzyme, the pRNA scaffold influence on malachite green aptamer activity was assessed. The transcription product of pRNA is reported to fold into a secondary structure that increases the stability and folding of up to three aptamers inserted into its loops. Malachite green aptamer was cloned into one of the pRNA loops and this setting was compared to the simple malachite green aptamer. Results show that pRNA is actually enhancing the folding of malachite green aptamer even if the effect is observed only when considerable amounts of RNA are produced. When the homemade PURE system was assembled, only T7 RNA polymerase transcription activity was observed. Translation of reporter fluorescent protein was not detectable. This was probably due to one or more inactive translation factor and/or tRNA synthetase.
1.4.
Materials and Methods
E. coli chemically competent cells preparation
This experimental procedure was adopted for every E. coli strain used. E. coli cells were scraped from glycerol stock and grown o/n at 37 °C, 220 rpm. On the next day, cells were diluted 1:100 in 50 mL of LB and incubated again at 37 °C, 220 rpm. When OD600 nm = 0.5 was reached, the culture was chilled on ice for 10 min. Cells were harvested by 10 min centrifugation at 5,000 xg at 4 °C. Supernatant was discarded and the pellet re-suspended in 15 mL of Transformation buffer and incubated on ice for 15 minutes. Cells were harvested and re-suspended in 4 mL of Transformation buffer. Glycerol was added to final concentration of 20% v/v. Competent cells were aliquoted into 100 µL aliquots, flash frozen with liquid nitrogen and stored at -80 °C.
Transformation of E. coli chemically competent cells
This experimental procedure was adopted for every E. coli strain used. Chemically competent E. coli cells were thawed on ice and added with 10-50 ng of plasmid DNA and incubated on ice for 20 min. Heat shock was performed by incubating cells at 42 °C for 1 min. Cells were placed on ice again for 10 min. Cells were recovered by addition of 800 µL of LB and incubation at 37 °C for 45 min, 220 rpm. 50 µL from recovered culture were spread onto LB agar plates added with antibiotic.
Note: PURE system plasmids for the overexpression and purification of tRNA synthetases were provided by Professor Florian Seebeck (University of Basel)
PURE Components purification
IPTG and grown for 4 additional hours. Cells were harvested by centrifugation at 5,000 xg at 4 °C, 20 min. Pellets were resuspended in 100 mL PURE Resuspension buffer supplemented with PMSF protease inhibitor to 1 mM final concentration. Bacteria were lysed on ice with 8 cycles of sonication 15 seconds ON / 45 seconds OFF using Analog Sonifier Cell Disruptor (Branson) output 60%. Lysate was clarified by centrifugation at 17,000 xg 4 °C, 30 min, twice and residual debris removed by 0.22 µm filtration.
Each purification was performed with 10 mL Ni-NTA agarose matrix (QIAGEN). Ni-NTA agarose matrix was regenerated in between each protein purification to ensure the removal of contaminants and to allow the Ni++ charging on nitriloacetic acid-tagged agarose beads. Regeneration was performed by washing the matrix with 5 column volumes (cv) ddH2O, 3 cv 2% SDS, 5 cv 100% EtOH, 1 cv ddH2O, 5 cv 0.1 M EDTA pH 8.0, 2 cv NiSO4, 3 cv ddH2O, 2 cv 6 M GuHCl 0.2 M acetic acid.
Ni-NTA agarose matrix was equilibrated with 3 cv of PURE Resuspension buffer then the cleared lysate was loaded and let pass through at 4 °C. Matrix was washed with 4 cv of PURE wash buffer. Bound His-tagged proteins were eluted with PURE elution buffer and 1.5 mL elution fractions were collected on ice. To assess which elution fractions contained the elution product 1 µL of each fraction was spotted on filter paper, stained with Staining solution for 5 min at r.t. and de-stained with flowing dH2O. Sample containing fractions were pooled, collected into 3 kDa or 10 kDa cutoff SnakeSkin™ Dialysis Tubing (Thermo Fisher Scientific) and dialyzed against 2 L PURE dialysis buffer for 2 hrs at 4 °C. Sample was dialyzed against 2 L PURE stock buffer o/n at 4 °C, split in 1 mL aliquots and stored at -80 °C.
PURE system cell-free protein synthesis
Note: The E. coli strains expressing the His-tagged PURE factors were kindly provided by professor George M. Church (Harvard University).
Church Factors purification
E. coli strains genetically modified to constitutively express the His-tagged factors (strains IEF, RF, RS1, RS2, RS3 and RS4) needed to reconstitute the PURE System and His-tagged ribosomes (strain RB1), were kindly provided by Professor George Church (Harvard University). Factors and ribosomes were purified according to 35. Each E. coli strain was grown in 5 mL LB with chloramphenicol at 30 °C, 220 rpm for 7 hours starting from glycerol stock. Culture was diluted 1:40 in 80 mL 2YTPG with chloramphenicol and grown for additional 14 h at 30 °C, 220 rpm. The whole 80 mL culture was used to start a 2 L 2YTPG culture with chloramphenicol and bacteria were grown at 30 °C, 220 rpm till OD600nm = 3. Bacteria were harvested by centrifugation at 5,000 xg at 4 °C for 30 min.
Sample containing fractions corresponding to IEF, RF, RS1, RS2, RS3 and RS4 purifications were pooled and dialyzed against 2 L Factors storage buffer. Molecular weight cut-off of Snakeskin Dialysis tubing (Thermo Fisher Scientific) was 3K for IEF strain and 10K for RF, RS1, RS2, RS3, RS4. Sample containing fractions corresponding to RB1 purification were pooled. Ribosomes were harvested by ultracentrifugation at 4 °C, 150,000 xg, 4 hours and resuspended in 100 µL RB1 storage buffer. Ribosomes stock concentration was determined by UV absorbance at 260 nm47.
Church PURE system cell-free protein synthesis
DNA plasmid templates were prepared with Plasmid Mini Kit (Qiagen). Cell-free protein synthesis reaction was mixed according to Church’s directions35. A typical Church PURE system reaction contained 700 µg/mL IEF, 370 µg/mL RF, 150 µg/mL RS, 550 µg/mL RS2, 183 µg/mL RS3, 79 µg/mL RS4, 22.3 µg/mL individual IF1, 30.9 µg/mL individual IF3, 20.0 µg/mL Arginyl-tRNA synthetase, 96.0 µg/mL Glycyl-tRNA synthetase, 0.1 mM each amino acid, 0.3 mg/mL tRNA mix, 1 mM CTP and UTP, 2.5 mM GTP, 3 mM ATP, 20 mM creatine phosphate, 10 µg/mL folinic acid, 50 mM HEPES KOH pH 7.6, 100 mM K-glutamate, 13 mM Mg-acetate, 2 mM spermidine, 2 mM DTT, 1x T7 RNA polymerase from 10x stock, 1 U/µL RiboLock RNase Inhibitor (Thermo Fisher Scientific), 10 nM DNA plasmid template, 1.5 µM His-tagged E. coli ribosomes or E. coliRibosome (New England Biolabs), 60 µM DFHBI when needed.
Gibson Assembly
Loading Dye (Thermo Fisher Scientific) to a final volume of 6 µL, and loaded on the gel. Amplicons size was assessed by running 4 µL of GeneRuler 1 kb Plus DNA Ladder (Thermo Fisher Scientific). Run was performed at a constant voltage of 120 V. The remaining volumes were incubated with 1 µL DpnI (NEB) for 1 h at 37 °C. Gibson Assembly reaction was assembled by mixing 5 µL 2X Gibson Master Mix with 75 ng vector and 3 molar equivalents of insert and ddH2O to a final volume of 10 µL. The cloning reaction was incubated for 1 h at 50 °C.
T7 RNA polymerase cloning, overexpression and purification
T7 RNA polymerase cloning and purification was performed according to 48 with modifications. T7 RNA polymerase coding sequence was amplified from pAR1219 plasmid (Sigma). pET21b was chosen as plasmid vector. Resulting construct was named GB002A. NEB Express E. coli cells (New England Biolabs) were transformed with GB002A, grown in 2 L LB with antibiotic till OD600nm = 0.6, induced with 0.5 mM IPTG and grown o/n. Cells were harvested by centrifugation at 5,000 xg at 4 °C. Cells were resuspended in T7 resuspension buffer, lysed on ice with 8 cycles of sonication 15 seconds ON / 45 seconds OFF using Analog Sonifier Cell Disruptor (Branson) output 60%. Lysate was clarified by centrifugation at 17,000 xg 4 °C, 30 min, twice and residual debris removed by 0.22 µm filtration.
T7 RNA polymerase transcription
Transcription reaction was always added with fresh DTT to 1 mM final concentration as a significant loss in activity was observed with old T7 RNA polymerase stocks, probably due to DTT oxidation. A typical in vitro transcription contained 0.1 mg/mL BSA, 10 mM DTT, 35 mM MgCl2, 2 mM spermidine, 2 mM ATP CTP GTP UTP, 0.1 U/mL Yeast Pyrophosphatase Inorganic (New England Biolabs), 0.4 U/µL RiboLock RNase Inhibitor (Thermo Fisher Scientific), 10 ng/µL DNA plasmid template, 200 mM HEPES, pH 7.5. In vitro transcription reaction was supplemented with 1 µM Malachite green when template was coding for malachite green aptamer or 60 µM DFHBI when template was coding for spinach aptamer. Fluorescence levels were monitored in real time with Rotor-Gene Q 6plex (Qiagen).
Note: pVS10 and pIA586 plasmid vectors for the overexpression and purification of E. coli RNA polymerase and σ70 transcription factor respectively, were kindly provided by
Vladimir Svetlov (New York University School of Medicine) and Irina Artsimovitch (Ohio State University).
E. coli RNA polymerase core enzyme purification
BL21 (DE3) pLysS E. coli cells (Promega) transformed with pVS10 vector were incubated in 100 mL LB with ampicillin at 37 °C, 220 rpm, o/n. Culture was diluted 1:100 in 4 L LB with ampicillin, grown at 37 °C, 220 rpm till OD600nm = 0.75. Bacteria were induced with 1 mM IPTG and grown for additional 3 hours at 37 °C, 220 rpm. Bacteria were harvested by centrifugation at 4 °C, 6,000 x g, 30 minutes. Pellet was re-suspended in 100 mL E. coli RNAP lysis buffer added with 1 mM PMSF and 1 mg/mL lysozyme and incubated for 30 min on ice. Bacteria were lysed on ice with 8 cycles of sonication 30 seconds ON / 2 min OFF using Analog Sonifier Cell Disruptor (Branson) output 60%. Lysate was clarified by centrifugation twice at 4 °C, 17,000 xg, 30 min.
polymerase containing fractions were dialyzed overnight against 2 L of E. coli RNAP dialysis buffer AB5.
The two following purifications were performed with Äkta FPLC (GE Healthcare). Before each purification pump was run 4 mL/min at 100% E. coli RNAP buffer B till conductivity stabilized around 95 mS/cm and then switched to 100% E. coli RNAP buffer A till conductivity stabilized around 4 mS/cm.
For heparin affinity chromatography, flow rate was set to 1 mL/min and HiPrep Heparin FF 16/10 column (GE Healthcare) was connected to the instrument and equilibrated with 5% E. coli RNAP buffer B till conductivity stabilized around 9.5 mS/cm. Dialyzed sample was loaded at 1 mL/min. Column was washed with 20 mL 5% B at 2 mL/min. Gradient 5% to 100% E. coli RNAP buffer B was applied over 200 mL at 1 mL/min. Protein elution was monitored by real time 280 nm absorbance reading. Bound protein eluted between conductivity 35 and 40 mS/cm. Fractions containing sample were pooled and dialyzed against 100 volumes of E. coli RNAP dialysis buffer AB5 at 4 °C, o/n.
For ion exchange chromatography, flow rate was set to 1 mL/min and Mono Q 5/50 GL column (GE Healthcare) was connected to the instrument and equilibrated with 5% E. coli RNAP buffer B till conductivity stabilized around 9.5 mS/cm. Column was washed with 20 mL 5% B at 2 mL/min. Gradient 5% to 100% E. coli RNAP buffer B was applied over 200 mL at 1 mL/min. Protein elution was monitored by real time 280 nm absorbance reading. Bound protein eluted between conductivity 20 and 30 mS/cm. Fractions containing sample were pooled and dialyzed against 500 volumes of E. coli RNAP dialysis buffer AB5 at 4 °C, o/n.
σ70 transcription factor purification
harvested by centrifugation at 4 °C, 6,000 x g, 30 minutes. Pellet was re-suspended in 60 mL σ70 Ni++ binding buffer. Bacteria were lysed on ice with 8 cycles of sonication 30 seconds ON / 2 min OFF using Analog Sonifier Cell Disruptor (Branson), output 60%. Lysate was clarified by centrifugation twice at 4 °C, 17,000 xg, 30 min.
Lysate was passed twice through Ni-NTA matrix previously equilibrated with 3 cv of σ70 Ni++ binding buffer. Matrix was washed with 20 mL σ70 Ni++ binding buffer. Bound protein was eluted with 20 mL σ70 Ni++ elution buffer.Sample containing fractions were dialyzed overnight against 1 L of σ70 storage buffer at 4 °C.
For ion exchange chromatography, flow rate was set to 1 mL/min and Mono Q 5/50 GL column (GE Healthcare) was connected to the instrument and equilibrated with σ70 storage buffer till conductivity stabilized. Sample was loaded and column was washed with σ70 buffer A 2 mL/min. Gradient 0% to 100% σ70 buffer B was applied over 40 mL at 1 mL/min. Protein elution was monitored by real time 280 nm absorbance reading. Bound protein eluted around conductivity 40 mS/cm. Fractions containing sample were pooled, added with equal amount of 100% glycerol and stored at -80 °C.
E. coli RNA polymerase holoenzyme in vitro transcription reaction
Note: JE28 E. coli strain expressing the His-tagged ribosome was kindly provided by professor Professor Suparna Sanyal (Uppsala University, Sweden).
His-tagged 70S ribosomes purification
Ribosomes were purified according to Sanyal directions47. JE28 E. coli cells were scraped from glycerol stock and grown o/n at 37 °C, shaking. The day after, 1 L LB culture with kanamycin was started by diluting 1:100 the o/n culture. When OD600 = 1.0 culture was slowly cooled down to 4 C (this step leads to the accumulation of 70s ribosomes) and bacteria harvested by centrifugation at 4,000 xg, 30 min. Pellet was resuspended in 200 mL 70S lysis buffer and lysed on ice with 4 cycles of sonication 5 seconds ON / 55 seconds OFF using Analog Sonifier Cell Disruptor (Branson) output 60%. Lysate was clarified by centrifugation at 4 C 17,000 xg, 30 min.
Ni-NTA agarose matrix was equilibrated with 3 cv of 70S lysis buffer then the cleared lysate was loaded and let pass through at 4 °C. Matrix was washed with 3 cv of 70S wash buffer. His-tagged 70S ribosomes were eluted with 3 cv of 70S elution buffer and 1,5 mL elution fractions were collected on ice. 1 µL from each elution fraction was spotted on filter paper and stained with Staining solution. Sample containing fractions were pooled and immediately dialyzed against 300 mL of 70S lysis buffer, 4 times, to remove imidazole. His-tagged 70S ribosomes were harvested by ultracentrifugation at 4 C 150,000 xg, 4 hrs. Pellet was re-suspended in Polymix buffer, split in aliquots, flash frozen in liquid nitrogen and stored at -80 C. Ribosomes stock concentration was assessed by absorption spectroscopy given ε = 4.055 x 10⁷ M-1cm-1 for absorbance at 260 nm47. A260/A280 ratio was finally calculated, being 1.9 a value typical for pure ribosomes49.
SDS-PAGE
PageRuler Prestained Protein Ladder (Thermo Fisher Scientific) was loaded. Chamber was filled with running buffer and the run was performed at a constant voltage of 120 V. Gel was stained with staining solution for 40 min, r.t. De-staining was performed in dH2O,
shaking.
Resolving gel X2 gels Stacking gel X2 gels
Resolving buffer 2.5 mL Stacking buffer 410 µL
ddH2O 3.35 mL ddH2O 3.8 mL
30% Acrylamide/Bis-acrylam 4 mL 30% Acrylamide/Bis-acrylamide 700 µL
10% SDS 100 µL 10% SDS 100 µL
10% APS 50 µL 10% APS 50 µL
TEMED 10 µL TEMED 10 µL
RNA agarose gel
The electrophoretic chamber, the gel caster and the comb were cleaned with a solution of 0.1 M NaOH for 15 min, and rinsed thoroughly with distilled water. 2% w/v agarose gel was prepared in TAE buffer with 0.5 µg Ethidium bromide. 2 µL of sample and 2 µL of RNA ladder High range (Fermentas) were mixed with 2 µL of 2x RNA Loading dye (Fermentas), boiled at 70 °C and loaded on the gel. Constant voltage of 120 mA was applied for 30 min.
S30 Crude Extract preparation
S30 in vitro protein synthesis reaction
S30 reaction and calibration were performed according to Noireaux’s directions33 with the following exceptions: K-glutamate was not included since no considerable advantage was observed when using it; maltose was used as supplementary energy source50 and its working concentration was calibrated as well. A typical S30 in vitro transcription translation reaction contained: 1x S30 Crude Extract, 1.5 mM each amino acid, 1x energy solution, 11 mM maltose, 5 mM Mg-glutamate, 2% w/v PEG 8000, 60 µM DFHBI, 10 nM circular DNA template. 10 µL reactions were run at 37 °C and fluorescence was monitored in real time by fluorescence spectroscopy using Rotor-Gene Q 6plex (Qiagen).
Buffers table
2xYTPG 16 g/L tryptone, 10 g/L yeast extract, 5 g/L NaCl, 5 g/L glucose, 3 g/L KH2PO4 6.86 g/L K2HPO4
70S elution buffer
20 mM Tris-HCl pH 7.6, 10 mM MgCl2, 150 mM KCl,
30 mM NH4Cl, 1 mM PMSF, 0.5mg/mL Lysozyme,
10 µg/mL DNAseI, 150 mM imidazole
70S lysis buffer
20mM Tris-HCl pH 7.6, 10mM MgCl2, 150mM KCl,
30mM NH4Cl, 1 mM PMSF, 0.5mg/mL Lysozyme,
10ug/mL DNAseI
70S wash buffer
20 mM Tris-HCl pH 7.6, 10 mM MgCl2, 150 mM KCl,
30 mM NH4Cl, 1 mM PMSF, 0.5mg/mL Lysozyme,
10 µg/mL DNAseI, 5 mM imidazole
Ampicillin 100 µg/mL
Chloramphenicol 34 µg/mL
E. coli RNAP buffer A 50 mM Tris-HCl pH 6.9, 5% glycerol 0.5 mM EDTA
pH 8.0, 1 mM DTT
E. coli RNAP buffer B 50 mM Tris-HCl pH 6.9 5% glycerol 0.5 mM EDTA
pH 8.0, 1 mM DTT, 1.5 M NaCl
E. coli RNAP dialysis buffer
AB5
50 mM Tris pH 6.9, 75 mM NaCl 5% glycerol 0.5 mM EDTA, 0.1 mM DTT
E. coli RNAP lysis buffer 50 mM Tris-HCl pH 6.9, 500 mM NaCl 5% glycerol
E. coli RNAP Ni++ binding
buffer 50 mM Tris-HCl pH 6.9, 500 mM NaCl
5% glycerol, 20 mM Imidazole
E. coli RNAP Ni++ elution
buffer
50 mM Tris-HCl pH 6.9, 500 mM NaCl 5% glycerol, 250 mM Imidazole
E. coli RNAP storage buffer 10 mM Tris-HCl pH 7.5, 50% glycerol, 100 mM
NaCl, 0.1 mM EDTA, 0.1 mM DTT
Factors elution buffer
20 mM Tris-HOAc pH 7.6, 30 mM NH4Cl, 150 mM
Factors lysis buffer
20 mM Tris-HOAc pH 7.6, 30 mM NH4Cl, 150 mM
KCl, 150 mM NaCl, 1 mM PMSF, 6 mM β-Mercaptoethanol
Factors storage buffer
20 mM Tris-HOAc pH 7.6, 30 mM NH4Cl, 150 mM
KCl, 15 mM Mg(OAc)2, 6 mM
β-Mercaptoethanol, 10 µM GDP, 20% v/v Glycerol
Factors wash buffer 20 mM Tris-HOAc pH 7.6, 30 mM NH4Cl, 150 mM KCl, 150 mM NaCl, 10 mM imidazole-HOAc (pH 7.4)
Kanamycin 50 µg/mL
LB 10 g/L tryptone, 5 g/L yeast extract, 10 g/L NaCl
Polymix Buffer
5 mM NH4Cl, 95 mM KCl, 0.5 mM CaCl2, 8 mM
putrescine, 1 mM spermidine, 5 mM KH2PO4, 1 mM
DTT
PURE dialysis buffer
50 mM Hepes-KOH, pH 7.6, 100 mM potassium chloride, 10 mM magnesium chloride, 7 mM 2-mercaptoethanol. Store at 4°C.
PURE elution buffer
50 mM Hepes-KOH, pH 7.6, 100 mM potassium chloride, 10 mM magnesium chloride, 500 mM imidazole, pH 7.6, 7 mM 2-mercaptoethanol
PURE Resuspension buffer
50 mM Hepes-KOH, pH 7.6, 1 M ammonium chloride, 10 mM magnesium chloride, 7 mM 2-mercaptoethanol, 1 mM PMSF.
PURE stock buffer 50 mM Hepes-KOH, pH 7.6, 100 mM potassium chloride, 10 mM magnesium chloride, 30% glycerol,7 mM 2-mercaptoethanol. Store at 4°C.
PURE wash buffer
50 mM Hepes-KOH, pH 7.6, 100 mM potassium chloride, 10 mM magnesium chloride, 20 mM imidazole, pH 7.6, 7 mM 2-mercaptoethanol.
RB1 elution buffer 10 mM Tris-HOAc pH 7.6, 60 mM NH4Cl, 15 mM MgCl2, 0.5 mM EDTA, 150 mM imidazole
RB1 lysis buffer
10 mM Tris-HOAc pH 7.6, 60 mM NH4Cl, 15 mM
MgCl2, 0.5 mM EDTA, 1 mM PMSF protease
inhibitor
RB1 storage buffer 20 mM Tris-HOAc pH 7.6, 30 mM NH4Cl, 15 mM MgCl2, 150 mM KCl
RB1 wash buffer 10 mM Tris-HOAc pH 7.6, 60 mM NH4Cl, 15 mM MgCl2, 0.5 mM EDTA, 5 mM imidazole
Resolving buffer 1.5 M Tris-HCl, pH 8.8 SDS-PAGE Loading buffer
(3X)
240 mM Tris-HCl, pH 6.8, 6% w/v SDS, 30% v/v glycerol, 15% v/v β-mercaptoethanol, 0.06% w/v Bromophenol Blue
Stacking buffer 1 M Tris-HCl, pH 6.8
Staining solution 1% w/v Coomassie Brilliant Blue, 40% v/v methanol, 10% v/v acetic acid
T7 elution buffer 50 mM sodium phosphate, pH 8.0, 300 mM NaCl, 10% glycerol, 0.5 mM DTT 500mM Imidazole
T7 stock buffer 50 mM Tris-HCl pH 7.9, 100 mM NaCl, 1 mM DTT, 0.1 mM EDTA, 0.1% Triton X-100, 50% Glycerol
T7 wash buffer 50 mM sodium phosphate, pH 8.0, 300 mM NaCl, 10% glycerol, 0.5 mM DTT, 20 mM imidazole
TAE buffer 40 mM Tris-HCl, 1 mM EDTA pH 8.0, 0.1% v/v acetic acid
Transformation buffer 10 mM Tris-HCl, pH 7.0, 50 mM CaCl2
σ70 buffer A 50 mM Tris-HCl pH 8.0, 10% v/v glycerol, 0.1 mM EDTA, 0.1 mM DTT, 0.1 M NaCl
σ70 buffer B 50 mM Tris-HCl pH 8.0, 10% v/v glycerol, 0.1 mM
EDTA, 0.1 mM DTT, 0.5 M NaCl
σ70 Ni++ binding buffer 20 mM Tris-HCl, pH 8.0, 5 mM Imidazole, 500 mM
NaCl,1 mM PMSF
σ70 Ni++ elution buffer 20 mM Tris-HCl, pH 8.0, 50 mM Imidazole, 500 mM
NaCl,1 mM PMSF
1.5.
References
1. Zamecnik, P. C. & Frantz, I. D. Incorporation in vitro of radioactive carbon from carboxyl-labeled dl-alanine and glycine into proteins of normal and malignant rat livers. J. Biol. Chem.175, 299–314 (1948).
2. Mao, Y., Liu, H., Liu, Y. & Tao, S. Deciphering the rules by which dynamics of mRNA secondary structure affect translation efficiency in Saccharomyces cerevisiae. Nucleic Acids Res.42, 4813–22 (2014).
3. Lamborg, M. R. & Zamecnik, P. C. Amino acid incorporation into protein by extracts of E. coli. Biochim. Biophys. Acta42, 206–211 (1960).
4. Bank, A. & Marks, P. A. Protein synthesis in a cell free human reticulocyte system: ribosome function in thalassemia. J. Clin. Invest.45, 330–336 (1966).
5. Schweet, R., Lamfrom, H. & Allen, E. THE SYNTHESIS OF HEMOGLOBIN IN A CELL-FREE SYSTEM. Proc. Natl. Acad. Sci. U. S. A.44, 1029–35 (1958).
6. Littlefield, J. W., Keller, E. B., Gross, J. & Zamecnik, P. C. Studies on cytoplasmic ribonucleoprotein particles from the liver of the rat. J. Biol. Chem.217, 111–23 (1955).
7. Hoagland, M. B., Keller, E. B. & Zamecnik, P. C. Enzymatic carboxyl activation of amino acids. J. Biol. Chem. 218, 345–58 (1956).
8. Smith, H. O. & Welcox, K. W. A Restriction enzyme from Hemophilus influenzae. J. Mol. Biol.51, 379–391 (1970).
9. Mandel, M. & Higa, A. Calcium-dependent bacteriophage DNA infection. J. Mol. Biol.53, 159–62 (1970).
10. Nirenberg, M. W. & Matthaei, J. H. The dependence of cell-free protein synthesis in E. coli upon naturally occurring or synthetic polyribonucleotides. Proc. Natl. Acad. Sci. U. S. A.47, 1588–602 (1961).
11. Yin, G. et al. Aglycosylated antibodies and antibody fragments produced in a scalable in vitro transcription-translation system. MAbs4, 217–225 (2012).
12. Ryabova, L. A., Desplancq, D., Spirin, A. S. & Plückthun, A. Functional antibody production using cell-free translation: Effects of protein disulfide isomerase and chaperones. Nat. Biotechnol.15, 79–84 (1997).
13. Salehi, A. S. M. et al. Cell-free protein synthesis of a cytotoxic cancer therapeutic: Onconase production and a just-add-water cell-free system. Biotechnol. J.11, 274–281 (2016).
14. Martemyanov, K. A., Shirokov, V. A., Kurnasov, O. V., Gudkov, A. T. & Spirin, A. S. Cell-Free Production of Biologically Active Polypeptides: Application to the Synthesis of Antibacterial Peptide Cecropin. Protein Expr. Purif.21, 456–461 (2001).
15. Zubay, G. In Vitro Synthesis of Protein in Microbial Systems. Annu. Rev. Genet.7, 267–287 (1973).
16. Nevin, D. E. & Pratt, J. M. A coupled in vitro transcription-translation system for the exclusive synthesis of polypeptides expressed from the T7 promoter. FEBS Lett.291, 259–263 (1991).
17. Craig, D., Howell, M. T., Gibbs, C. L., Hunt, T. & Jackson, R. J. Plasmid cdna-directed protein synthesis in a coupled eukaryotic in vitro transcription-translation system. Nucleic Acids Res.20, 4987–4995 (1992).
18. Campbell, E. A. et al. Structural mechanism for rifampicin inhibition of bacterial RNA polymerase. Cell104,
901–912 (2001).
19. Tabor, S. Expression Using the T7 RNA Polymerase/Promoter System. in Current Protocols in Molecular Biology (2001). doi:10.1002/0471142727.mb1602s11
20. Shimizu, Y. et al. Cell-free translation reconstituted with purified components. Nat. Biotechnol.19, 751–755 (2001).
21. Shimizu, Y., Kuruma, Y., Ying, B.-W., Umekage, S. & Ueda, T. Cell-free translation systems for protein engineering. FEBS J.273, 4133–4140 (2006).
23. Ohashi, H., Shimizu, Y., Ying, B. W. & Ueda, T. Efficient protein selection based on ribosome display system with purified components. Biochem. Biophys. Res. Commun.352, 270–276 (2007).
24. Villemagne, D., Jackson, R. & Douthwaite, J. A. Highly efficient ribosome display selection by use of purified components for in vitro translation. J. Immunol. Methods313, 140–148 (2006).
25. PURExpress® Disulfide Bond Enhancer | NEB. Available at: https://www.neb.com/products/e6820-purexpress-disulfide-bond-enhancer#FAQs & Tech Tips. (Accessed: 29th January 2018)
26. Kuruma, Y., Nishiyama, K. I., Shimizu, Y., Müller, M. & Ueda, T. Development of a minimal cell-free translation system for the synthesis of presecretory and integral membrane proteins. Biotechnol. Prog.21, 1243–1251 (2005).
27. Hong, S. H., Kwon, Y.-C. & Jewett, M. C. Non-standard amino acid incorporation into proteins using Escherichia coli cell-free protein synthesis. Front. Chem.2, (2014).
28. Köhrer, C. & Rajbhandary, U. L. Proteins with One or More Unnatural Amino Acids. in The Aminoacyl-tRNA Synthetases 1–11 (2005).
29. Hirao, I., Kanamori, T. & Ueda, T. Cell-Free Synthesis of Proteins with Unnatural Amino Acids. The PURE System and Expansion of the Genetic Code. in Protein Engineering 271–290 (2009). doi:10.1007/978-3-540-70941-1_10
30. Niwa, T. et al. Bimodal protein solubility distribution revealed by an aggregation analysis of the entire ensemble of Escherichia coli proteins. Proc. Natl. Acad. Sci.106, 4201–4206 (2009).
31. Niwa, T., Kanamori, T., Ueda, T. & Taguchi, H. Global analysis of chaperone effects using a reconstituted cell-free translation system. Proc. Natl. Acad. Sci.109, 8937–8942 (2012).
32. Hillebrecht, J. R. & Chong, S. A comparative study of protein synthesis in in vitro systems: from the prokaryotic reconstituted to the eukaryotic extract-based. BMC Biotechnol8, 58 (2008).
33. Sun, Z. Z. et al. Protocols for implementing an Escherichia coli based TX-TL cell-free expression system for synthetic biology. J. Vis. Exp. e50762 (2013). doi:10.3791/50762
34. Shimizu, Y. & Ueda, T. PURE technology. Methods Mol. Biol.607, 11–21 (2010).
35. Wang, H. H. et al. Multiplexed in vivo his-tagging of enzyme pathways for in vitro single-pot multienzyme catalysis. ACS Synth. Biol.1, 43–52 (2012).
36. Gil, R., Silva, F. J., Pereto, J. & Moya, A. Determination of the Core of a Minimal Bacterial Gene Set. Microbiol. Mol. Biol. Rev.68, 518–537 (2004).
37. de Souza, T. P., Stano, P. & Luisi, P. L. The minimal size of liposome-based model cells brings about a remarkably enhanced entrapment and protein synthesis. ChemBioChem10, 1056–1063 (2009).
38. Noireaux, V. & Libchaber, A. A vesicle bioreactor as a step toward an artificial cell assembly. Proc. Natl. Acad. Sci.101, 17669–17674 (2004).
39. Courtois, F. et al. An integrated device for monitoring time-dependent in vitro expression from single genes in picolitre droplets. ChemBioChem9, 439–446 (2008).
40. Lentini, R. et al. Two-Way Chemical Communication between Artificial and Natural Cells. ACS Cent. Sci.3,
117–123 (2017).
41. Rampioni, G. et al. Synthetic cells produce a quorum sensing chemical signal perceived by Pseudomonas aeruginosa. Chem. Commun. (2018). doi:10.1039/C7CC09678J
42. Jewett, M. C. & Forster, A. C. Update on designing and building minimal cells. Current Opinion in Biotechnology21, 697–703 (2010).
43. Forster, A. C. & Church, G. M. Towards synthesis of a minimal cell. Molecular Systems Biology2, (2006).
Free Synthetic Biology. ACS Synth. Biol.5, 344–355 (2016).
46. Kolpashchikov, D. M. Binary Malachite Green Aptamer for Fluorescent Detection of Nucleic Acids. (2005). doi:10.1021/JA0529788
47. Shu, D., Khisamutdinov, E. F., Zhang, L. & Guo, P. Programmable folding of fusion RNA in vivo and in vitro driven by pRNA 3WJ motif of phi29 DNA packaging motor. Nucleic Acids Res.42, e10 (2014).
48. Paige, J. S., Wu, K. Y. & Jaffrey, S. R. RNA mimics of green fluorescent protein. Science (80-. ).333, 642–646 (2011).
49. Ederth, J., Mandava, C. S., Dasgupta, S. & Sanyal, S. A single-step method for purification of active His-tagged ribosomes from a genetically engineered Escherichia coli. Nucleic Acids Res.37, (2009).
50. Ellinger, T. & Ehricht, R. Single-step purification of T7 RNA polymerase with a 6-histidine tag. Biotechniques 24, 718–720 (1998).
51. Spedding, G. (Gary). Ribosomes and protein synthesis : a practical approach. (IRL Press at Oxford University Press, 1990).
Chapter 2.
Cell-free transcription is more variable than
translation
2.1.
Introduction
Regardless of the final application of synthetic biology, from investigating how life works to the development of new technologies, the exploited tools must be characterized by simple but stringent qualities. First, the tools must feature well known and characterized mechanisms. Second, the tools must allow for a predictable use in order to grant strongly reproducible output and results. Most of the tools used in synthetic biology fulfill these requirements1, although when it comes to cell-free expression systems and related applications, complexity increases and even a reproducible outcome cannot easily be predicted beforehand. This leads to the conclusion that the knowledge of protein expression in vivo can be transposed to in vitro systems only to certain extent. It becomes also clear that, even if we are dealing with one of the basic components of bottom-up synthetic biology, a comprehensive characterization of cell-free expression is needed.
The relationship between the kinetics of mRNA folding and gene expression involve many factors and are still not sufficiently understood2. Most likely this is due to the fact that the dynamics ruling the folding of mRNA can lead to very complex architectures, considering that some RNA molecules can even fold up into protein-like structures with catalytic activity3.
2.2.
Results
Variability of RNA and protein levels in an E. coli cell-free extract
In our laboratory, it was shown by Fabio Chizzolini that the variability in in vitro protein translation is greater than the variability in mRNA transcription4. In particular, he expressed BFP and RFP with the PURE System behind four different T7 transcriptional promoters and four different ribosome binding sites, for a total of 16 combinations with predictable RNA and protein outputs. He observed that the relative transcriptional promoter strength gave predictable distributions of mRNA concentrations regardless of the strength of the RBS. Instead, when using different RBS sequences, the concentration of protein showed a poor correlation between constructs encoding RFP and BFP, for all four transcriptional promoters. Low coefficients of variation in mRNA levels for both genetic constructs were consistent with the fact that transcription with the PURE System relies on a single enzyme, T7 RNA Polymerase. On the other hand, the large number of proteins required to synthesize proteins could explain the higher coefficients of variation observed for translation of RFP and BFP. Moreover, the DNA template for mRNA transcription comes as a concentration-defined double stranded molecule usually characterized by a consistent structure regardless of sequence. Conversely, the mRNA template for protein production folds in a sequence-dependent manner into complex secondary and tertiary structures which would be expected to affect the efficiency of translation, as observed.
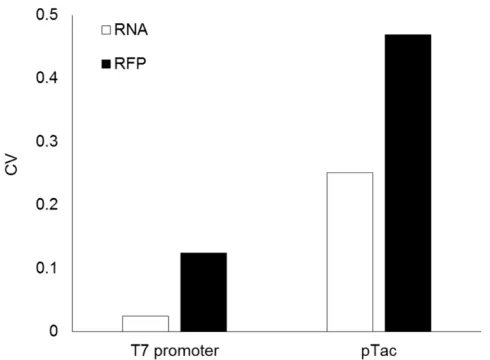
Figure 1. Variability of RNA and protein levels in an E. coli cell-free extract. Plotted data represent the coefficient of variation of RNA and RFP (white and black bars respectively) for both T7 and pTac promoters for reactions run on the same day with the same batch of cell extract. The coefficient of variation was calculated for transcription after 1 h (the point of maximal RNA) and for translation after 6 h. The coefficient of variation was calculated over relative fluorescence intensities4.
The calculated coefficient of variation was 5-fold larger for translation than for transcription using T7 RNA polymerase and 1.9-fold larger with E. coli RNA polymerase (Figure 1). The coefficient of variation was 10.4-fold higher for transcription with E. coli RNA Polymerase than with T7 RNA Polymerase, consistent with the multi-subunits structure of the E. coli RNA Polymerase holoenzyme.
Influence of RNA folding on transcription-translation
The evidences that when dealing with in vitro transcription-translation, even of a single gene, the RBS sequence does not allow for predictable and consistent protein output, reflects a dependence on the entire sequence of the mRNA. In fact, different RNA sequences have the ability to fold differently. Different RNA secondary structures will be characterized by diverse complexities and stabilities, which will affect accessibility of the RBS sequence as well as the initiation of translation5, and thus ribosome density6.
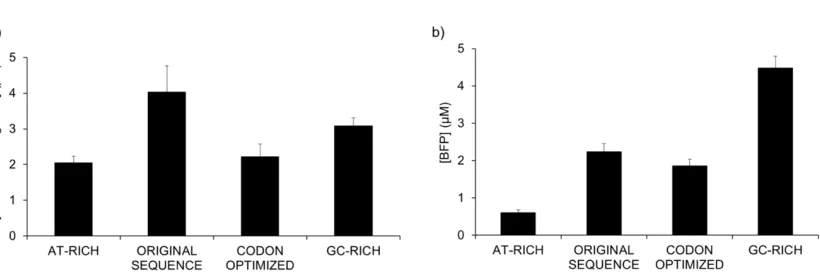
sequence, codon optimized for yeast and bacteria, was re-synthesized to maintain the same amino acid sequence but to have maximal or minimal GC content, and an additional sequence codon optimized construct for expression in E. coli was synthesized. PURE system templates were then generated by PCR amplification of the BFP coding sequences using primers to introduce the same T7 promoter upstream of the RBS. mRNA measurements were based on the fluorescence of the Spinach aptamer coded downstream of the BFP. Resulting RNA and BFP protein yields are shown in Figure 2.
Figure 2. Different GC contents of BFP coding sequence lead to differences in translation but not transcription. Variants of the blue fluorescent protein Azurite were generated with different percentages of GC content in order to probe the relationship between mRNA structure and protein expression in PURE system reactions. PURE system reactions were incubated for 6 hours at 37 °C with the different templates for the production of different coding sequences. Both transcription and translation were monitored using fluorescence. Samples tested were, from lower GC content to higher GC content, the following: NG046 (AT rich) (GC content: 30.4%), NG045 (original sequence) (GC content: 36.27%), NG047 (codon optimized sequence) (GC content: 47.14%), NG048 (GC rich) (GC content: 59.97%)4.
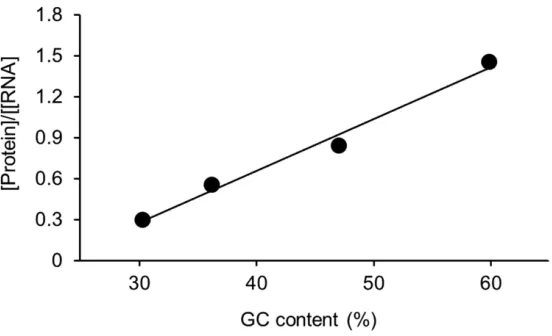
Figure 3. GC content of the coding sequence of BFP affects the synthesis of protein. The coding sequence of the protein was modified to maximize either the AT or GC content. Additionally, a codon-optimized version of the coding sequence was generated to assess the impact on translation. Each construct was expressed with the PURE system. The DNA constructs from lower GC content to higher GC content were NG046 (AT-rich, GC content: 30.4%), NG045 (original sequence, GC content: 36.3%), NG047 (codon-optimized, GC content: 47.1%), and NG048 (GC-rich, GC content: 60.0%). R2= 0.985. Adapted from Chizzolini et al. 4
2.3.
Discussion
Although more work is needed to determine how robust the relationship between GC content and protein expression is with bacterial systems, it does appear that mRNA folding significantly affects the expression of protein in vitro. Previous in vivo studies on the initiation of translation show that high protein expression may be best achieved with sequences characterized by low structure spanning from the RBS region8 to the first 13 nucleotides of the coding sequence5. Together with data shown here, these findings suggest that the strongest translation output comes with low RBS sequences and high GC content across the gene.
2.4.
Materials and methods
S30 Extract cell-free transcription-translation
E. coli-based S30 Crude Extract was prepared as described in Chapter 1, Materials and Methods section. A typical S30 in vitro transcription translation reaction contained: 1x S30 Crude Extract, 1.5 mM each amino acid, 1x energy solution, 11 mM maltose, 5 mM Mg-glutamate, 2% (w/v) polyethylene glycol (PEG) 8000, 60 µM (Z)-4-(3,5-difluoro-4-hydroxybenzylidene)-1,2-dimethyl-1H-imidazol-5(4H)-one (DFHBI) (Lucerna), 10 nM circular DNA template. 10 µL reactions were assembled on ice and run at 30 °C. Fluorescence was monitored in real time using a Rotor-Gene Q 6plex (Qiagen). The green channel was used to detect Spinach (excitation: 470 ± 10 nm; emission: 510 ± 5 nm), and the orange channel was used to detect RFP (excitation: 585 ± 5 nm; emission: 610 ± 5 nm).
PURE System cell-free transcription-translation
Transcription-translation reactions (9 µL) with the PURExpress in vitro protein synthesis kit (New England Biolabs) contained 12.6 nM of linear DNA template and 4 units of human placenta RNase inhibitor (New England BioLabs). When needed, DFHBI was added to a final concentration of 60 µM. The reaction components were assembled on ice and the reaction was initiated by incubation at 37 °C. Reactions were monitored for 6 h with a Rotor-Gene Q 6plex system (Qiagen). The green channel was used to detect Spinach (excitation: 470 ± 10 nm; emission: 510 ± 5 nm), and the blue channel was used to detect BFP (excitation: 365 ± 20 nm; emission: 460 ± 20 nm).
Protein and RNA Standard Curves
2.5.
References
1. MacDonald, I. C. Tools and applications in synthetic biology. Adv. Drug Deliv. Rev.105, 20–34 (2016).
2. Espah Borujeni, A., Channarasappa, A. S. & Salis, H. M. Translation rate is controlled by coupled trade-offs between site accessibility, selective RNA unfolding and sliding at upstream standby sites. Nucleic Acids Res. 42, 2646–2659 (2014).
3. Doherty, E. A. & Doudna, J. A. Ribozyme Structures and Mechanisms. Annu. Rev. Biochem. 69, 597–615 (2000).
4. Chizzolini, F. et al. Cell-Free Translation Is More Variable than Transcription. ACS Synth. Biol.6, 638–647 (2017).
5. Espah Borujeni, A. et al. Precise quantification of translation inhibition by mRNA structures that overlap with the ribosomal footprint in N-terminal coding sequences. Nucleic Acids Res.45, 5437–5448 (2017).
6. Mao, Y., Liu, H., Liu, Y. & Tao, S. Deciphering the rules by which dynamics of mRNA secondary structure affect translation efficiency in Saccharomyces cerevisiae. Nucleic Acids Res.42, 4813–22 (2014).
7. Zur, H. & Tuller, T. Strong association between mRNA folding strength and protein abundance in S. cerevisiae.
EMBO Rep.13, 272–7 (2012).
8. Kudla, G., Murray, A. W., Tollervey, D. & Plotkin, J. B. Coding-Sequence Determinants of Gene Expression in Escherichia coli. Science (80-. ).324, 255–258 (2009).
9. Babitzke, P., Baker, C. S. & Romeo, T. Regulation of translation initiation by RNA binding proteins. Annu. Rev. Microbiol.63, 27–44 (2009).
10. Hansen, M. M. K. et al. Protein Synthesis in Coupled and Uncoupled Cell-Free Prokaryotic Gene Expression Systems. ACS Synth. Biol.5, 1433–1440 (2016).
11. Salis, H. M. The Ribosome Binding Site Calculator. in Methods in enzymology498, 19–42 (2011).
12. Chizzolini, F., Forlin, M., Cecchi, D. & Mansy, S. S. Gene Position More Strongly Influences Cell-Free Protein Expression from Operons than T7 Transcriptional Promoter Strength. ACS Synth. Biol.3, 363–371 (2014).