Please cite this article as: S. Mavaddati, Rice Classification and Quality Detection Based on Sparse Coding Technique, International Journal of Engineering (IJE), IJE TRANSACTIONS B: Applications Vol. 31, No. 11, (November 2018) 1910-1917
International Journal of Engineering
J o u r n a l H o m e p a g e : w w w . i j e . i rRice Classification and Quality Detection Based on Sparse Coding Technique
S. Mavaddati*
Department of Engineering and Technology, University of Mazandaran, Babolsar, Iran
P A P E R I N F O
Paper history: Received 31 July 2018
Received in revised form 14 October 2018 Accepted 26 October 2018
Keywords:
Rice Classification Quality Detection Compressive Sensing Dictionary Learning Neural Network
A B S T R A C T
Classification of various rice types and determination of its quality is a major issue in the scientific and commercial fields associated with modern agriculture. In recent years, various image processing techniques are used to identify different types of agricultural products. There are also various color and texture-based features in order to achieve the desired results in this area. In this paper, the problem of rice categorization and quality detection using compressive sensing concepts is considered. This issue includes sparse representation and dictionary learning techniques to achieve over-complete models and represent the structural content of rice variety. Also, dictionaries are learned in such a way to have the least coherence values to each other. The results of the proposed classifier based on the learned models are compared with the results obtained from the neural network and support vector machine classifiers. Simulation results show that the proposed method based on the combinational features is able to identify the type of rice grain and determine its quality with high accuracy rate.
doi: 10.5829/ije.2018.31.11b.15
1. INTRODUCTION*
Rice classification and detection of its quality is the main field in image processing attracted many researchers in recent years. Rice is one of the most important food products for people in Iran and the world [1]. The traditional methods based on vision and olfaction are very common in this field, but there are typically time-consuming and are not particularly reliable for an inexperienced buyer. Also, mental conditions such as fatigue in this sensory evaluation can greatly affect the diagnostic procedure. Therefore, data mining and image processing techniques are applied in this area to lead to more accurate classification in a short time. Using these processing techniques and feature extraction of the recorded images, we can identify the quality of various agricultural products [2-3]. Although this issue is important, there is little research in this area. The classification results of wheat, oats and rye grains were considered using a combination of color, texture and morphological characteristics [3]. The color and texture-based features are used to train a
*Corresponding Author Email: [email protected] (S. Mavaddati)
back propagation neural network and detect wheat, barley, oats and rye grains [4]. The appropriate classification accuracy is obtained using these features.
linear discriminant analysis (LDA) and artificial neural network [11]. The classification of three Iranian rice products from the mixed samples was performed by the combinational coefficients including GLCM and local binary pattern (LBP) features [12]. Then, the combination of two methods of Fisher's coefficient and principal component analysis (PCA) are used to select the effective features in this categorization. The used classifier is learning vector quantization (LVQ) neural network. In most papers, a rice classification method is presented using individual recorded samples [7, 11-12]. Another procedure for rice classification uses the bulk sample [13-14]. The texture-based features based on GLCM and back propagation neural network were used to determine five Iranian rice products [13]. Based on the bulk samples of rice grains, the quality detection of rice product has only been investigated by Mousavirad and Akhlaghiantab [14]. Hashemi rice is considered as the main rice and it is combined in different percentages with Basmati rice which has less nutritious and lower price [14]. The ratio of these combinations is from 5% up to 50%. The histogram-based, GLSM and LBP features are used in this method. Also, a genetic algorithm is utilized to select the main coefficients of feature vector.
In this paper, a new method for rice classification and quality detection is proposed based on the concept of compressive sensing. In this technique, dictionary learning and sparse coding procedures lead to over-complete models for different rice types. The proposed dictionary learning algorithm is designed in such a way that the trained model for each rice type has the least coherence value with other trained models. Different rice types considered in this paper are Tarom, Shiroodi, Fajr, and Binam that are very used in the north of Iran.
In section 2 of this paper, the dictionary learning procedureis introduced, and then different feature extraction methods are investigated in section 3. Section 4, the proposed classification algorithm is discussed. Section 5, the results of the proposed classifier are reported and compared with other common classifiers. In the last section, the paper is concluded.
2. DICTIONARY LEARNING AND SPARSE
REPRESENTATION
The input image I can be modeled using the dictionary learning technique as:
(1)
m
I DX
where Im is a data matrix including different patches of I. The input image is divided into different patches Im∈M that M involves the dimension of these patches. The data matrix Im can be coded by a linear combination of the defined atoms over an over-complete dictionary D ∈ ℝP×L, L > 𝑃 as stated in Equation (1). This dictionary
includes L columns or atoms {dl}l=1L with unit norm ‖d(:,l)‖
2= 1, ∀l = 1, … , L. The coding matrix X with K cardinality parameter and L ≫ K consists of the sparse coefficients of Im[15-16]. The value of cardinality parameter K determines that how many columns of D can participate in the representation of each input data. The sparse representation problem with the approximation error and sparsity constraint terms is formulated [17]:
(2)
* X
X argmin IDX2s.t. X K
2 0
where ‖X‖0 denotes the number of non-zero coefficients in each row of X. The over-complete dictionary learning was first presented for image denoising using K-SVD technique [17].
3. FEATURE EXTRACTION
The feature extraction step is the first step of rice classification problem similar to all common classifiers [18-20]. In the following, different methods for extracting these features are investigated.
3. 1. Gabor Filter One of the important features in the image analysis is the magnitude and phase coefficients generated by applying Gabor filter to the image. Using this linear filter, the frequency components in different directions of image pixels are calculated, which is very important in order to distinguish between different regions of the image. A filtered image is obtained by applying Gabor filter in the specified directions of an image. The Gabor filter is yielded by the expansion and rotation of a Gabor function expressed as follows [21-22]:
(3)
x y x
y
g(x, y) / ( )exp[ / (x / ( ) y / ( )) j (xCos ySin )]
2 2
2 2
1 2 1 2
where, σx and σy are standard deviations along the x and y directions. Also, ω and θ are the frequency and desired direction. The output of each Gabor function at the specified angle is two magnitude and phase matrices with the same dimension to the original image [21-22].
depend on the choice of neighborhood type. These neighborhoods can be considered as diagonal or circular with different radius [22].
3. 3. Histogram of Oriented Gradients One of the feature extraction algorithms in image processing, which is very effective in classification purposes, is the histogram of oriented gradients (HOG) [23]. In this method, the number of gradient occurrence in different directions of the local sections in the image is calculated. This counting is done on different cells that are considered in the overlapped blocks of image. In this case, the image is first divided into the blocks with 50% overlap and then each block is divided into four cells. The gradient at every pixel has a magnitude and a direction or angle. The magnitude and angle of gradient in each pixel of the selected cell are calculated. Then, a histogram with 9 directions consists of different gradient angles in the range from 0 to π is obtained. It should be noted that this descriptor is rotation-variant, but the difference in the illumination intensity will have a little effect on the extracted properties [23].
3. 4. Gray Level Co-Occurrence Matrix nother feature that determines the texture properties of the image is gray level co-occurrence matrix (GLCM) [24]. The textural information of an image can be expressed by means of a matrix with relative abundances P(i,j) that the value of each row with the number of row i and the column number j represent the number of occurrence neighborhoods with the same gray level value in the different directions (for example 0°, 45°, 90°, 135°, and 180°). The coefficients of the GLCM matrix are not used directly as features for classification, but some statistical parameters resulted in GLCM coefficients determine the texture properties of the image. These parameters include mean, variance, energy, the range of variations in relative abundance, contrast, homogeneity, uncertainty, maximum relative frequency, correlation, and entropy. Selection of all or a part of these second-order statistical properties in the image processing routine will be effective in the texture analysis of image [24].
3. 5. Moments The other statistical feature discussed in the field of image processing, which is very important due to its rotation-invariant property, is the extracted moments of the image [25]. The values of this feature set, which consists of seven coefficients of the first to seventh moments, do not change with the image rotation in each direction. Therefore, this feature set will be very important in the classification algorithms that the rotation problem is a fundamental challenge for them.
4. THE PROPOSED METHOD FOR RICE CLASSIFICATION
In order to solve the rice classification problem in the proposed algorithm, at first, an over-complete model is learned for each data set. Some samples of this data set are shown in Figure 1.
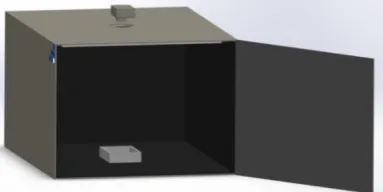
4. 1. 1. Rice Data Recording In order to prepare the bulk samples for different types of rice grains, a box with dimensions of 30cm×40cm ×60cm is prepared as shown in Figure 2. In order to create a consistent light in the interior of the box, 4 LED strips are used with the length 25cm in the inner and upper sides of the box to prevent from shadowing over samples. A circle with the diameter of 5cm was created at the center of the upper level of the box to mount the camera. To prepare the samples, a rectangular container with dimension 10cm×10cm was used. The rice sample is placed in this container and its surface is flattened so that no shadow can be created over the sample. The Sony Imaging Camera with a 300imx sensor and 19-Megapixel resolution is used to record images.
4. 1. 2. Sparse Coding and Dictionary Learning in the Proposed Method In order to properly categorize the rice varieties, a structured set of data related to each class can be used as a comprehensive model using a specific procedure called the dictionary learning technique.
(b) (a)
(d) (c)
Figure 1. Some bulk samples of training data used in the rice classification problem. a) Tarom rice. b) Shiroodi rice. c) Fajr rice. d) Binam rice
The first step of dictionary learning procedure is the sparse coding of training data. An initial dictionary is selected randomly from the training data. Then, using sparse coding, according to Equation (2), the sparsity coefficients are obtained. The next step in the dictionary learning algorithms is to update the dictionary's atoms according to the input data patches. In the second step, the dictionary atoms are updated according to the resulted coefficient matrix. In the proposed rice classification algorithm, the least angle regression with coherence criterion (LARC) sparse representation method is used [26].
In the LARC coding, a stop condition based on the coherence parameter between the atoms and training data is utilized [26]. Using this algorithm, only atoms whose coherence value with data patches remains more than a certain value, named as residual coherence Coh, are included in the dictionary. The sparse representation using this algorithm can be expressed as:
(4)
*
X LRAC D, X, K,Coh
where Coh indicates the value of residual coherence. Also, K is the variable cardinality parameter and can be selected from 0 to K in the sparse coding procedure. The mutual coherence between the dictionary atoms is obtained based on the maximum value of the correlation for different atoms as follows:
(5)
i ji, j L ,i j
μ D max d .d
1
where d is the dictionary atoms.The maximum absolute value of the correlation between the atoms should be obtained as small as possible to result in a trained model with independent learned atoms [26]. It is usually difficult to find a dictionary with the minimum coherence value between its atoms when the dictionary dimension is high. Therefore, some approximate methods are used to access the dictionary with the incoherent atoms. The approximation procedure in order to solve this problem leads to the definition of Gram matrix G = DTD. It should be noted that if the Gram matrix of a dictionary is in the form of the unitary matrix, then the atoms of this dictionary are as independent as possible [27]. In order to achieve this Gram matrix for any desired dimension of the dictionary, some different approximate solutions are utilized. One of these solutions is the post-processing algorithm in the dictionary learning process. An iterative projection followed by rotation (IPR) technique is introduced in order to obtain the desired Gram matrix [27].
4. 1. 3. The Correction of Dictionary Atoms In this classification problem based on the learned models, it is important that the designed dictionaries belong to each data class do not have any similarity with each
other and a distinction can be made between different categories. Therefore, the learned dictionary must have the least coherence value with the atoms of other dictionary classes. In this section, I consider the issue of whether the atoms with the same structure exist in the representation of training data in a fixed dictionary related to each rice class. If this problem is confirmed then a routine is designed to reduce this similarity. In the proposed correction step, a composite dictionary D=[DT DSHDF DB]including the dictionaries related to Tarom rice DT, Shiroodi rice DSH, Fajr rice DF, and Binam rice DB is considered. Then the data related to each class, for example the Tarom rice, is coded over this composite dictionary:
* * * *
T SH F B T SH F B
T SH F B T F B
,SH,F,B SH F
, , , , D D D D ,
arg min D D D D X X ' ||
2
XTX X X
X X X X I
I X
| X
|
LARC coh
(6)
where I includes the training images. In the following, the energy of the sparse coefficients is calculated for different rice varieties:
F
* *
l l
*
L
*
l l
L
T SH
L L
B
,
L , L
,
L L
2 2
1 1
2 2
1 1
1 1
1 1
T,l SH,l
F,l B,l
E X E X
E X E X
(7)
As the data related to Tarom rice should not be represented on the other dictionaries, the atoms of other dictionaries such as DSH, DF, and DB which have the largest energy in this representation are replaced by the dictionary atoms that have the least energy in this sparse coding. Also, the sparse coding of other data class is performed on this composite dictionary and the energy of this representation related to rice data is calculated.
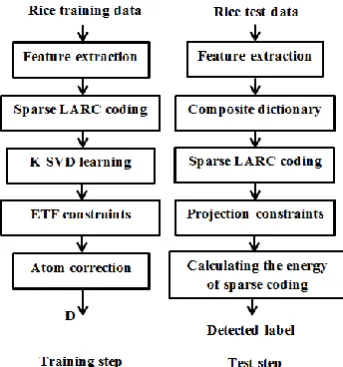
4. 2. The Proposed Classifier As mentioned, it is important in the dictionary learning that the captured atoms have the highest coherence value with the training data. Also, these atoms should have the least coherence value with each other, and with the atoms of other data classes. In this section, the proposed method for identification of the rice grains based on the incoherent dictionaries is proposed. In order to classify the rice data, the conventional classifiers such as neural network and support vector machine (SVM) are not used, but it is suggested that a dictionary-based classifier based on the extracted features of the sparse representation algorithm introduced in Section 4.1, is designed. Block diagram of the proposed method including training and test steps is shown in Figure 3.
5. SIMULATION RESULTS
Figure 3. Block diagram of the proposed rice classification method based on the learning incoherent models
This collection contains 400 color image data for each rice variety with the image size of 350×600. At first, three color channels are determined for the input data and the gray levels of each channel are calculated. Then,the feature extraction process for each channel is performed. The cardinality value in the LARC algorithm depends on the dimension of the training data. The Coh coherency parameter that was expressed in Equations (4) and (6) is set to 0.2 in all simulations. The redundancy rate for each rice data class is set to four for all features. In order to learn the dictionary in the training step, 300 images of each rice type are used and also 100 images are considered in the test step to evaluate the performance of the proposed algorithm. The performance evaluation of different methods is determined by the classification accuracy rate calculated by the percentage of test data categorized divided by the total number of test data.
5. 1. Feature Extraction based on HOG The extracted feature vector in this experiment is based on HOG coefficients with 9×9 cell size and 50% overlap and also 2×2 block size. At first, the size of input image is converted to 70×70. The dimension of HOG-based features including 36 blocks with 9×9 cell size, 9 bins and 4 directions is 1296. The cardinality rate in the training and test steps of this simulation is set to 35, which is achieved due to the smallest calculated approximation error according to the experimental results. The results of classification accuracy rate using HOG features for the different classifiers including the feed forward neural network (FFNN) with 30 hidden layers, SVM and incoherent dictionary learning technique are reported in Table 1. As shown, the classification accuracy rate for the proposed method is greater than the results of the other classifiers.
5. 2. Feature Extraction based on Gabor
According to section 3.1, the magnitude and phase of Gabor coefficients are the important features in the texture analysis using the extracted frequency components in the different directions of image. The sum of the row and column elements of the magnitude Gabor matrix is considered as the final features for dictionary learning. As a result, a 560×400 training data is used for each category of rice image. The cardinality value using these features in the training and test steps is set to 30 according to the data dimension of 560, which is estimated from the experimental tests to result in the lowest approximation error.The results of classification rate using the defined Gabor features calculated for different classifiers including a feed-forward neural network with 30 hidden layers,support vector machine, and an incoherent dictionary learning algorithm are presented in Table 2. It can be seen that the proposed classifier achieves the desired results using the magnitude feature of the Gabor coefficients. Therefore, this category of features can provide an appropriate distinction between the different data classes. In addition, along with the magnitude of the Gabor coefficients, the phase of these features is also used, and the final feature vector is set based on the column mean of the magnitude and phase matrices in order to learn the dictionaries.Therefore, a 140×400 training data for the rice image data is used. The cardinality rate for these features in the training and test steps is adjusted to 20 according to the data dimension. It means that each training data is at most represented with 20 atoms. The results of the classification accuracy rate using this category of features for the mentioned classifiers are reported in Table 3.
TABLE 1. Percentage of classification accuracy rate for rice images based on HOG features for different classifier
Proposed FFNN
SVM
90
83 82.5
Tarom rice
92.5
84.5 83
Shiroodi rice
91
89 88.5
Fajr rice
93.5
86 85
Binam rice
TABLE 2. Classification rate based on the magnitude of Gabor feature for different classifier
Proposed FFNN
SVM
96
94 92.5
Tarom rice
97.5
95 93
Shiroodi rice
96
94.5 92.5
Fajr rice
96
93.5 94
TABLE 3. Classification accuracy rate of rice classification based on the magnitude and phase of the Gabor coefficients for different classifier
Proposed FFNN
SVM
87
81.5 76
Tarom rice
86.5
80 72
Shiroodi rice
89
82.5 74.5
Fajr rice
86.5
80.5 73.5
Binam rice
It can be observed that the accuracy results of the proposed classifier are lower than the obtained results with other defined features introduced in section 3. Therefore, the combination of the magnitude and phase of the Gabor coefficients cannot adequately distinguish between the different rice types. For more consideration, the PCA algorithm is used to achieve a more appropriate set of features and solve the rice classification problem. Firstly, the magnitude and phase of Gabor coefficients in different directions are extracted (eight images for the magnitude and phase of coefficients). After averaging of these feature matrices and achieving the final matrix of magnitude and phase, the PCA algorithm is applied and the mean of the columns are calculated. Finally, a 140×400 training data matrix is obtained. The cardinality rate is set to 20 in the training and test steps because of the dimension of the Gabor/PCA combinational feature. The classification results based on this defined feature are expressed in Table 4. It can be seen that the effect of the phase properties of the Gabor coefficients to distinguish between the different classes increases by applying PCA. Also, the results of the extracted feature using PCA algorithm are shown in Table 5, which shows that this feature alone cannot achieve the appropriate results in order to solve the rice classification problem. These selected parameters from the GLCM feature are nine characteristics including mean, variance, energy, the range of relative abundances, contrast, homogeneity, maximum relative frequency, correlation, and entropy.The GLCM coefficients are calculated in the four directions of 0°, 45°, 90°, and 135°. Then, the mentioned parameters in these directions are calculated.
TABLE 4. Classification rate of rice classification based on the combination of magnitude and phase of Gabor coefficients with PCA for different classifier
Proposed FFNN
SVM
95
91.5 88.5
Tarom rice
94.5
90 87
Shiroodi rice
96.5
92.5 86
Fajr rice
96
93 90
Binam rice
TABLE 5. Classification rate of rice classification based on PCA coefficients for different classifier
Proposed FFNN
SVM
64
62 59
Tarom rice
68.5
63.5 57.5
Shiroodi rice
65.5
64 56.5
Fajr rice
67
62.5 58.5
Binam rice
As a result, a feature vector with 36 coefficients is obtained for the input image. The simulation results concluded with this dimension was not sufficient to produce this issue and did not produce a satisfactory classification rate.
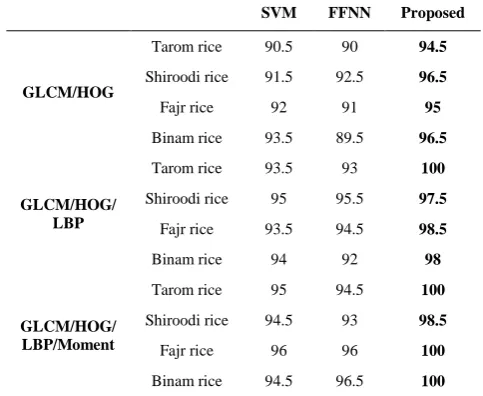
5. 3. Feature Extraction based on Combinational Feature Coefficients In this Section, the feature extraction process is investigated using GLCM coefficients. This feature vector should be used in combination with other features. Among these features, the coefficients derived from the HOG with a dimension of 1296 for each image data, a local binary pattern LBP with a dimension of 10 for each image data and moments with a dimension of 7 for each image data, which have been introduced in section 3, is applied. The results of combining these features to solve the rice classification problem are presented in Table 6. The dimension of the training matrix using the GLCM/HOG,
GLCM/HOG/LBP and GLCM/HOG/LBP/Moment
combinational properties for each rice class are 1305×400, 1315×400, and 1322×400, respectively. The cardinality rate for these features in the training and test steps is set to 30, 35 and 35, respectively.
TABLE 6. Classification rate of rice image based on the combinational feature coefficients for different classifier
Proposed FFNN
SVM
94.5
90 90.5 Tarom rice
GLCM/HOG
96.5
92.5 91.5
Shiroodi rice
95
91 92
Fajr rice
96.5
89.5 93.5
Binam rice
100
93 93.5 Tarom rice
GLCM/HOG/ LBP
97.5
95.5 95
Shiroodi rice
98.5
94.5 93.5
Fajr rice
98
92 94
Binam rice
100
94.5 95
Tarom rice
GLCM/HOG/ LBP/Moment
98.5
93 94.5 Shiroodi rice
100
96 96
Fajr rice
100
96.5 94.5
The results show that using the statistical characteristics such as the extracted parameters from the GLCM coefficients, along with the other rotation-invariant features, such as LBP and moments, leads to the desired results in the rice classification problem.
6. CONCLUSION
Classification of rice varieties and detection of its quality is one of the most widely used areas in the field of rice trade, especially in the north of Iran. This paper presents a solution to this problem based on the sparse coding and dictionary learning techniques to calculate the over-complete models. The energy of sparse coefficients is used in the procedure of classifier design. The coherence parameter is considered in the proposed dictionary learning approach. Also, different statistical and texture-based characteristics are utilized in the feature extraction procedure and the obtained results have been compared with each other. The simulation results show that the proposed rice classification algorithm correctly performed the identification of different rice varieties.
7. REFERENCES
1. Food and agriculture organization of the United nations (FAO), “ Rice Market Monitor”, (2015), Vol. 18, 1-18.
2. Neelamma, K. P., Virendra, S. M., Ravi, M. Y,. “Color and texture based identification and classification of food grains using different color models and haralick features”,
International Journal on Computer Science and Engineering, (2011), Vol. 3, 3669-3680.
3. Majumdar, S., Jayas, D. S., “Classification of cereal grains using machine vision: I. Morphology models”, Transactions of the ASAE, Vol. 43, No. 6, (2000), 1669-1675.
4. Visen, N. S., Jayas, D. S., Paliwal, J., White, N. D. G., “Comparison of two neural network architectures for classification of singulated cereal grains”, Journal of Canadian Biosystem Engineering, Vol. 46,(2004), 7-14.
5. Paliwal, J., Borhan, M. S., Jayas, D. S., “Classification of cereal grains using a flatbed scanner”, Canadian Biosystems Engineering, Vol. 46, No.3, (2004), 1-35.
6. Liu, Z. y., Cheng, F., Ying, Y. b., Rao, X. Q., “Identification of rice seed varieties using neural network”, Journal of Zhejiang University. Science.B, Vol. 6, No. 11, (2005), 1095-1100. 7. Verma, B., “Image processing techniques for grading &
classification of rice”, In International Conferences on Computer and Communication Technology, India, (2010), 220-223. 8. Jinorose, M., Prachayawarakorn, S., Soponronnarit, S.,
“Development of a computer vision system and novel evaluation criteria to characterize color and appearance of rice”, Drying Technology, Vol. 28, (2010), 1118-1124.
9. Dalen, G. V., “Determination of the size distribution and percentage of broken kernels of rice using flatbed scanning and image analysis”, Food Research International, Vol. 37, (2004),51-58.
10. Pabamalie, L., Premaratne, H., “An intelligent rice quality classifier”, International Journal of Internet Technology and Secured Transactions, Vol. 3, (2011), 386-406.
11. Hatami, M., Rahmanididar, A., Khazaee, J., “Identification of common Iranian rice varieties using machine vision techniques”, Sixth National Congress of Agricultural Machinery Engineering and Mechanization, (2010), 1-9.
12. Faiazi, S., Abaspourfard, M. H., Monajemi, S. A., Sadrnia, H., Rouhani, A., “Identification and separation of three Iranian rice products in mixed samples using texture based feature and LVQ”, Journal of Agricultural Mechanization, Vol. 1, (2013), 35-44.
13. Golpour, I., Amiripanah, J., Amirichaichan, R., Khazaee, J., “Detection of rice varieties, brown rice and white rice based on image and artificial neural network”, Journal of Agricultural Machinery, Vol. 1, No. 5, (2015), 73-81.
14. Mousavirad, S. J., Akhlaghiantab, F., “Design of an expert system to recognize the rice quality by a combination of texture properties of bulk rice samples”, Journal of Machine Vision and Image Processing, Vol. 1, No. 1, (2013).
15. Agarwal, A., Anandkumar, A., Jain, P., Netrapalli, P., Tandon, R., “Learning Sparsely Used Overcomplete Dictionaries”, JMLR: Workshop and Conference Proceedings, Vol. 35, (2014), 1-15.
16. Lee, H., Battle, A., Raina, R., Ng, A. Y., “Efficient sparse coding algorithms”, Advances in Neural Information Processing Systems, (2006), 1-8.
17. Aharon, M., Elad, M., Bruckstein, A., “K-SVD: An algorithm for designing overcomplete dictionaries for sparse representation”, IEEE Trans. Signal Process, Vol. 54, No. 11, (2006), 4311-4322.
18. Pradeep, J., Srinivasan, E., Himavanthi, S., “Neural network based recognition system integrating feature extraction and classification for english handwritten”, International Journal of Engineering Transactions B: Applications, Vol. 25, No.2, (2012), 99-106.
19. Saleh, R., Farsi, H., “Optimum ensemble classification for fully polarimetric SAR data using global-local classification approach”, International Journal of Engineering Transactions,
B: Applications, Vol. 31, No. 2,(2018), 331-338.
20. Singh, M. P., “Handwritten character recognition using modified gradient descent technique of neural networks and representation of conjugate descent for training patterns”, International Journal of Engineering Transactions A: Basics, Vol. 22, No. 2, (2009), 145-158.
21. Nixon, M., Aguado, A., “Feature Extraction & Image Processing for Computer Vision”, Third Edition, Academic Press, (2012). 22. Mathur, N. P., Gupta, S. K., “Performance analysis of feature
extraction techniques for facial expression recognition”,
International Journal of Computer Applications, Vol. 166, No. 1, (2017), 1-3.
23. Dalal, N., Triggs, B. “Histograms of oriented gradients for human detection”, In Proc. IEEE Comput. Soc. Conf. Comput. Vis. Pattern Recognit. , Vol. 1, (2005), 886-893.
24. Majumdar, S., Jayas, D. S., “Classification of cereal grains using machine vision: I. Morphology models”, Transactions of the ASAE, Vol. 43, No. 6, (2000), 1669-1675.
25. Flusser, J., Suk, T., & Zitová, B., “Moments and moment invariants in pattern recognition”, Hichester, West Sussex, U.K: J. Wiley, (2009).
26. Sigg, C. D., Dikk, T., Buhmann, J. M. “Speech enhancement using generative dictionary learning”, IEEE Transactions on Audio, Speech & Language Processing, Vol. 20, No. 6, (2012), 1698-1712.
Rice Classification and Quality Detection Based on Sparse Coding Technique
S. Mavaddati
Department of Engineering and Technology, University of Mazandaran, Babolsar, Iran
P A P E R I N F O
Paper history: Received 31 July 2018
Received in revised form 14 October 2018 Accepted 26 October 2018
Keywords:
Rice Classification Quality Detection Compressive Sensing Dictionary Learning Neural Network
هدیکچ
ییاسانش ماقرا فلتخم نآ تلاصا نییعت و جنرب هراومه ،
هب ناونع كی یساسا هلئسم رد
هصرع یاه یملع یراجتو اب طبترم
زئاح نردم یزرواشک .تسا هدوب تیمها
كینکت زا هزورما صیخشت روظنم هب ریوصت شزادرپ فلتخم یاه
ماقرا خم فلت
تلاوصحم یزرواشک یم هدافتسا یگژیو نینچمه .دوش ینتبم فلتخم یاه
هب یبایتسد یاتسار رد تفاب ای گنر رب ن
جیات
یم هتفرگ راکب هزوح نیا رد بولطم .دوش
نیارد ،هلاقم هلئسم ییاسانش ماقرا صا نییعت و جنرب نآ تلا
میهافم كمک هب
یم رارق یسررب دروم هدرشف یرگسح ب لماش میهافم نیا .دریگ
روگلا یریگراک متی
هژاو شزومآ یاه هب كنت ییامنزاب و همان
لدم هب یبایتسد روظنم لماکارف یاه
هک یراتخاس یاوتحم رگنایامن هداد
،تسا لوصحم مقر ره یاه ه .دوب دهاوخ
نینچم
هژاو همان یم یریگدای یتروص هب اه نوش
لدم هک د شزومآ یاه م لقادح هدید
تشاد رگیدکی اب ار یسودمه نازی هب .دنشاب ه
یگژیو هتسد ،بولطم جیاتن هب یبایتسد روظنم لدم یریگدای یارب و هدش جارختسا ریواصت زا یفلتخم یاه
یاه
ییامنزاب تاصخشم هدننک جنرب مقر ره
یم رارق هدافتسا دروم ریگ
ن هقبط زا لصاح جیاتن نینچمه .د ینتبم دنب
م یریگدای رب لد
زا هدمآ تسدب جیاتن اب یداهنشیپ قبط
ه یاهدنب یاقم دروم نابیتشپ رادرب نیشام و یبصع هکبش رارق هس
تفرگ تسا ه یاتن . ج
هیبش یزاس یم ناشن یاه یداهنشیپشورهکدهد
ینتبم رب هژاو همان یگژیو زا لصاح یاه یفرعم یبیکرت یاه
هب رداق هدش
نآ تلاصا نییعت و لوصحم عون ییاسانش ییلااب تقد اب
یم دشاب .
doi: 10.5829/ije.2018.31.11b.15