Effect of processing parameters on the expression efficiency of
almond oil in a mechanical expression rig
Akubude, V. C.
1, Maduako, J. N.
1, Egwuonwu, C. C.
1, Olaniyan, A. M.
2,
Ajala, E. O.
3, Ozumba, C. I.
4, Nwosu, C.
4(1. Department Agricultural and Bioresource Engineering, Federal University of Technology, Owerri, Imo State, Nigeria; 2. Department of Agricultural and Bioresources Engineering, Federal University Oye-Ekitti, Ekiti State, Nigeria;
3. Department of Chemical Engineering, University of Ilorin, Ilorin, Kwara State, Nigeria; 4. National Centre for Agricultural Mechanization, Ilorin, Kwara State, Nigeria)
Abstract: The process parameters that can affect the expression efficiency of a mechanical expression rig (MER) for almond kernel (Terminalia catappa)were investigated in an optimization study using central composite design (CCD). A four factor, five levels of CCD was applied to study the effect of moisture content (6%-10% wb), temperature (80oC-100oC), heating time
(10-26 min.) and applied pressure (5.84-7.01 MPa) using the chosen range. The physico-chemical properties of the expressed almond oil were also determined using standard procedure. The results of the study showed that all the variables significantly affected the expression efficiency at 95% confidence level. The optimum expression efficiency of 76.35% was obtained at temperature, pressure, heating time and moisture content of 93.34oC, 6.44 MPa, 17.16 minutes and 8.71% wb, respectively.
This indicates that the MER performed satisfactorily. The experimental values were very close to the predicted values with p<0.05. The regression model obtained has provided a basis for selecting optimal process parameters for the recovery of oil from almond kernel using the MER. The physico-chemical properties investigated showed that refractive index, viscosity, saponification value, iodine value, free fatty acid value, acid value, peroxide value, flash, and fire points are within the range suitable for many purposes as it showed that it was edible and conformed to CODEX standard for edible oil.
Keywords: almond seeds, mechanical expression, expression efficiency, central composite design
Citation: Akubude, V. C., J. N. Maduako, C. C. Egwuonwu, A. M. Olaniyan, E. O. Ajala, C. I. Ozumba, C. Nwosu. 2018.
Effect of processing parameters on the expression efficiency of almond oil in a mechanical expression rig. Agricultural Engineering International: CIGR Journal, 20(1): 109–117.
1 Introduction
Almond tree is one of the versatile tree nuts, perennial in nature, usually grown within the cold and temperate regions mainly as shade during hot weather or as orchard crop or for ornamental purposes (Agatemor, 2006; Agunbiade and Olanlokun, 2006; Apata, 2011; Young et al., 2004; Mirzabe et al., 2013; Nwosu et al., 2008). Almond, a very fruitful tree that has nut which contains high quality oil that is light-weight and
Received date: 2017-01-20 Accepted date: 2017-04-17 *Corresponding author: Akubude, Vivian C., Department of
Agricultural and Bioresource Engineering, P.M.B 1526, Federal University of Technology, Owerri, Nigeria. Tel: +2347034325951, Email: [email protected].
(Passey and Groslouis, 1993). However, despite these noble uses of almond oil, little work has been reported on its expression from kernel.
So far, supercritical CO2 extraction is the only method
reported in the literature for almond oil (Marrone et al., 1998). Therefore, other methods of expression can be studied. Solvent extraction using n-hexane has been widely used in lipid extraction, which can achieve almost complete recovery of oil from a sample matrix. However, unsafe handling of n-hexane and its unacceptability for food purpose, as it is harmful to human health and the environment, restrict its use in the food, cosmetic and pharmaceutical industries, hence the need for industries to search for alternative processing methods (Akanda et al., 2012; Liu et al., 2009). Therefore, mechanical expression is seen as a more favourable alternative to solvents extraction of lipids and meets the growing demand for safe natural lipids of excellent quality.
Mechanical expression involves direct application of forces to vegetable kernels in other to get oil out of it (Adejumo et al., 2013). This expression procedure includes different types of press such as hydraulic press, screw press and rolling press (Deli et al., 2011). It is more suitable for small, medium and large (commercial) capacity operations, which may be due to the fact it is economical compared with the other expression methods (Orhevba et al., 2013). Meanwhile, pre-treatments and operating conditions determine the expression efficiency of mechanical extraction. Therefore, this study investigates the effect of some pre-treatments on the expression efficiency.
The aim of this study is to evaluate the effect of temperature, heating duration, applied pressure, and moisture content on the expression efficiency of mechanical expression rig in an optimisation study using central composite design (CCD) of response surface methodology (RSM) for almond kernel. The expressed almond oil was characterized to determine the effect of the expression method on its quality.
2 Materials and methods
2.1 Description of the mechanical expression rig
(MER)
The MER that was used in this study was developed
at National Centre for Agricultural Mechanization (NCAM), Ilorin, Nigeria. It consists of a piston-cylinder rig in conjunction with hydraulic press and load cell. The piston-cylinder rig is made up of a compression piston, a press cage cylinder, a supporting platform and an oil collecting pan. The piston serves as the pressing ram and it distributes pressure from the hydraulic press evenly on the oilseed sample in the press cage cylinder. A 605 W electric band heater was installed to enfold the press cage cylinder and hence serves as a heating device for mechanical expression process. The rig is adequately instrumented with a temperature transducer to control the temperature while the pressure for expression is obtained from the digital force measuring device.
A- Plunger, B- Frame, C- Compression piston, D- Digital force measuring device, E- Press cage cylinder, F- Heating band, G- Support platform, H- Load cell, I- Hydraulic press handle, J- Temperature controller
Figure 1 Pictorial view of the mechanical oil rig 2.2 Almond seed preparation
conditioned to moisture content of 6%, 7%, 8%, 9% and 10% wb by adding the required quantity of distilled water. The conditioned samples were sealed in polyethylene bags and stored in the freezer for 48 h, to allow for even distribution of the moisture.
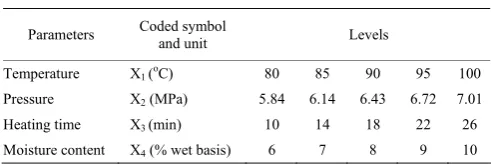
2.3 Experimental design and statistical analysis A four factor, five levels of CCD in RSM of design expert version 8.0.1 was employed for this study with parameters such as temperature (oC), pressure (MPa), heating time (min) and moisture content (% wb) coded as X1, X2, X3, and X4 respectively. The levels are
differentiated by their different values. The levels of the parameters were chosen based on literature findings and preliminary study as shown in Table 1.
Table 1 Process parameters and their levels using CCD of RSM
Parameters Coded symbol
and unit Levels
Temperature X1 (oC) 80 85 90 95 100
Pressure X2 (MPa) 5.84 6.14 6.43 6.72 7.01
Heating time X3 (min) 10 14 18 22 26
Moisture content X4 (% wet basis) 6 7 8 9 10
The experimental results obtained were analyzed using quadratic polynomial equation of the form stated in Equation (1) as generated by the design expert. The quality of the fit of the model was evaluated using analysis of variance (ANOVA).
1 2
0 1 1 1 1
n n n n
i i ii i ij i j
i i i j i
Y=β +
∑
= βx +∑
= β x +∑ ∑
=− = + β x x (1)where, Y represents the predicted response; β0 is the offset
term; βi is the linear coefficient; βii is the second-order coefficient and βij is the interaction coefficient; xi and xj are the independent variables.
2.4 Almond oil expression efficiency procedure The 80 g of the conditioned almond kernel sample with moisture content of 6% (wb) was measured into the press cage cylinder and heated at 80oC for 10 min. The pressure was gradually applied manually through the hydraulic press and the compression piston distributes pressure on the kernel sample in the cylinder. The almond kernel thereby released the oil which flows through the mesh into the oil collector. The applied pressure was measured by digital force measuring unit through the load cell data cable connected to it. The press cage cylinder was dismantled and the residual cake was extruded. The
process was repeated for the various ranges of parameters. The expression efficiency and process loss was determined using the equations given by Adejumo et al. (2013) and Olaniyan and Oje (2007) as stated in Equations (2) and (3), respectively:
% Expression efficiency EE( ) Woe 100
Wt
= × (2)
( )
% Process loss PL( ) Wus Wrc Woe
Wcs
− +
= (3)
where, Wcs = weight of crushed almond seed sample, g;
Woe = weight of oil expressed, g; Wcs = weight of crushed almond seed sample, g; Wrc = weight of residual cake after expression, g; Woe = weight of oil expressed, g.
2.5 Physico-chemical characteristics of almond oil The expressed oil samples from the almond kernel obtained at different pre-treatment conditions were characterized to determine their physico-chemical properties such as, acid value (AV), iodine value (IV), saponification values (SV), peroxide value (PV), refractive index (RI), free fatty acid (FFA), viscosity (V), flash point (FLP), fire point (FIP), colour and pH using the procedures described by International Union of Pure and Applied Chemistry Commission on Oils, Fats and Derivatives (IUPAC, 1987) except for pH that was determined using the method described by Dagnachew et al. (2015).
3 Result and discussion
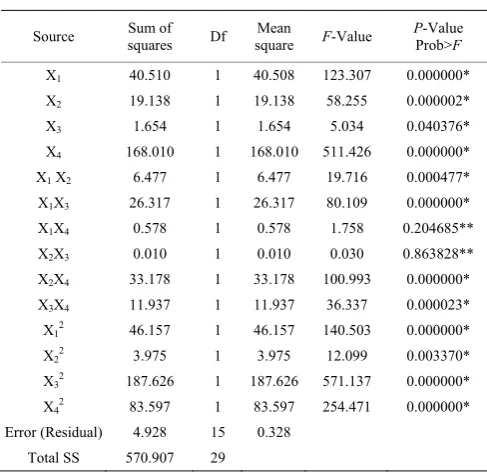
3.1 Expression efficiency of almond oil
The result of the experiment is shown in Table 2. The individual, interactive and quadratic effects of the parameters on the expression efficiency were evaluated. The ANOVA result obtained is shown in Table 3. From the ANOVA, the individual, interactive and quadratic effects show significant effect with p value <0.05. However, the interaction between temperature and moisture content (X1X4) and pressure and heating time
(X2X3) were insignificance. The F-values also indicate
Table 2 Experimental design matrix and results for the expression efficiency
Process parameters Expression efficiency (EE %) Run X1,
◦C X2,
MPa X3,
min X4,
% wb Actual Predicted Residual 1 85 6.14 14 7 61.52 61.360 0.160 2 95 6.14 14 7 64.56 64.870 –0.310 3 85 6.72 14 7 64.68 64.698 –0.018 4 95 6.72 14 7 70.51 70.754 –0.244 5 85 6.14 22 7 65.14 65.077 0.063 6 95 6.14 22 7 63.06 63.458 –0.398 7 85 6.72 22 7 68.61 68.516 0.094 8 95 6.72 22 7 69.11 69.441 –0.331 9 85 6.14 14 9 70.94 70.879 0.061 10 95 6.14 14 9 74.81 75.150 –0.340 11 85 6.72 14 9 68.61 68.457 0.153 12 95 6.72 14 9 74.94 75.273 –0.333 13 85 6.14 22 9 71.14 71.141 –0.001 14 95 6.14 22 9 70.03 70.282 –0.252 15 85 6.72 22 9 68.86 68.820 0.040 16 95 6.72 22 9 70.10 70.506 –0.406 17 80 6.43 18 8 66.38 66.914 –0.534 18 100 6.43 18 8 73.16 72.111 1.049 19 90 5.84 18 8 71.67 71.422 0.248 20 90 7.01 18 8 75.22 74.962 0.258 21 90 6.43 10 8 64.94 64.762 0.177 22 90 6.43 26 8 64.05 63.712 0.338 23 90 6.43 18 6 62.66 62.426 0.234 24 90 6.43 18 10 73.29 73.009 0.281 25 90 6.43 18 8 75.19 74.704 0.486 26 90 6.43 18 8 73.42 74.704 –1.284 27 90 6.43 18 8 74.94 74.704 0.236 28 90 6.43 18 8 75.19 74.704 0.486 29 90 6.43 18 8 74.68 74.704 –0.024 30 90 6.43 18 8 74.81 74.704 0.106
Table 3 ANOVA for expression efficiency of MER for almond oil
Source Sum of squares Df square Mean F-Value PProb>-Value F X1 40.510 1 40.508 123.307 0.000000*
X2 19.138 1 19.138 58.255 0.000002*
X3 1.654 1 1.654 5.034 0.040376*
X4 168.010 1 168.010 511.426 0.000000*
X1 X2 6.477 1 6.477 19.716 0.000477*
X1X3 26.317 1 26.317 80.109 0.000000*
X1X4 0.578 1 0.578 1.758 0.204685**
X2X3 0.010 1 0.010 0.030 0.863828**
X2X4 33.178 1 33.178 100.993 0.000000*
X3X4 11.937 1 11.937 36.337 0.000023*
X12 46.157 1 46.157 140.503 0.000000*
X22 3.975 1 3.975 12.099 0.003370*
X32 187.626 1 187.626 571.137 0.000000*
X42 83.597 1 83.597 254.471 0.000000*
Error (Residual) 4.928 15 0.328 Total SS 570.907 29
Figure 2 shows the interaction effect of pressure and temperature on expression efficiency. Expression efficiency increases with pressure at constant temperature, heating time and moisture content. It is also observed that the efficiency decrease or level off as the pressure increases from 6.72 to 7.01 MPa. This observation may be due to the blocking of oil path between some inter-kernel voids, because of compaction of particles which results to low yield thereby leading to decrease in expression efficiency.
Note: Where ‘*’ denotes those factors significant at 5% confidence level, while ‘**’ denotes insignificant terms.
Figure 2 Response surface plot showing the combined effect of interaction of pressure and temperature on expression efficiency
This temperature trend is in agreement with previous works which attribute this behavior of oilseed to the fact that heat coagulates the protein and reduces the viscosity of the oil thereby facilitating oil expression process as moisture reduction takes place simultaneously. At higher temperature, prolonged heat treatment causes a substantial moisture loss leading to hardening of oil seed sample which best explains the reason behind the reduction in yield at higher temperature (Alonge et al., 2003; Akubude et al., 2017; Bamgboye and Adejumo, 2011; Ajibola 1993) which resulted to decrease in expression efficiency.
Figure 3 shows the interaction effect of heating time and temperature on expression efficiency. Increase in temperature and heating time favours expression efficiency as pressure and moisture content are held constant. High expression efficiency of 73.16% and 64.05% were obtained at high temperature of 100°C and
expression efficiency of 66.38% and 64.94% were obtained at low temperature of 80°C and heating time of
10 minutes, respectively at constant pressure of 6.43 MPa and moisture content of 8% wb.
Figure 3 Response surface plot showing the combined effect of interaction of heating time and temperature on expression
efficiency
Figure 4 shows the interaction effect of moisture content and temperature on expression efficiency. Expression efficiency increases with increase in moisture content and temperature at constant pressure and heating time. At pressure of 6.43 MPa and heating time of 18 minutes, expression efficiency increased from 62.66% to 75.19% as moisture content increased from 6% wb to 8% wb but reduces as moisture content increases to 10% wb. Low expression efficiency of 66.38% was obtained at 80°C and high expression efficiency of
73.16% at 100°C as shown in Table 2.
Figure 4 Response surface plot showing the combined effect of interaction of moisture content and temperature on expression
efficiency
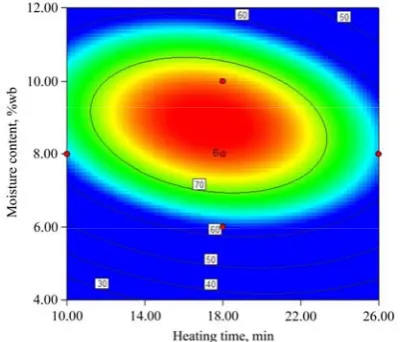
Figure 5 shows the interaction effect of heating time and pressure on expression efficiency. Expression efficiency decreases from 64.94% to 64.05% as heating time increases from 10 minutes to 26 minutes but increases from 71.67% to 75.22% as pressure increases from 5.84 MPa to 7.01 MPa as shown in Table 2.
Figure 5 Response surface plot showing the combined effect of interaction of heating time and pressure on expression efficiency
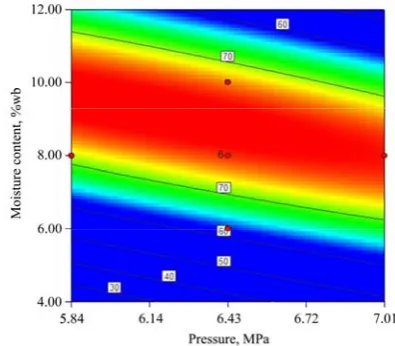
Figure 6 shows the interaction effect of moisture content and pressure on expression efficiency. The expression efficiency increases as moisture content and pressure increases but reduces as moisture content is further increased. And Table 2 further shows that increase in moisture content from 8% wb to 10% wb results in decrease in expression efficiency from 75.19% to 73.29%.
Figure 6 Response surface plot showing the combined effect of interaction of moisture content and pressure on expression
efficiency
expression efficiency increases from 62.66% to 75.19% but reduces to 73.29 % as the moisture content increases to 10% wb. But high expression efficiency of 64.94% was obtained at low heating time of 10 minutes and low expression efficiency of 64.05% was obtained at high heating time of 26 minutes. Although, the difference between the two expression efficiency is quite small (0.89%), but it is an indicator that low heating time favours more oil yield and hence high expression efficiency.
Figure 7 Response surface plot showing the combined effect of interaction of moisture content and heating time on expression
efficiency
3.2 Regression model and optimization
The regression model developed using design expert is given as:
Y3 (%) = 74.70+2.60X1+1.78X2-0.53X3+5.29X4+
1.27 X1 X2–2.56X1X3–2.88X2X4–1.73X3X4–
2.60X12–0.75 X22–5.23X32–3.49X42
(R2 = 0.991 and adjusted, R2 = 0..983)
The correlation coefficient (R-squared) of the model analysis was found to be 0.991. The model above was used to make predictions as shown in Table 2. The actual value and predicted values are not statistically different at
p<0.05. Hence, making the model fit for making prediction.
Through numerical optimization, the optimum parameters for optimum expression efficiency of 76.35% was obtained at temperature, pressure, heating time and moisture content of 93.34oC, 6.44 MPa, 17.16 min and 8.71% wb, respectively.
3.3 Physio-chemical properties of oil
The result of both chemical and physical quality
parameters of the oil samples produced are shown in Table 4.
3.3.1 Acid value
This ranges from 1.009 to 2.693 mg/NaOH/g within the range of process parameters used as shown in Table 4. The range of values for acid value is within the range of values given as standard for edible oils as 0.6- 10 mg/KOH/g (CODEXSTAN, 1999). Acid value is a pointer to the edibility of oils and quality of fatty acids in oils which serves as an indicator to the presence and extent of hydrolysis by lipolytic enzymes and oxidation.
The low acid value assures the oil stability and protection against rancidity and peroxidation (Aremu et al., 2015). Hence, almond oil is suitable for cooking but not for liquid soap, shampoos and paint production because of its low acid value.
3.3.2 Free fatty acid value
From Table 4, free fatty acid value ranges from 0.505 to 1.346 mg/NaOH. This is within the range given in literature as 0.39-20.05 mg/NaOH/g for almond oil (Aremu et al, 2015). FFA is a key feature linked with the quality and commercial value of oils and fats (Mahesar et al.,2014). In fact, high quality oils are low in FFA which makes it more palatable to man (Aremu et al., 2015). Its low value makes it quality oil that can compete with other vegetable oils in the market.
3.3.3 Saponification value
This ranges from 125.6-128.6 mg/NaOH/g as shown in Table 4. Saponification value measures the level of oxidation and deterioration of oils during storage and high value of it is desirable. Its high value is an indication that almond oil contains high proportion of lower fatty acids and hence edible (Aremu et al., 2015).
3.3.4 Iodine value
Table 4 shows that iodine value of almond oil ranges from 60.6-69.4 (mg I2/g). Aremu et al. (2015) reported
that oils with iodine value less than 100 g I2/100 g of oil
Table 4 Physico-chemical properties of almond oil
Parameters Chemical properties Physical properties S/N
X1 X2 X3 X4 AV FFA SV IV PV R.I pH FIP FLP V.I
1 85 6.14 14 7 1.920 0.960 126.1 64.10 2.760 1.4828 5.50 261 214 48.4 2 95 6.14 14 7 1.795 0.897 128.1 65.60 2.806 1.4861 5.52 262 213 47.6 3 85 6.72 14 7 2.356 1.178 127.4 65.00 2.808 1.4859 5.51 261 212 51.8 4 95 6.72 14 7 2.693 1.346 128.0 65.10 2.802 1.4860 5.50 262 210 46.6 5 85 6.14 22 7 2.693 1.346 127.9 65.20 2.801 1.4850 5.49 262 214 51.8 6 95 6.14 22 7 1.795 0.897 127.8 65.40 2.803 1.4860 5.51 261 212 46.9 7 85 6.72 22 7 1.800 0.900 123.1 63.90 2.700 1.4830 5.43 262 209 44.6 8 95 6.72 22 7 1.795 0.897 128.1 60.90 2.804 1.4857 5.51 261 214 47.8 9 85 6.14 14 9 1.967 0.954 128.0 64.80 2.803 1.4862 5.50 262 210 48.7 10 95 6.14 14 9 1.335 0.668 126.6 66.50 2.810 1.4856 5.49 261 208 46.9 11 85 6.72 14 9 1.571 0.785 125.6 67.20 2.800 1.4852 5.50 261 200 44.6 12 95 6.72 14 9 1.967 0.954 128.0 67.20 2.804 1.4861 5.50 261 212 48.9 13 85 6.14 22 9 1.967 0.954 127.8 66.20 2.801 1.4857 5.51 261 209 47.6 14 95 6.14 22 9 1.009 0.505 128.4 63.80 2.800 1.4860 5.50 261 208 48.3 15 85 6.72 22 9 2.580 1.290 127.6 69.40 2.806 1.4860 5.50 262 212 47.2 16 95 6.72 22 9 1.967 0.954 128.0 64.80 2.803 1.4862 5.50 262 210 48.7 17 80 6.43 18 8 1.680 0.840 122.08 65.80 2.810 1.4826 5.46 260 212 48.7 18 100 6.43 18 8 1.009 0.505 128.0 63.40 2.811 1.4i62 5.50 260 214 52.0 19 90 5.84 18 8 1.346 0.673 128.6 67.40 2.813 1.4863 5.52 261 215 51.2 20 90 7.01 18 8 1.967 0.954 128. 64.80 2.803 1.4862 550 262 210 48.7 21 90 6.43 10 8 1.571 0.785 128.2 65.70 2.808 1.4861 5.49 261 208 46.2 22 90 6.43 26 8 1.335 0.668 126.6 66.20 2.806 1.4858 5.50 260 212 52.0 23 90 6.43 18 6 1.683 0.842 128.4 66.20 2.806 1.4858 5.50 261 211 48.9 24 90 6.43 18 10 1.967 0.954 128.0 64.80 2.803 1.4862 5.50 262 210 48.7 25 90 6.43 18 8 1.967 0.954 128.0 64.80 2.803 1.4862 5.50 262 210 48.7 26 90 6.43 18 8 1.346 0.673 127.4 66.60 2.810 1.4861 5.49 260 210 48.2 27 90 6.43 18 8 1.790 0.897 128.1 66.80 2.812 1.4860 5.48 260 213 48.9 28 90 6.43 18 8 1.795 0.897 128.1 66.00 2.811 1.4861 551 262 213 50.6 29 90 6.43 18 8 2.580 1.290 127.4 66.40 2.803 1.4860 5.50 262 211 46.2 30 90 6.43 18 8 1.967 0.954 128.0 64.80 2.803 1.4862 5.50 262 210 48.7
3.3.5 Peroxide value
This is the most common indicator of lipid oxidation (Aremu et al., 2015). It ranges from 2.7-2.812 (Meq/g) as shown in Table 4. Oxidation of oils is the major cause of oil deterioration (Gunstone, 2002) and high peroxide values indicates high levels of oxidative rancidity. According to Aremu et al. (2015), the permitted maximum peroxide value for standard quality oil is 10 milliequivalents of active oxygen/kg oil (CODEX-STAN, 1999). Hence, the almond oil produced is a good quality oil based on its low peroxide value which is within the range of standard acceptable for edible oils.
3.3.6 Refractive index
This is used in quality control for establishing oil purity, observing the progress of reaction rapidly and for source oil identification (Gunstone, 2002). The range of values (1.4826-1.4863) for almond oil produced is within
the acceptable range given in codex standards for fats and oil (CODEX-STAN, 1999).
3.3.7 pH values
From Table 4, the pH values of almond oil produced ranges from 5.43-5.52 which indicates that the oil is acidic in nature probably because of its free fatty acid content.
3.3.8 Fire point and flash point
200-215oC, respectively as shown in Table 4. And in
relation to the FFA content which ranges from 0.505- 1.346 which is low, hence giving reason to their high values. This shows that this is a desirable quality since quality oils are expected to have low FFA content.
3.3.9 Viscosity
Low viscosity indicates that the oil is light and maybe highly unsaturated. High viscosity values sometimes might be as a result of suspended particles in crude oil. The more viscous a vegetable oil is, the better it is used as a lubricant. Table 4 shows that the almond oil produced within the chosen range of process parameters had a
viscosity value ranging from 44.6-52 c.p which is low when compared to that of shea butter that ranges from 80-100 c.p (Olaniyan and Oje, 2007).
3.3.10 Colour
Figure 8 shows the colour variation of the almond oil produced within the selected range of process parameters. The numbering on the oil sample bottle represents the run number as shown in Table 2. This indicates that the dominant colour of almond oil produced is light yellow with variation in intensity which is golden at process parameters with high temperature, heating time and low moisture content.
Figure 8 Colour variation of almond oil samples produced
4 Conclusion
This study on the effect of process parameters on expression efficiency of mechanically expressed almond oil using CCD revealed that all the four variables had significant effect on expression efficiency. Moisture content had the most significant effect while heating time had the least effect on expression efficiency. Optimum expression efficiency of 76.35% was obtained at temperature, pressure, heating time and moisture content of 93.34oC, 6.44 MPa, 17.16 min and 8.71% wb respectively. This implies that mechanical expression method used performed satisfactorily well even though there is need to further develop it through improving the expression and energy efficiency and by increasing their handling capacities. This approach can be of great help in recovery most of the oil from the kernel. Finally, the
physio-chemical properties of the oil conform to the CODEX standard for edible oil.
Acknowledgement
We are grateful to the Department of Agricultural and Bioresource Engineering in Federal University of Technology, Owerri, Imo state, Nigeria, Daniel Jemirin of Chemistry Department University of Ilorin and National Centre for Agricultural Mechanization, Ilorin, Kwara state, Nigeria.
References
Adejumo, B. A., A. T. Alakowe, and D. E. Obi. 2013. Effect of heat treatment on the characteristics and oil yield of moringa oleifera seeds. International Journal of Engineering and Science, 2: 232–239.
Effect of processing on the quality, composition and antioxidant properties of Terminalia catappa (indian almond) seed oil. African Journal of Food, Agriculture, Nutrition and Development, 13(3): 7662–7678.
Agatemor, C. 2006. Studies of selected physicochemical properties of fluted pumpkin (telfairia occidentalis Hook F.) seed oil and tropical almond (Terminalia catappia L.) seed oil. Pakistan Journal of Nutrition, 5(4): 306–307.
Agunbiade, S. O., and J. O. Olanlokun. 2006. Evaluation of some nutritional characteristics of Indian almond (Prunus amygdalus) nut. Pakistan Journal of Nutrition, 5(4): 316–318. Ajibola, O. O., O. K. Owolarafe, O. O. Fasina, and K. A. Adeeko.
1993. Expression of oil from sesame seeds. Canada Agricultural Engineering, 35(1): 83–88.
Akanda, M. J. H., M. Z. I. Sarker, S. Ferdosh, M. Y. A. Manap, N. N. N. A. Rahman, and M. O. A. Kadir. 2012. Applications of supercritical fluid extraction (SFE) of palm oil and oil from natural sources. Molecules, 17(2): 1764–1794.
Akubude, V. C., J. N. Maduako, C. C. Egwuonwu, A. M. Olaniyan, I. C. Ozumba, C. Nwosu, O. E. Ajala. 2017. Effect of process parameters on oil yield mechanically expressed from almond seed (using response surface methodology). American Journal of Food Science and Nutrition Research, 4(1): 1–8.
Alonge, A. F., A. M. Olaniyan, K. Oje, and C. O. Agbaje. 2003. Effects of dilution ratio, water temperature and pressing time on oil yield from groundnut oil expression. Journal of Food Science Technology-Mysore, 40: 652–655.
Aniyan, A. M., and K. Oje. 2007. Development of mechanical expression rig for dry extraction of shea butter from shea kernel. Journal of Food Science Technology-Mysore, 44(5): 465–470.
Apata, D. F. 2011. Effect of Terminalia catappa fruit meal fermented by Aspergillus niger as replacement of maize on growth performance, nutrient digestibility, and serum biochemical profile of broiler chickens. Biotechnology Research International, vol. 11, Article ID 907546.
AOAC. 1990. Official Methods of Analysis of AOAC International. Washington, DC, USA: AOAC.
Aremu, M. O., H. Ibrahim, and T. O. Bamidele. 2015. Physicochemical characteristics of the oils extracted from some Nigerian plant foods – A review. Chemical and Process Engineering Research, 32: 36–52.
Bamgboye, A. I., and O. I. Adejumo. 2011. Effects of processing parameters of Roselle seed on its oil yield. International Journal of Agricultural and Biological Engineering, 4(1): 82–86.
CODEX STAN 210. 1999. Codex standard for named vegetable oils. Rome, Italy: Codex Alimentarius Commission, Joint FAO/WHO Food Standards Programme, FAO.
Dagnachew, Y., Y. Asteraye, T. Mensigitu, and M. Anaz. 2015. Extraction and physico-chemical characterization of Cordia africana Lam Seed Oil. Journal of Advanced Botany and Zoology, 3(4): 1–5.
Deli, S., M. Farah Masturah, Y. Tajul Aris, and W. A. Wan Nadiah. 2011. The effects of physical parameters of the screw press oil expeller on oil yield from Nigella sativa L seeds. International Food Research Journal, 18(4): 1367–1373.
Gunstone, F. D. 2002. Vegetable Oil in Food Technology: Composition, Properties and Uses. Boca Raton, USA: CRC Press.
IUPAC. 1987 Standard Methods for the Analysis of Oils, Fats and Derivatives. 7th ed. Osney Mead, London: Blackwell Scientific Publications.
Liu, W., Y. Fu, Y. Zu, M. Tong, N. Wu, X. Liu, and S. Zhang. 2009. Supercritical carbon dioxide extraction of seed oil from Opuntia dillenii Haw. and its antioxidant activity. Food Chemistry, 114(1): 334–339.
Mahesar, S. A., S. T. H. Sherazi, A. R. Khaskheli, and A. A. Kandhro. 2014. Analytical approaches for the assessment of free fatty acids in oils and fats. Analytical Methods, 6(14): 4956–4963.