An Early Performance Study of Large-scale
POWER8 SMP Systems
Xing Liu∗, Daniele Buono∗, Fabio Checconi∗, Jee W. Choi∗, Xinyu Que∗, Fabrizio Petrini∗, John A. Gunnels∗, Jeff A. Stuecheli†
∗Data Centric Systems, IBM T. J. Watson Research Center, Yorktown Height, NY Email:{xliu, dbuono, fchecco, jwchoi, xque, fpetrin, gunnels}@us.ibm.com
†IBM Systems Group, Austin, TX
Email: [email protected]
Abstract—In this paper we evaluate the performance of a large-scale POWER8 symmetric multiprocessor (SMP) sys-tem with eight processors. We focus our attention on cache and memory subsystems, analyzing the characteristics that have a direct impact on high-performance computing and analytics applications. We provide insight into the relevant characteristics of the POWER8 processor using a set of micro-benchmarks. We also analyze the POWER8 SMP at the system level using the well–known roofline model. Using the knowledge gained from these micro-benchmarks, we optimize three applications and use them to assess the capabilities of the POWER8 system. The results show that the POWER8–based SMP system is capable of delivering high performance for a wide range of applications and kernels.
I. INTRODUCTION
We present an early performance evaluation of the POWER8 processor for large–scale data analytics and high performance computing applications. We focus on the char-acteristics of POWER8 that have a direct impact on the performance of these applications – high memory capacity and bandwidth, low latency access to irregular data, a high degree of available parallelism, and more, using a large– scale symmetric multiprocessor (SMP) system with eight POWER8 processors.
First, we describe and highlight the new features of the POWER8 processor in comparison to its predecessor, the POWER7 [17] (§II-A). Most notably, the number of hardware threads per core has been doubled from four to eight, along with the sizes of the caches to maintain a constant per thread memory footprint. This helps to expose parallelism, hide instruction and data latency, and keep the execution resources busy.
We also describe the system architecture of a many– core SMP system based on the POWER8 processor (§II-B). The largest POWER8 SMP can host up to 16 processors (sockets) and 16 TB of memory, which can deliver 6,144 GFLOP/s of performance (double–precision) and 3,686 GB/s of memory throughput when running at 4 GHz.
Second, we use a set of microbenchmarks to conduct a detailed study of some of the low-level features of the POWER8 processor (§III). We focus on the memory subsystem in particular, including the DRAM, the cache, and the chip-to-chip interconnect. Our results show that we can achieve over 80% of the theoretical peak DRAM bandwidth – however, this requires using all available cores and threads, which emphasizes the need to expose as much
parallelism as possible for data intensive applications. We also demonstrate the benefit of hardware multithreading and advanced prefetching mechanisms on random access performance; on our synthetic microbenchmark, we achieve as much as 41% of the theoretical peak DRAM bandwidth. In addition to our low–level evaluation, we analyze a POWER8 SMP at the system level using the well known roofline model (§IV). Thanks to its balance, the POWER8 SMP system can deliver a high level of performance even for data intensive kernels, which include, but not lim-ited to, sparse matrix–vector multiply, 3D stencil, Lattice– Boltzmann magnetohydrodynamics, and 3D Fast Fourier transform.
Lastly, we evaluate the POWER8 SMP system using three large–scale and data intensive applications (§V); these in-clude all–pairs Jaccard similarity – a graph analytics kernel for finding textual similarity, Hartree–Fock calculation – a quantum chemistry kernel for solving the Schr¨odinger equation, and sparse matrix vector multiply – an essential linear algebra kernel. We show that in all three applications, an eight socket POWER8 SMP system achieves excellent performance, comparable to the start-of-the-art results. Our work demonstrates that POWER8 SMP system can be used to efficiently handle much larger data sets – an essential feature for large–scale analytics problems, without the need for complex distributed algorithms.
II. OVERVIEW OF THEPOWER8 ARCHITECTURE AND ITSSMP SYSTEMS
A. The POWER8 Processor
POWER8 is the latest RISC microprocessor of the IBM Power architecture family. It is designed to significantly im-prove socket-level, core-level and thread-level performance over its predecessor – POWER7, while maintaining per processor power consumption at the same level. This is achieved through a combination of a modest increase in core count per processor and numerous improvements in the microarchitecture [27], [28].
Compared to POWER7, a notable improvement in the POWER8 processor core is the hardware thread parallelism, which has been boosted from 4-way simultaneous mul-tithreading (SMT) to 8-way SMT per core. This design choice benefits business and data analytics applications that require high system throughput. The sizes of the L1 data, L2 and L3 caches per core has also been doubled in order to
maintain the same amount of resident memory footprint for each thread. With more execution pipelines, POWER8 has a much higher instruction throughput than POWER7: while a POWER7 core can issue 8 and commit 6 instructions in a given cycle, a POWER8 core can issue 10 and commit 8 instructions per cycle. A high-level architectural comparison between POWER7 and POWER8 is given in Table I.
Table I: POWER7 and POWER8 at a glance.
POWER7 POWER8
Threads/core 4 8
Maximum cores/processor 8 12
L1 instruction cache/core 32 KB 32 KB
L1 data cache/core 32 KB 64 KB
L2 cache/core 256 KB 512 KB
L3 cache/core 4 MB 8 MB
L4 cache/processor N/A up to 128 MB
Instruction issue/cycle/core 8 10
Instruction completion/cycle/core 6 8 Load/store operations/cycles 2 load/2 store 4 load/2 store
POWER8 includes four cache levels, with a constant 128–byte line size. The cache hierarchy consists of a store-through L1 data cache, a store-in L2 cache, and an eDRAM-based L3 cache with a per-core capacity of 64 KB, 512 KB, and 8 MB, respectively. The L3 cache of POWER8 is a NUCA (Non-Uniform Cache Architecture) design, with each L3 also serving requests for other cores, and working as a victim cache for other L3s [29]. With the largest configuration of 12 cores per processor, a POWER8 processor can host 96 MB of aggregated L3 cache, shared by all the cores.
In addition, POWER8 includes a fourth cache level of up to 128 MB, which is implemented in eight external memory chips called Centaur. Each Centaur chip contains 16 MB of eDRAM, and serves as both L4 cache and memory controller. By moving the memory controller to the Centaur chip, both memory bandwidth and capacity are significantly increased, relative to POWER7. POWER8 connects to Centaur chips using separate links for read and write operations, with two links for memory reads and one link for memory writes. Thus, POWER8 has asymmetric read and write bandwidth, and the peak memory throughput can be achieved with a read to write ratio of 2 to 1.
A Centaur chip can support up to 128 GB of DRAM and provides 19.2 GB/s read and 9.6 GB/s write bandwidth. Each POWER8 processor can be linked to four or eight Centaur chips, depending on the model, allowing for a maximum memory capacity of 1 TB per processor, with up to 128 MB of aggregated L4 cache and 230 GB/s of sustainable memory bandwidth (using a memory read to write ratio of 2:1) in and out of the processor.
B. POWER8 SMP Systems
A POWER8 SMP system can host up to 16 processors (sockets), each of which can contain one or two POWER8 processor chips. We note here that the term “processor chip” is used to refer to a processor die rather than a physical processor. A POWER8 processor can contain a maximum of 12 cores, and this can be either a single chip of 12 cores or two chips of 6 cores.
With a 4 GHz clock and eight Centaur chips per socket, the largest POWER8 SMP system (192-way SMP) can deliver 6,144 GFLOP/s of double–precision performance and 3,686 GB/s memory bandwidth with an aggregate L4 cache 4 GB in size and memory capacity of 16 TB.
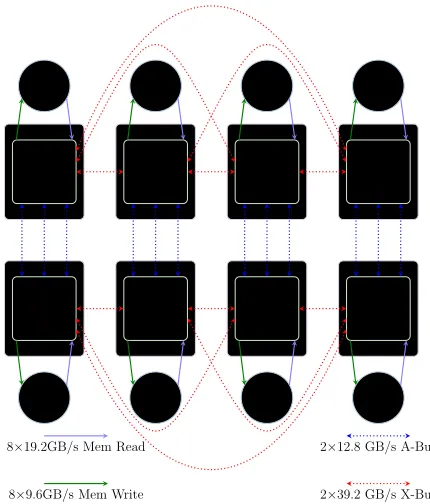
The off-chip SMP interconnect uses two types of links, X-Bus and A-Bus. The X-Bus link connects processor chips within a group. The POWER8 processor chip has three such links, enabling direct connection to 3 other chips, in order to create a four-chip group. The A-bus link connects each chip in a group to its corresponding chip in another group. Three A-bus links are provided per chip to support a total of four groups. Both the X-bus and A-bus are bi-directional links with a unidirectional bandwidth of 39.2 GB/s and 12.8 GB/s respectively.
Chip 0 Chip 1 Chip 2 Chip 3
Chip 4 Chip 5 Chip 6 Chip 7
Mem 0 Mem 1 Mem 2 Mem 3
Mem 4 Mem 5 Mem 6 Mem 7
Socket 0 Socket 1 Socket 2 Socket 3
Socket 4 Socket 5 Socket 6 Socket 7
8×19.2GB/s Mem Read
8×9.6GB/s Mem Write
2×12.8 GB/s A-Bus
2×39.2 GB/s X-Bus
Figure 1: High-level block diagram of E870.
Our performance evaluation was done on an 8–socket SMP system, the IBM Power System E870 (E870), with each socket containing an 8–core POWER8 chip running at 4.35 GHz. The high-level system architecture of the E870 is shown in Figure 1, and a summary of key parameters is shown in Table II.
III. MICROBENCHMARKRESULTS
In this section, we use a set of microbenchmarks to characterize the low-level performance of the POWER8 processor, with a focus on its cache, memory and “chip– to–chip” interconnect subsystems.
A. Local Memory Performance
Table II: Characteristics of the IBM Power System E870 used in performance evaluation.
E870
Sockets 8
Chips 8
Cores 64
Centaur chips 64
Core-clock rate 4.35 GHz
Memory 2 TB
Peak performance 2,227 GFLOP/s Peak bandwidth 1,843 GB/s
0.4 1.6 6.4 25.6 102.4
0.00
049
0.00977 0.02
344
0.04297 0.07
813
0.14063 0.25000 0.46
875
0.87500
1.62
5 3
5.5 10 18 32 60 11
2
208 384 70
4
1280 23
04
4096 76
80
La
te
ncy
(ns)
Array size (MB)
64 KB page 16 MB page
64 KB L1 512 KB L2
8 MB local L3 64 MB L3
128 MB L4
Figure 2: Observed memory read latency on E870.
set [24] with the hardware data prefetching disabled. The results are shown in Figure 2, in which the red and blue lines shows the measurements of using the regular page size (64 KB) and the huge page size (16 MB) respectively. In the figure, the cache hierarchy of the POWER8 can be clearly differentiated, with each plateau representing a separate cache level. While each L3 cache can function as a victim cache of other L3 caches, the results show that accessing a remote L3 cache incurs greater latency than accessing the local L3 cache. The gradual slope after the remote L3 is due to the hits in the L4 cache. We see that an L4 hit reduces the latency of an L3 miss by over 30 ns. It also worth noting the differences between the red and blue curves. We see a small spike at the 3 MB data point for the blue line, which is caused by the first level TLB misses.
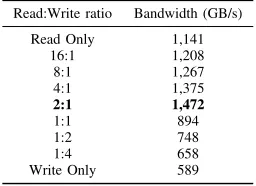
Table III shows the observed memory bandwidth from local memory with different read to write ratios on E870. This was measured using a modified STREAM bench-mark, optimized for the POWER8 processor. The modified STREAM benchmark uses all the 64 cores of E870 with 8 threads per core. As expected, the best measured memory bandwidth is achieved when the ratio of memory read to write is 2:1. The measured peak memory bandwidth is 1,472 GB/s, which represents 80% of the specification’s peak bandwidth.
Using the same benchmark we also measured how mem-ory bandwidth scales with the number of threads and cores. Figure 3 shows the sustained memory bandwidth for two cases: a) using only one core and increasing the number of threads per core, and (b) using only one chip and increasing the number of cores and threads per core. In this test, we used a memory read to write ratio of 2:1 to maximize bandwidth utilization. For a single core, the
Table III: Observed memory bandwidth with various ratios of read to write.
Read:Write ratio Bandwidth (GB/s)
Read Only 1,141
16:1 1,208
8:1 1,267
4:1 1,375
2:1 1,472
1:1 894
1:2 748
1:4 658
Write Only 589
measured peak bandwidth is approximately 26 GB/s. The aggregate memory bandwidth per chip increases with the number of cores and the number of threads per core, and the maximum 189 GB/s is achieved when all cores and all threads are used. These results confirm the need for a high degree of multithreading to hide the memory latency and reach the peak memory bandwidth.
B. SMP Interconnect Performance
Table IV shows access latencies and bandwidths (for memory reads) between different chips. This was measured by using the lmbench tool set and the modified STREAM benchmark, allocating memory on specific sockets by ex-ploiting low-level operating system facilities. Given the bi-directional nature of the SMP interconnection, we are not forced to use a particular mix of read and write operations to fully exploit the chip-to-chip links.
The results confirm the SMP interconnect bandwidth shown in Figure 1. The measured memory latencies within a chip group are 2×smaller than those between chip groups. The memory latency between Chip0 and Chip4 is slightly lower than that between Chip0 and Chip5-7. This is because Chip0 and Chip4 are directly connected, while all the others are connected by a indirect route with at least one hop. We also see that the latencies within a chip group are slightly different. This is because of the layout of the chips.
It is interesting to note that the measured bandwidth within a chip group is lower than that between chip groups. This result seems counter-intuitive because the X-bus has higher bandwidth than A-Bus. The routing protocol of the POWER8 interconnect only allows one route for the traffic inside a chip group, while multiple routes are used for the inter-group traffic, explaining the behavior.
We also measured the aggregate bandwidth for all the A-buses and X-A-buses. In this benchmark we let all the cores of the system generate requests, and by carefully allocating memory on specific nodes we maximized the utilization of the chip-to-chip links.
12 16 20 24 28
1 2 3 4 5 6 7 8
Bandwi
dth (GB/s)
Number of Threads
(a)
10 50 90 130 170 210
1 2 3 4 5 6 7 8
Bandwidth (GB/s)
Number of cores
8 Threads/Core
4 Threads/Core
2 Threads/Core
1 Thread/Core
(b)
Figure 3: Observed memory bandwidth (with a memory read to write ratio of 2:1) for (a) a single core when varying the number of threads per core (b) a single chip when varying the number of cores and threads per core.
Table IV: Memory read access latency (nanoseconds) and bandwidth (GB/s).
Latency Latency One-direction Bi-direction (w/o prefetching) (w prefetching) bandwidth bandwidth
Chip0↔Chip1 123 12 30 53
Chip0↔Chip2 125 15 30 53
Chip0↔Chip3 133 15 30 53
Chip0↔Chip4 213 16 45 87
Chip0↔Chip5 235 22 45 82
Chip0↔Chip6 237 22 45 82
Chip0↔Chip7 243 22 45 82
Latency Bandwidth
Chip0↔interleaved 168 69
All-to-all interleaved - 380
X-Bus Aggregate - 632
A-Bus Aggregate - 206
C. Simultaneous Multithreading
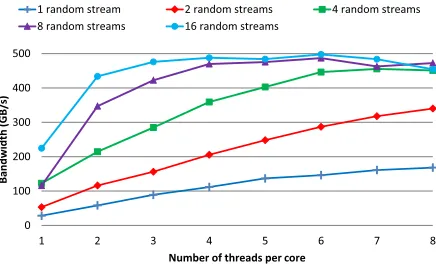
The POWER8 processor is a highly multithreaded mi-croprocessor with eight threads per core. The use of mul-tiple threads can hide both instruction latency stalls in the execution pipelines and memory latency for accessing the cache and memory. In Figure 4 we show the benefits of multi-threading with random memory reads. The results are obtained using a microbenchmark that performs pointer chasing on a random lists of elements, with each element on a separate cache line. To increase the number of outgoing requests per core we can either a) use multiple threads, or b) scan multiple lists concurrently on a single thread. We measured both, varying the number of threads, and varying the number of streams (lists) per thread. In the experiments, we used all the 64 cores of E870. The bandwidth shown is for the full system, as a function of the SMT level of each core.
The maximum bandwidth that was achieved is almost 500 GB/s, 41% of the theoretical peak (memory read). Increasing the number of threads causes an almost lin-ear increase in overall bandwidth, using fewer than four outstanding requests per thread. It is worth noting that increasing the number of threads allows for better utilization of the bandwidth, without the need for impractical levels of unrolling. In other words, from a theoretical point of view a 4-way SMT would be enough to reach the peak random bandwidth, but that would require a very complex code that
requests data from 16 lists. Because of the increased number of threads per core of POWER8, we can reach the peak bandwidth with only 4 concurrent lists.
0 100 200 300 400 500
1 2 3 4 5 6 7 8
Bandwidth (GB/
s)
Number of threads per core
1 random stream 2 random streams 4 random streams 8 random streams 16 random streams
Figure 4: Memory read bandwidth for random access, using a varying number of threads and of outstanding requests per thread.
fewer threads per core. To demonstrate this observation, we use a microbenchmark with multithreading, in which each thread executes a series of independent fused multiply-add (FMA) instructions in a loop. Each FMA instruction multiplies the floating-point vectors from two VSX (the SIMD implementation of the POWER architecture) registers and adds the result back to the first register, i. e., each FMA instruction involves two VSX registers (R1=R1×R2+R1). Figure 5 presents the performance of the microbenchmark with different numbers of FMA instructions executed in the loop and with various numbers of threads per core. We can see that the peak performance can only be achieved when the product of the number of FMA instructions and the number of threads per core is at least 12. This is expected because the latency of the VSX instructions on POWER8 is 6 cycles [2]. Considering that each POWER8 core has two symmetric VSX execution pipelines, it requires at least 12 independent VSX instructions in flight at any given cycle to keep the pipelines saturated.
The results also show that the performance starts to drop when using large numbers of threads per core. We believe this is mainly due to the fact that the computing resources (registers, issue queue entries, execution pipelines, and etc.) of each POWER8 core are shared among all threads on the core. With larger numbers of threads per core, it requires using mpre computing resources, and the overhead can exceed the benefits of multi-threading. For example, the performance drop observed in Figure 5 is mainly caused by register files. Because of the 8-way SMT, the total number
5.00 25.00 45.00 65.00 85.00 105.00
1 2 3 4 5 6 7 8
% of
peak
Number of threads per core
1 FMA 2 FMA 4 FMA 8 FMA 10 FMA 12 FMA
Figure 5: Performance (percentage of peak) of FMA on POWER8 when varying the number of threads per core and the number of registers used per thread.
of registers (including VSX registers) required per core is very large, and it would be impractical to support all these registers in the reorder buffer. For this reason the POWER8 employs a two-level register hierarchy. Each POWER8 core has 128 architected VSX registers, and this is backed up by a larger number of renames (non-architected registers) with a higher access cost. Therefore, when the number of registers used by the threads exceeds 128, the performance suffers. As seen in the figure, the performance of the 12 FMA case starts to degrade when more than 6 threads per core are used. The number of register used in this case is 144 (12×2×6).
We notice that in Figure 5, using odd number of threads per core can reduce performance. This can be explained
by how the POWER8 core manages multithreading; the POWER8 processor core supports 4 SMT-modes: ST (single thread), SMT-2 (2 threads), SMT-4 (3–4 threads) and SMT-8 (5–8 threads); it dynamically changes SMT mode depending on the number of active threads. While all core resources can be used by the single thread in the ST mode, in the other SMT modes the hardware threads are split into two thread-sets, and each thread-set can only use half of the resources in the core. Thus, using an odd number of threads per core will cause thread imbalance between thread-sets.
D. Advanced Data Prefetching
Unlike GPUs that have massive multi-threading, the POWER8 processor also relies on hardware data prefetching to hide memory access latencies. It provides an aggressive prefetching engine, which can effectively identify sequential data access patterns, as well as some non-sequential ones, to improve memory performance by reducing the impact of cache miss latency. Table IV also shows the memory access latencies from Chip0 to the memory banks attached to the other chips with hardware data prefetching enabled. The results show that the memory access latencies are significantly reduced (by an order of magnitude) by the data prefetching engine regardless of which memory bank Chip0 accesses.
There exist cases where the default hardware data prefetching may not provide sufficient benefits. For those cases, the POWER8 processor also provides some special software facilities to assist the hardware prefetching engine. Here, we will use three examples to demonstrate those soft-ware facilities. The first example is to use the Data Stream Control Register (DSCR) to change the prefetch depth, i. e., the number of lines ahead to prefetch. On POWER8 the DSCR register can be accessed directly by the application in userspace. The POWER8 processor supports 7 different depths, from none (DSCR = 1) to the deepest (DSCR = 7). Figure 6 shows the effect of changing the prefetching depth on the latency and bandwidth of a sequential memory access. The latencies were measured using the lmbench tool set. The bandwidth numbers were measured with a memory read to write ratio of 2:1 with the modified STREAM benchmark. It is not surprising to see that both the lowest latency and the highest bandwidth are achieved when the deepest prefetching is used because the access pattern is sequential.
The second example is the “stride-N stream” access pattern, in which the access pattern is still regular, but only every N cache lines are accessed. While this access pattern can not be properly detected by the default settings of the hardware prefetcher, leading to poor memory performance, one can improve the performance by using the DSCR register to enable the stride-N stream detection. Figure 7 compares the memory read latency for a stride-256 stream with the stride-N stream enabled and disabled and with various depths. As seen in the figure, the average memory access latency is reduced from 50 ns to 14 ns when the stride-N stream feature is used.
1200 1250 1300 1350 1400 1450 1500 1550
8 10 12 14 16 18 20
DSCR = 2 DSCR = 3 DSCR = 4 DSCR = 5 DSCR = 6 DSCR = 7
Memory
Bandwidth (GB/s
)
Latancy (ns)
Prefetch depth (DSCR)
Latency Bandwidth
Figure 6: Observed memory latency (memory read) and bandwidth (with a memory read to write ratio of 2:1) with different prefetch depths.
10 20 40 80
DSCR = 2 DSCR = 3 DSCR = 4 DSCR = 5 DSCR = 6 DSCR = 7
Latency (ns)
Prefetch depth (DSCR)
stride-N stream disable
stride-N stream enable
Figure 7: Comparison of memory read latency for a stride-256 stream access when hardware detection of stride-N stream is enabled and disabled.
common in applications that require dynamic scheduling of threads that execute small tasks. Although the hardware data prefetching engine can recognize the sequential access pattern on each array, it requires several cache line accesses for the hardware to recognize the pattern. On very small arrays the prefetcher may kick in too late to improve performance.
The Data Cache Block Touch (DCBT) instruction can be used to improve the memory performance in such a case. With the DCBT instruction, we can indicate the hardware when a sequential access starts and stops, as well as some important information about the pattern, such as the starting address, the direction (increasing address or decreasing addresses), and the size of the array, which will help the hardware engine to more quickly identify the stream and start the prefetch process.
We demonstrated this case by using a microbenchmark that randomly accesses the blocks of an array. Specifically, we create an array and divide it into blocks with length of bsize. The elements within a block are accessed sequentially, and when the access of a block is finished, we randomly pick the next block. We continue this until all the blocks are accessed. Figure 8 presents the results, which shows that the performance benefits of using the DCBT instruction to access small arrays is more than 25%. With larger arrays, as expected, the effect is negligible.
20 30 40 50 60 70 80 90 100
1 3 5 7 10 14 20 28 40 56 80 112 160 224
% of
peak
bandwidth
Block size (KB)
w/o DCBT w/ DCBT
Figure 8: Comparison of achieved memory read bandwidth (percentage of peak memory read bandwidth) for using DCBT.
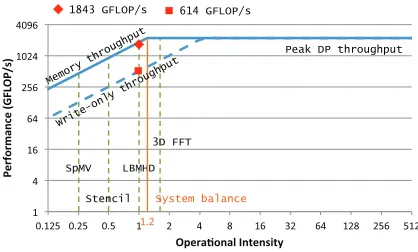
Peak DP throughput
Memory throughput
1843 GFLOP/s 614 GFLOP/s
SpMV
Stencil LBMHD
3D FFT
System balance
Write-only throughput
Figure 9: Roofline for the IBM Power System E870.
IV. ROOFLINEMODELANALYSIS
In this section, we use the well-known roofline model to estimate the performance of the E870 8–socket POWER8 system for various scientific kernels. The roofline model is a visually–intuitive and throughput–oriented method for representing a system’s performance characteristics [34], [9]. The roofline plotsa system’s performance (or energy efficiency) for variousoperational intensities(floating–point operations per byte of DRAM traffic) of algorithms. This visualization and mapping of performance to algorithm helps to identify and quantify the primary factors that are limiting the performance of a given application. This style of “bound and bottleneck analysis,” best exemplified by the famous Amdahl’s Law, has the advantage of being more intuitive and user friendly than traditional analytical or statistical performance models.
The solid blue line in Figure 9 shows the roofline for the POWER8 server. The system’s double–precision (DP) and memory throughputs are 2,227 GFLOP/s and 1,843 GB/s, respectively. This gives the system a balance of 1.2 (orange line), given by the ratio of peak compute throughput to memory throughput; the system’s balance point is the operational intensity at which an algorithm goes from being memory bound to being compute bound on that system.
composed of mostly write operations, its performance will also drop to less than half. This is shown by the dashed blue line in the figure.
Using the roofline model, we can conduct a performance analysis for a variety of scientific kernels. As shown in Fig-ure 9, for four kernels that are frequently used in scientific applications – sparse matrix–vector multiply (SpMV), 3D stencil (Stencil), Lattice–Boltzmann magnetohydrodynam-ics (LBMHD), and 3D fast Fourier transform (3D FFT) – we can estimate a performance upper–bound on the POWER8 system. For example, for the LBMHD kernel, whose operational intensity is approximately one, we can expect a peak performance of 1,843 GFLOP/s (red dia-mond). The above analysis, however, assumes the optimal memory bandwidth use of POWER8, which can only be achieved by a memory read and write ratio of 2:1. Instead, if the kernel was composed of only write operations, then the expected performance would be 614 GFLOP/s (red square) instead.
Our results show that the POWER8 SMP system is opti-mized for data intensive applications with low operational intensities. E870 has a system balance of 1.2 which suggests that it is well balanced – its compute performance is equally matched by its memory performance. This is different from many other systems whose system balance typically ranges from 6 to 7 and which prefer increasing the number of processing units rather than memory bandwidth. By taking the difficult, but effective, strategy of keeping a “balance” between compute and memory throughputs [23], [5], [15] the POWER8–based system is capable of delivering excel-lent performance for a wide range of applications, which include, but not limited to, the aforementioned kernels.
V. APPLICATIONS
The results from three large-scale, data-intensive appli-cations are presented and analyzed on the POWER8 SMP systems. Compared to the state-of-the-art results, we show that
A. All-pairs Jaccard Similarity
As an instance of graph analytics kernels sharing common features with fundamental linear algebra operations, we now consider the all-pairs Jaccard similarity [20]. This kernel is used in applications that search for textually similar documents (both duplicates and near-duplicates) in large corpora such as the Web or collections of news articles [25], in query refinement [26] for search engines, to suggest alter-nate formulations, and in the detection of plagiarism [16]. We consider the computation of the Jaccard similarity as an example of memory-intensive graph analytics kernel, showcasing many of the traits common to graph processing applications, often characterized by irregular, fine-grain memory accesses, and large working sets and problem sizes. For an undirected graphG= (V,E), the Jaccard similarity between a pair of vertices (i,j) is defined as the overlap between the respective sets of neighbors, as shown in Equation 1, whereN(v) ={u∈V|(v,u)∈E}is the set of
the neighbors of vertexv.
Ji j=|
N(i)∩N(j)|
|N(i)∪N(j)|. (1)
Calculating the Jaccard similarity between vertices i and
j correspond to finding the number of common neighbors |N(i)∩N(j)|. This number can be obtained for every pair of vertices by squaring the adjacency matrixAofG, trans-forming the problem of calculating the Jaccard coefficients into a matrix multiplication [3], [20]. We have designed and implemented an efficient locality-aware method for calculat-ing all-pairs Jaccard Similarity based on linear algebra [8], and here we present its performance on E870.
Figure 10 shows the execution time and the memory footprint of our algorithm on E870 for R-MAT graphs of various sizes, from scale 17 to scale 23, corresponding to 128 thousand to 8 million vertices, with an average degree of 16. We ran the algorithm with one thread per core. As seen in the figure, the output size of the all-pairs Jaccard Similarity is substantially larger than the input ma-trices, which exceeds the memory capacity of most shared memory systems, forcing researchers to seek distributed implementation alternatives. The POWER8 SMP system, with extremely large memory capacity and high memory bandwidth, allows computing all-pairs Jaccard Similarity for very large graphs on a single node and achieving performance comparable to distributed algorithms [1].
This goes to show how non-trivial kernels can be affected by system design parameters, and for applications like graph analytics, where large memory footprints and high memory bandwidths are much sought after, POWER8 SMP systems prove to be an effective solution.
2 4 8 16 32 64 128 256 512 1024 2048
0.4 1.6 6.4 25.6 102.4 409.6 1638.4
17 18 19 20 21 22 23
Memory
re
qui
re
m
en
ts
(GB)
Tim
e
(Secs)
R-MAT Scale
Memory Time
Figure 10: Performance of all-pairs Jaccard Similarity on E870 for different scales of R-MAT graphs.
B. Sparse Matrix-Vector Multiplications
1) SpMV on HPC Matrices: For this kind of matrices we propose a simple SpMV kernel using the well-known CSR format. Given the regular structure, and the memory-bound nature of the problem, there is little point in using complex, vectorized implementations.
Given the results in Section III, we know we have to take particular care of the allocation of the data. We used a static 1D partitioning to assign a group of contiguous rows to the same thread, and balance the number of nonzero per partition. Each thread keeps its own partition on the corresponding local socket, where each partition consists of a set of rows of the input matrix and the corresponding elements of the output vector.
Each thread also requires access to the entire input vector. We could distribute the vector across the machine but, as seen in Section III, this will significantly lower the bandwidth. Alternatively, we replicate the input vector. On first approximation this would requirencopies fornthreads. However, considering the architecture and the read-only nature of the access, we can keep only one replica of the input vector for each socket, and a share it among all the threads on the same socket. This requires (at most) 16 copies of the vector, making the approach feasible (especially considering that the input vector is generally relatively small compared to the matrix).
" % $#&$
Figure 11: Performance of different matrices on E870 using the CSR format.
We show the performance of our CSR implementation on E870. We used a range of matrices selected from the University of Florida Sparse Matrix Collection [13] and are typically tested in SpMV works [22], [33], [10]. We also used the dense matrix (Dense) as a reference for the peak performance achievable with SpMV. The results show a very high peak performance (obtained with Dense), and that most of the matrices perform similarly to Dense.
2) SpMV on scale-free graphs: Adjacency matrices are a novel and interesting use case for SpMV. They share very few structural characteristics with matrices associated with common scientific problems. Real-world, social network graphs are much less structured and follow a power-law (i.e. some rows have an exponentially large number of elements, while most have very few). In this scenario, a traditional SpMV implementation struggle to deliver good performance: given the irregular structure, the access pat-tern of the input vector x is now highly sparse [8]. New implementations and matrix representations must be used
1 2 4 8 16 32 64 128 256 512 1024 2048
0 5 10 15 20 25 30 35 40
23 24 25 26 27 28 29 30 31
Memory requireme
n
ts
(
G
B)
Pe
rf
ormance (GFL
OP
/s
)
R-MAT Scale
Performance Memory
Figure 12: Performance scalability of R-MAT SpMV on E870.
to better exploit cache-based architectures.
In our previous work [8], we presented a novel algorithm for SpMV on graphs. In order to improve performance, the algorithm divides the matrix into blocks and performs two separate scans on the matrix. With the first scan we scale the matrix by multiplying each column by the corresponding value inx. The second scan is used to produce the output vector by summing all the elements of each row of the modified matrix. For the first phase we use 1D blocking of the matrix by columns, which allows us to keep the relative part of the input vector in cache and thus hide any sparsity in the access pattern. The second phase, on the other hand, use a different blocking scheme, still 1D but this timeby rows, which in turn allows the output vector to fit in cache and hide this second source of sparsity. We change the partitioning between the two scans, but given the shared memory nature of the system, we can just exchange the pointers to the blocks without performing any copy operations.
The performance of this algorithm is highly dependent on the characteristics of the POWER8 processor. We leverage the fact that we can read and write concurrently without loss in performance, greatly improving the first phase of the algorithm (for each nonzero we read 10 and write 8 bytes, while the original CSR algorithm is mostly read-based). Also, considering that we work with (possibly) small blocks of data, we explicitly use the advanced data prefetching facilities presented in Section III to specify, at software, the beginning and the end of each data stream (i.e. block).
Figure 12 shows the performance of SpMV on E870 for R-MAT graphs of scale upto 31, corresponding to 2 billion nodes and 68 billion edges. To the best of our knowledge no previous work, even using distributed algorithms, presents SpMV implementations on graphs of this scale [6]. Consid-ering the performance, our SpMV implementation on E870 is also on par with the state-of-the-art presented in [6].
achieve the peak performance largely due to prefetching issues. As an example, a R-MAT 24 has an average block size of∼12,000 elements, while on R-MAT 31 the value drops to∼63, corresponding to roughly 4 cache lines per block.
C. Hartree-Fock Calculations
The Hartree-Fock (HF) method, also known as the self-consistent field (SCF) method, is a fundamental kernel in quantum chemistry for solving the electronic Schr¨odinger equation [30]. The solution of the equation can be used to predict properties of molecules. Essentially, the HF method is an iterative algorithm for computing the molecular orbital coefficients. Each HF iteration is composed of two major computational stages. The first stage is the computation of the Fock matrix F using the density matrix D, which is given by
Fi j=Hi jcore+
nf
∑
knf
∑
lDkl(2(i j|kl)−(ik|jl)) (2)
In the second stage, the spectral projector ofF is computed and is used to construct a new density matrix, which will serve as the input for the next iteration. The HF iteration procedure is usually terminated when the change in the density matrix is less than a given threshold.
In Equation (2), Hcore is a fixed matrix, called thecore Hamilton matrix, and the quantity(i j|kl) denotes an entry of a four dimensional tensor ofelectron repulsion integrals
(ERIs) of size nf×nf×nf×nf, where nf is the number
of basis functions used for modeling the molecule. One important property for ERIs is that many values of(i j|kl)
are negligibly small, which means we do not need to com-pute all of them. A numerical procedure called screening
can be used to drop small integrals with relatively low computational cost.
Most quantum chemistry packages that implement the HF method, including the well-known NWChem [32], recompute the ERIs at every HF iteration, although the values of ERIs do not change from one iteration to the next. This is because the number of non-screened ERIs is extremely large even for very small molecular systems. The memory requirements for storing the ERIs usually exceed the capacity of most commodity HPC machines. In addition, most quantum chemistry packages use distributed paral-lelization to speedup HF, because the computation of ERI is very expensive. However, distributed HF implementations in general have never been shown to scale well beyond hundreds of nodes due to the load imbalance and the high communication cost arising from the irregularity of the ERIs and the Fock matrix construction [21].
Given the extremely large memory capacity of the POWER8 SMP systems, it is possible to use a different algorithm for HF that precomputes and stores the ERIs in memory. In this work, we implemented both the conven-tional algorithm of HF that recomputes the ERIs (HF-Comp) and the alternative algorithm that precomputes and stores the ERIs (HF-Mem).
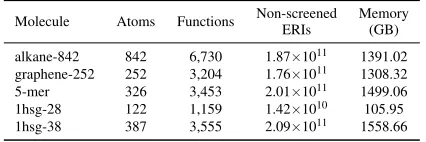
Table V lists the five molecular systems for performance evaluation: a linear alkane, a planar graphene molecule, a
Table V: Test molecular systems using the cc-pVDZ basis set.
Molecule Atoms Functions Non-screened Memory
ERIs (GB)
alkane-842 842 6,730 1.87×10¹¹ 1391.02
graphene-252 252 3,204 1.76×10¹¹ 1308.32
5-mer 326 3,453 2.01×10¹¹ 1499.06
1hsg-28 122 1,159 1.42×10¹⁰ 105.95
1hsg-38 387 3,555 2.09×10¹¹ 1558.66
5-mer segment of DNA, and two truncated globular protein-ligand systems (1hsg). For each molecule, the memory requirement for storing non-screened ERIs is also listed. All test molecules used the cc-pVDZ basis set [14]. A screening tolerance of 10−10 was used for dropping small ERIs.
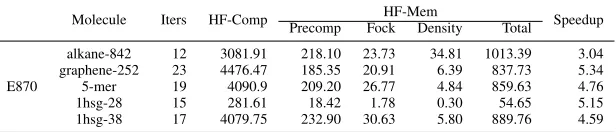
Table VI shows the timings for the HF implementations on E870. The table shows the execution time for HF-Comp (HF-Comp), the number of HF iterations for each molecule, and the average execution time per iteration for major components of HF-Mem. These are precomputing the ERIs (Precomp), which is performed only once; computing the Fock Matrix (Fock); and computing the density matrix (Density). For most molecules, HF-Mem is more than 4.5x faster than HF-Comp. It is expected that HF-Mem is efficient on E870 because the system has a very low ratio of floating-point to memory throughput (i.e., system balance,§IV).
Compared to the state–of–the–art on the same molecules (1hsg-28 and 1hsg-38), the performance of HF-Comp and HF-Mem on E870 is on par with that was presented in [11], [12].
VI. CONCLUSION
We have presented an early performance evaluation of the POWER8 processor and its many–core SMP system. Our microbenchmarking study exposed the low–level per-formance characteristics, while our trio of test applications demonstrated the achievable real–world performance capa-bility of the POWER8 system. Beyond our experimental findings, we also conducted a high level analysis of the POWER8 SMP system using the roofline model on a suite of important and frequently used scientific kernels to illustrate the performancepotentialof the POWER8 system. Altogether, our results show that the POWER8 system is highly capable and competitive for high–performance computing and large–scale data analytics applications.
Table VI: Timings (in seconds) for HF-Comp and HF-Mem on E870.
Molecule Iters HF-Comp HF-Mem Speedup
Precomp Fock Density Total
E870
alkane-842 12 3081.91 218.10 23.73 34.81 1013.39 3.04
graphene-252 23 4476.47 185.35 20.91 6.39 837.73 5.34
5-mer 19 4090.9 209.20 26.77 4.84 859.63 4.76
1hsg-28 15 281.61 18.42 1.78 0.30 54.65 5.15
1hsg-38 17 4079.75 232.90 30.63 5.80 889.76 4.59
VII. ACKNOWLEDGMENTS
The authors would like to thank Donald G. Grice and Robert E. Walkup for their technical feedback and guidance.
REFERENCES
[1] “Asking Hard Graph Questions,”
http://www.idc.com/getdoc.jsp?containerId=233485.
[2] “POWER8 processor user’s manual for the single-chip module.” [3] “Rock: A robust clustering algorithm for categorical attributes,” in
Proceedings of the 15th International Conference on Data Engineer-ing, ser. ICDE ’99. Washington, DC, USA: IEEE Computer Society, 1999, p. 512.
[4] A. V. Adinetz, P. F. Baumeister, H. Bottiger, T. Hater, T. Maurer, D. Pleiter, W. Schenck, and S. F. Schifano, “Performance evaluation of scientific applications on power8,” in5th International Workshop on Performance Modeling, Benchmarking and Simulation of High
Performance Computer Systems, ser. PMBS14, New Orleans, LA,
USA, 2014.
[5] G. E. Blelloch, B. M. Maggs, and G. L. Miller, “The hidden cost of low bandwidth communication,” inDeveloping a Computer Science
Agenda for High-Performance Computing. New York, NY, USA:
ACM, 1994, pp. 22–25.
[6] E. G. Boman, K. D. Devine, and S. Rajamanickam, “Scalable matrix computations on large scale-free graphs using 2d graph partitioning,”
inProceedings of the International Conference on High Performance
Computing, Networking, Storage and Analysis, ser. SC ’13. New
York, NY, USA: ACM, 2013, pp. 50:1–50:12.
[7] J. M. Bull and D. O’Neill, “A microbenchmark suite for openmp 2.0,”ACM SIGARCH Computer Architecture News, vol. 29, no. 5, pp. 41–48, 2001.
[8] D. Buono, J. A. Gunnels, X. Que, F. Checconi, and F. Petrini, “Optimizing sparse linear algebra for large-scale graph analytics,”
Computer, 2015, to Appear.
[9] J. Choi, R. Vuduc, R. Fowler, and D. Bendard, “A roofline model of energy,” inIn Proceedings of the 27th IEEE International Parallel
and Distributed Processing Symposium (IPDPS 13), 2013.
[10] J. W. Choi, A. Singh, and R. W. Vuduc, “Model-driven autotuning of sparse matrix-vector multiply on gpus,” inProceedings of the 15th ACM SIGPLAN Symposium on Principles and Practice of Parallel
Programming, ser. PPoPP ’10. New York, NY, USA: ACM, 2010,
pp. 115–126.
[11] E. Chow, X. Liu, S. Misra, M. Dukhan, M. Smelyanskiy, J. R. Hammond, Y. Du, X.-K. Liao, and P. Dubey, “Scaling up hartreefock calculations on tianhe-2,”International Journal of High Performance
Computing Applications, 2015.
[12] E. Chow, X. Liu, M. Smelyanskiy, and J. R. Hammond, “Parallel scalability of hartree–fock calculations,” The Journal of chemical
physics, vol. 142, no. 10, p. 104103, 2015.
[13] T. A. Davis and Y. Hu, “The university of florida sparse matrix collection,”ACM Trans. Math. Softw., vol. 38, no. 1, pp. 1:1–1:25, Dec. 2011.
[14] T. H. Dunning Jr, “Gaussian basis sets for use in correlated molecular calculations. i. the atoms boron through neon and hydrogen,”The
Journal of Chemical Physics, vol. 90, no. 2, pp. 1007–1023, 1989.
[15] W. D. Hillis, “Balancing a Design,”IEEE Spectrum, 1987. [16] T. C. Hoad and J. Zobel, “Methods for identifying versioned and
plagiarized documents,”J. Am. Soc. Inf. Sci. Technol., vol. 54, no. 3, pp. 203–215, Feb. 2003.
[17] R. Kalla, B. Sinharoy, W. J. Starke, and M. Floyd, “Power7: Ibm’s next-generation server processor,”IEEE Micro, vol. 30, no. 2, pp. 7–15, 2010.
[18] S. D. Kamvar, T. H. Haveliwala, C. D. Manning, and G. H. Golub, “Extrapolation methods for accelerating pagerank computations,” in Proceedings of the 12th International Conference on World Wide Web, ser. WWW ’03. New York, NY, USA: ACM, 2003, pp. 261– 270.
[19] J. M. Kleinberg, “Authoritative sources in a hyperlinked environ-ment,”J. ACM, vol. 46, no. 5, pp. 604–632, Sep. 1999.
[20] E. A. Leicht, P. Holme, and M. E. J. Newman, “Vertex similarity in networks,” 2005, cite arxiv:physics/0510143. [Online]. Available: http://arxiv.org/abs/physics/0510143
[21] X. Liu, A. Patel, and E. Chow, “A new scalable parallel algorithm for fock matrix construction,” inParallel and Distributed Processing
Symposium, 2014 IEEE 28th International. IEEE, 2014, pp. 902–
914.
[22] X. Liu, M. Smelyanskiy, E. Chow, and P. Dubey, “Efficient sparse matrix-vector multiplication on x86-based many-core processors,” in Proceedings of the 27th International ACM Conference on
Interna-tional Conference on Supercomputing, ser. ICS ’13. New York, NY,
USA: ACM, 2013, pp. 273–282.
[23] J. McCalpin, “Memory Bandwidth and Machine Balance in High Performance Computers,”IEEE Technical Committee on Computer
Architecture (TCCA) Newsletter, Dec. 1995.
[24] L. McVoy and C. Staelin, “Lmbench: Portable tools for performance analysis,” inProceedings of the 1996 Annual Conference on USENIX
Annual Technical Conference, ser. ATEC ’96. Berkeley, CA, USA:
USENIX Association, 1996, pp. 23–23.
[25] A. Rajaraman and J. D. Ullman, Mining of Massive Datasets. Cambridge University Press, 2011.
[26] M. Sahami and T. D. Heilman, “A web-based kernel function for measuring the similarity of short text snippets,” inProceedings of
the 15th International Conference on World Wide Web, ser. WWW
’06. New York, NY, USA: ACM, 2006, pp. 377–386.
[27] B. Sinharoy, R. Swanberg, N. Nayar, B. Mealey, J. Stuecheli, B. Schiefer, J. Leenstra, J. Jann, P. Oehler, D. Levitanet al., “Ad-vanced features in ibm power8 systems,”IBM Journal of Research
and Development, vol. 59, no. 1, pp. 1–1, 2015.
[28] B. Sinharoy, J. Van Norstrand, R. Eickemeyer, H. Le, J. Leenstra, D. Nguyen, B. Konigsburg, K. Ward, M. Brown, J. Moreiraet al., “Ibm power8 processor core microarchitecture,” IBM Journal of
Research and Development, vol. 59, no. 1, pp. 2–1, 2015.
[29] W. Starke, J. Stuecheli, D. Daly, J. Dodson, F. Auernhammer, P. Sagmeister, G. Guthrie, C. Marino, M. Siegel, and B. Blaner, “The cache and memory subsystems of the ibm power8 processor,”IBM
Journal of Research and Development, vol. 59, no. 1, pp. 3–1, 2015.
[30] A. Szabo and N. S. Ostlund,Modern Quantum Chemistry:
Introduc-tion to Advanced Electronic Structure Theory. Dover, 1989.
[31] H. Tong, C. Faloutsos, and J.-Y. Pan, “Random walk with restart: Fast solutions and applications,”Knowl. Inf. Syst., vol. 14, no. 3, pp. 327–346, Mar. 2008.
[32] M. Valiev, E. J. Bylaska, N. Govind, K. Kowalski, T. P. Straatsma, H. J. Van Dam, D. Wang, J. Nieplocha, E. Apra, T. L. Winduset al., “NWChem: a comprehensive and scalable open-source solution for large scale molecular simulations,”Computer Physics
Communica-tions, vol. 181, no. 9, pp. 1477–1489, 2010.
[33] S. Williams, R. Vuduc, L. Oliker, J. Shalf, K. Yelick, and J. Demmel, “Optimizing sparse matrix-vector multiply on emerg-ing multicore platforms,” Parallel Computing (ParCo), vol. 35, no. 3, pp. 178–194, March 2009, extends conference version: http://dx.doi.org/10.1145/1362622.1362674.