Evaluation of Kansei Engineering-based Sensor for Agro-industry
(KESAN)
Mirwan Ushada
1*, Nafis Khuriyati
1, Silvia Agustriana
2and Tsuyoshi Okayama
3(1. Universitas Gadjah Mada, Faculty of Agricultural Technology,Department of Agro-industrial Technology Jl. Flora No.1 Bulaksumur Yogyakarta Indonesia ZIP 55281;
2.Universitas Gadjah Mada, Alumni of Master Program, Faculty of Agricultural Technology, Department of Agro-industrial Technology Jl. Flora No.1 Bulaksumur Yogyakarta Indonesia ZIP 55281;
3. Ibaraki University, College of Agriculture,Department of Regional and Environmental Science 3-21-1 Chuo, Ami-machi, Inashiki-gun, Ibaraki, Japan ZIP 300-0393)
Abstract: This paper highlighted evaluation of a device for workload monitoring named as Kansei Engineering-based Sensor for
Agro-industry (KESAN). As a newly developed device, usability and performance factors have not been evaluated on KESAN. The research objectives were: 1) To evaluate the usability attributes of KESAN as an appropriate technology; 2) To evaluate the performance factors of KESAN for the workload monitoring device. Usability was evaluated by 30 selected manager of Small Medium-sized Enterprises (SMEs) in agro-industry in Yogyakarta Special Region. Usability evaluation indicated most attributes were accepted by the manager. Device performance factors were evaluated on nine selected workers from fish processing, crackers, and bakery industry. Seven workers were evaluated on consecutive and two workers on non-consecutive production scenarios. Measurement periods were verified in fish processing for another two evaluation weeks. Research results concluded the KESAN is usable for the manager and possible use in practice for workload monitoring in agro-industry. The results will be used for design improvement of KESAN based on human-machine interface.
Keywords: appropriate technology, performance, usability, worker, workload monitoring.
Citation: Ushada, M., N. Khuriyati, S. Agustriana and T. Okayama. 2020. Evaluation of Kansei Engineering-based Sensor for
Agro-industry (KESAN). Agricultural Engineering International: CIGR Journal, 22(1): 133-144.
1 Introduction
Agro-industry is a worker-intensive production system in Indonesia which process fresh agricultural commodity to a value-added product. Agro-industry is expected to contribute for Indonesian economic growth and export,
Received date: 2019-01-21 Accepted date: 2019-07-17
*Corresponding author: Mirwan Ushada, Ph.D, Universitas Gadjah Mada, Faculty of Agricultural Technology,
Department of Agro-industrial Technology, Jl. Flora No.1 Bulaksumur Indonesia ZIP 55281, Phone/Fax: +62-274-589-797, Email: [email protected].
increasing job opportunities, minimizing poverty and strengthening economic decentralization in many Indonesian provinces (Indonesian Ministry of Industry, 2011). Based on ASEAN Economic Community (AEC) policy blueprint for 2004-2014 (ASEAN, 2008), information technology and device application could be suggested for agro-industry to challenge human resources competition in AEC. The trade-off between productivity and ergonomic application is a critical point for the competitive advantage of agro-industry. A research application in the worker-intensive industry has reported the analysis on the possible effect of ergonomics
application on worker availability and productivity (Daria et al., 2015).
A self-built device named as Kansei Engineering-based Sensor for Agro-industry (KESAN) was developed for workload monitoring in agro-industry based on artificial intelligence and Kansei Engineering approach (Ushada et al., 2017). In this scope, Kansei is a measurable workload using verbal and non-verbal parameters. The term Kansei Engineering referred to the modeling method of workload using Kansei (Ushada et al., 2015a, 2015b, 2017). The verbal workload was the total mood disturbance which was determined from the profile of mood states (Ushada et al., 2017). The non-verbal workload was defined as heart rate which was measured using wrist pulse meter (Ushada et al., 2017). The device was developed using the artificial neural network model (Ushada et al., 2017) and microcontroller (Ushada et al., 2016). The development of the device confirmed the suggestion from Yin et al. (2015) related to the contribution of artificial intelligence technology in the scope of human-machine interface.
As a newly developed device, usability attributes and performance factors have not been evaluated on KESAN based on the human-machine interface. Demartini (2015) has suggested the importance of evaluating human-machine interface for the information technology-related application in industry. Ehmen et al. (2012) stated that the usability problem often arises when a device is newly developed. Most of the devices were developed by technically-oriented designers and developers (Ehmen et al., 2012). This was specifically proofs when a new user interacts with new technologies. There was some research which explored usability evaluation of a device. Traxler et al. (2015) have improved the usability of a mechanical eye model for the goal of medical intervention. Ehmen et al. (2012) have compared the usability of four different mobile devices for measuring heart rate and electrocardiogram (ECG). Herrera et al. (2015) have explored the usability of a remote laboratory using Arduino and Raspberry Pi. However, none of these research was available for usability evaluation of KESAN as an appropriate agro-industrial technology.
The KESAN’s performance factors must be evaluated for the workload monitoring device in the field and industrial application. The intention of performance evaluation is to minimize the malfunction of the device. Weyer et al. (2015) have investigated some malfunction of the driver assistance systems in the scope of the human-machine system. The malfunction was due to drivers have a high level of confidence (Weyer et al., 2015). Di Pasquale et al. (2015) have developed a simulation model for optimization of the rest breaks configurations in human-intensive working activities. Xia et al. (2015) have developed the model which predicted the performance factors of operator based on human-machine systems. Muthig et al. (2015) have used a stochastic state machine to predict upcoming options of human preference in a driving simulator. However, none of these research were available for KESAN’s performance evaluation of workload monitoring in agro-industry.
The research objectives are: 1) To evaluate the usability attributes of KESAN as an appropriate technology; 2) To evaluate the performance factors of KESAN for a workload monitoring device. The research advantages are to support the improvement and customization of the KESAN for environmental ergonomics control system. The system is proposed as worker responsiveness-based environmental ergonomics control system for optimizing workload and productivity. Burkolter et al. (2014) have concluded that customization was essential to maximize higher usability in the human-machine interaction.
2 Materials and methods
2.1 KESAN
heart rate (HR), workplace temperature, relative humidity, light intensity, and noise level. Each of parameters were
measured two times as before and after working. The total inputs of KESAN are 12 parameters.
Figure 1 Structure of KESAN (P00201601182).
The total number input of KESAN is 12 parameters. The outputs of workload status are indicated by light-emitting diode lamp colors of green (normal workload), yellow (over workload) and red (less workload). The inputs are processed using the trained weight of an artificial neural network model. The weights were transformed to hardware platform using Arduino microcontroller. The user can simply utilize the device by manually inputting the
parameters, displaying the outputs in the small monitor and saving the results to secure digital (SD) memory card. The data of SD memory card is stored for monitoring the workload in the time series.
The instruction of using KESAN can be defined as follow:
Step 1: Turn on the device by pressing the switch. Step 2: Input the data of date, month, year and identity of the worker.
Step 3: Input the data of mood disturbance, HR, workstation temperature, relative humidity, light intensity and noise level which was measured before and after working (12 Input parameters).
Step 4: The output is indicated by the LED indicator. Step 5: The data of input and output are automatically saved in the SD card.
Step 6: Choose whether a return to Step 2 by pressing “*” button on the keypad or turn off the device by keep pressing the switch.
2.2 Methodology
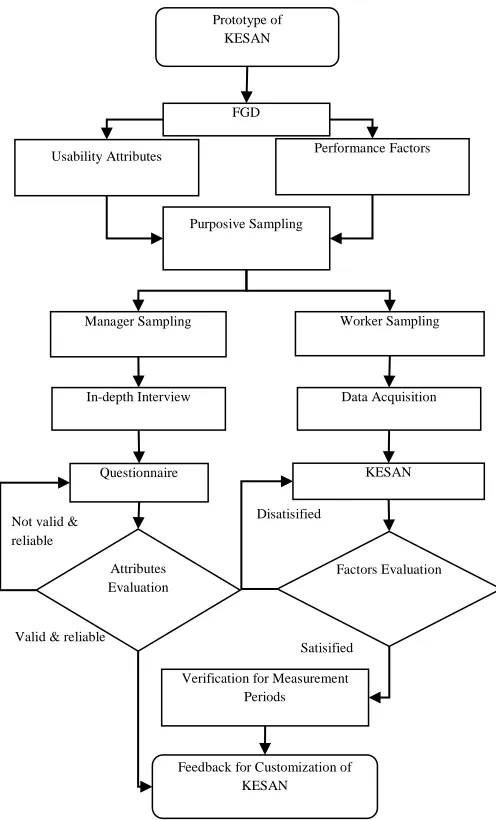
Figure 2 describes the research methodology. The methodology consists of evaluation for usability attributes and performance factors as follow.
Figure 2 Research methodology.
Prototype of KESAN
Purposive Sampling
Manager Sampling Worker Sampling
FGD
Usability Attributes Performance Factors
In-depth Interview Data Acquisition
Attributes Evaluation
Factors Evaluation
Questionnaire KESAN
Valid & reliable
Disatisified
Verification for Measurement Periods
Feedback for Customization of KESAN Not valid &
reliable
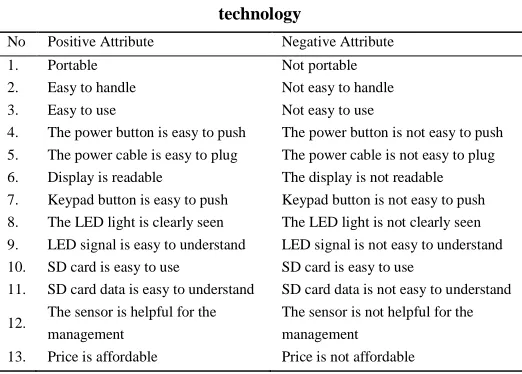
Table 1 Usability attributes of KESAN as an appropriate
technology
No Positive Attribute Negative Attribute 1. Portable Not portable 2. Easy to handle Not easy to handle 3. Easy to use Not easy to use
4. The power button is easy to push The power button is not easy to push 5. The power cable is easy to plug The power cable is not easy to plug 6. Display is readable The display is not readable 7. Keypad button is easy to push Keypad button is not easy to push 8. The LED light is clearly seen The LED light is not clearly seen 9. LED signal is easy to understand LED signal is not easy to understand 10. SD card is easy to use SD card is easy to use
11. SD card data is easy to understand SD card data is not easy to understand 12. The sensor is helpful for the
management
The sensor is not helpful for the management
13. Price is affordable Price is not affordable
2.2.1 Usability evaluation
The sample of KESAN is used in focus group discussion (FGD) by members of Research Collaboration in Agro-industrial Technology (RECAT), Laboratory of Production System, Department of Agro-industrial Technology, Faculty of Agricultural Technology, Universitas Gadjah Mada. These members are selected due to their expertise in appropriate agro-industrial technology.
Mechanism of attributes definition refers to our previous research (Ushada, et al, 2012) based on the specific industrial needs of the KESAN as an appropriate technology. FGD generates 13 attributes for the questionnaire. Thirty managers from 17 small medium-sized enterprises (SMEs) in Agro-industry were selected in Yogyakarta Special Region. An in-depth interview is pursued using leaflet to share initial knowledge of the respondent before filling out the questionnaire. The questionnaire is used to evaluate the usability attributes of KESAN as an appropriate technology. The questionnaire requires respondents to fill out between 5 to 10 mins. The questionnaire uses the semantic differential scale from 1 (Positive range) to 7 (Negative range) (Table 1). This scale is applicable for designers and developers of ergonomic product to consider the customized requirement and preference of the target group (Ehmen et al., 2012).
Thirteen usability attributes were decided based on FGD (Table 1). The questionnaire data is acquired in two batches within two weeks for the purpose of validity and
reliability test. Both of tests are pursued using statistical analysis software.
2.2.2 Performance factors evaluation
The performance factors are evaluated based on the different scenario of production schedules. The major performance scenario is the capability of the device to monitor the worker workload on consecutive and non-consecutive days of the production schedule. Consecutive days represents the regular push production system based on forecasted consumer demand. Non-consecutive days for the pull production system are based on real-time consumer demand. Performance results are verified using the verbal and non-verbal parameter.
Device performance is evaluated on fish processing, crackers and bakery industry. These industries are selected due to their gender composition of workers and different work environment. The entire workers of the fish processing industry are female, while the crackers industry are male. Bakery industry is selected since the mixed composition of male and female. The light intensity range of workplace environment in the fish processing industry was 33 to 5334 Lux, the crackers industry was 11 to 27 Lux and bakery industry was 33 to 160 Lux.
FGD generates the procedure for evaluation of KESAN’s performance. Data acquisition procedure is pursued based on the methodology of Kansei Engineering (Ushada et al., 2015a, 2017). Measurement periods are pursued before and after work. The verbal parameter of TMD is measured using the questionnaire Profile of Mood States (POMS). The non-verbal parameter of HR was measured using a wrist pulse meter. The data of workplace temperature, dew point, wet bulb, mixing ratio, and relative humidity are acquired using thermo recorder. Light intensity is measured using a light meter. The noise is measured using the sound level meter. Device performance is evaluated on selected nine workers from fish processing, crackers, and bakery industry. Seven workers are evaluated on consecutive days of production schedule and two workers on non-consecutive days.
Performance factors on consecutive days of production is evaluated on seven workers. One worker is from fish chip industry, one worker from crackers industry and five workers from bakery industry. The workers are selected based on the suggestion from the manager. Worker sampling considered worker sufficiency in production schedule during data acquisition. Fish chip industry suggests a female worker since the entire worker were housewives from the surrounding neighborhood. Crackers industry suggests a male worker since the entire worker was male. Bakery industry suggests the larger sample representing each workstation since the larger amount of worker compared to other industries. The worker is evaluated during six working days.
2.2.4 Non-consecutive days of production
Performance factors on non-consecutive days of production is evaluated on two workers. Two workers from the bakery industry are selected based on the suggestion from the manager. The workers are evaluated during four fasting days of Ramadhan. In Ramadhan, the production schedule is uncertain and based on consumer demand (Pull production system). The light intensity range of workplace environment is 27 to 132 Lux.
2.2.5 Verification for measurement periods
Measurement periods is determined per day on before and after work. The objective is to verify the different patterns of TMD and HR before and after work. The measurement periods are verified in fish chip industry using TMD and HR for another two evaluation weeks.
3 Results and discussion
3.1 Evaluation of usability attributes
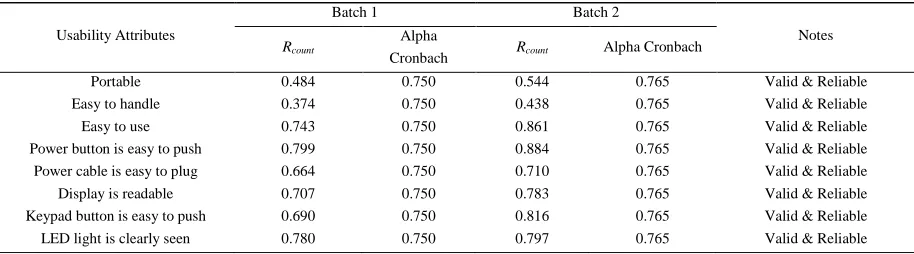
The statistical test indicated that 13 usability attributes were valid and reliable. These attributes were validated using Pearson correlation. Subsequently, the reliability was tested using Cronbach Alpha. Validity and reliability test were applied for usability attributes using SPSS. The validity was tested using the correlation of product moment. The attribute can be categorized as valid if it is capable to achieve the research objective. Data is valid if the counted correlation coefficient Rcount > Rtable, the correlation coefficient of Pearson’s table. Rtable = 0.361 and correlation is significant at the 0.05 level (2-tailed). An attribute can be categorized as reliable if it can be used repeatedly. The reliability test was pursued using Alpha Cronbach. The attribute can be categorized as reliable if the minimum value of correlation coefficient Rcount is 0.6. Thirteen usability attributes were valid and reliable (Table 2).
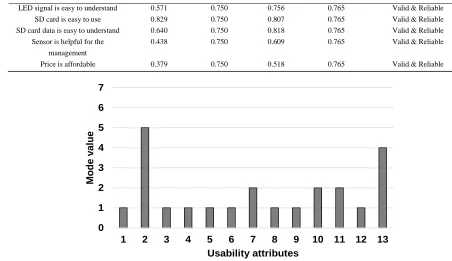
Figure 3 indicated the statistical mode value of attributes from scale 1 to 7. Scale 1 to 3 indicated the positive response, while 4 to 7 indicated the negative response. Most of them were in the range of positive response which is indicated from the scale of 1 to 2. There were two attributes in a range of negative response as attribute 2 of “Not easy to handle” (Scale of 4) and attribute 13 of “Price is not affordable” (Scale of 5). The research result confirmed the subjective ratings from Ehmen et al. (2012) which indicated the clear demand of a consumer toward for the device usability. Besides, the result confirmed Traxler et al. (2015) that subjective ratings could be used for usability evaluation of a sensor.
Table 2 Validity and reliability test for usability attributes
Usability Attributes
Batch 1 Batch 2
Notes Rcount
Alpha
Cronbach Rcount Alpha Cronbach
LED signal is easy to understand 0.571 0.750 0.756 0.765 Valid & Reliable SD card is easy to use 0.829 0.750 0.807 0.765 Valid & Reliable SD card data is easy to understand 0.640 0.750 0.818 0.765 Valid & Reliable
Sensor is helpful for the management
0.438 0.750 0.609 0.765 Valid & Reliable Price is affordable 0.379 0.750 0.518 0.765 Valid & Reliable
Figure 3 Usability evaluation of KESAN.
The negative response of attribute 2 was due to the oversize of microcontroller and power source. The negative response of attribute 13 was due to many managers were not familiar with the trade-off between price and benefit-cost ratio due to the newly developed device. The price was reasonable on IDR 600.000, - or equal to USD 45, - for an appropriate technology of device. The price was proposed based on the estimated production cost. Both attributes are suggested to be improved for further customization of the device.
3.2 Workload monitoring in consecutive production
Table 3 indicated the results of workload monitoring in fish processing, crackers and bakery industry for
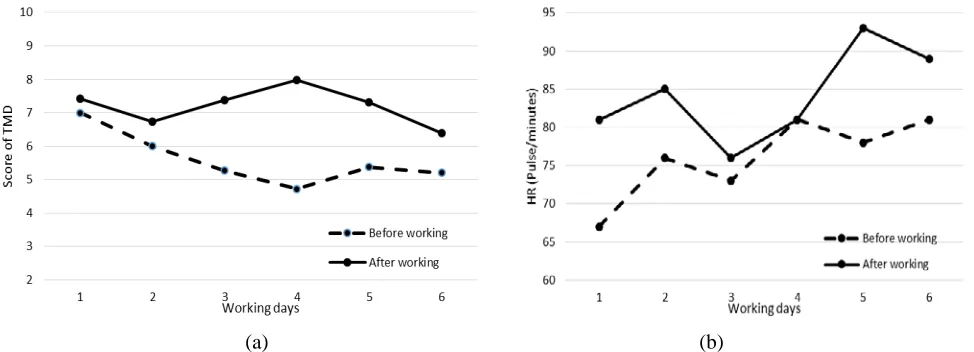
consecutive days of production. KESAN evaluated the sample of the female worker in the fish processing industry as over workload during six evaluation days. The over workload status indicated that the worker performs higher than their installed capacity (Ushada et al., 2013, 2015a, 2017).
Results of over workload were confirmed in Figure 4a, which indicated the gap patterns of TMD before and after work. Besides, results of HR confirmed the similar patterns in Figure 4b. The results of gap patterns confirmed our previous result that TMD and HR were sensible to verify the worker physiological response (Ushada et al., 2015b).
Table 3 Performance result of KESAN during consecutive days of production
Worker/ Days 1 2 3 4 5 6
FP Over workload Over workload Over workload Over workload Over workload Over workload C Less workload Less workload Less workload Less workload Normal workload Less workload
B1 Normal
workload
Normal workload
Over workload Normal workload
Normal workload Over workload
B2 Normal
workload
Normal workload
Over workload Less workload Less workload Over workload
B3 Normal
workload
Over workload Over workload Normal workload
Less workload Over workload B4 Less workload Less workload Less workload Over workload Normal workload Over workload
B5 Normal
workload
Normal workload
Over workload Over workload Normal workload Over workload
Notes: FP = Worker of Fish Processing. C = Worker of Crackers. B = Workers of Bakery 0
1 2 3 4 5 6 7
1 2 3 4 5 6 7 8 9 10 11 12 13
M
ode v
al
ue
(a) (b)
Figure 4 Evaluation of KESAN in consecutive days for worker FC1 in fish processing industry: (a) Score of TMD; (b) HR
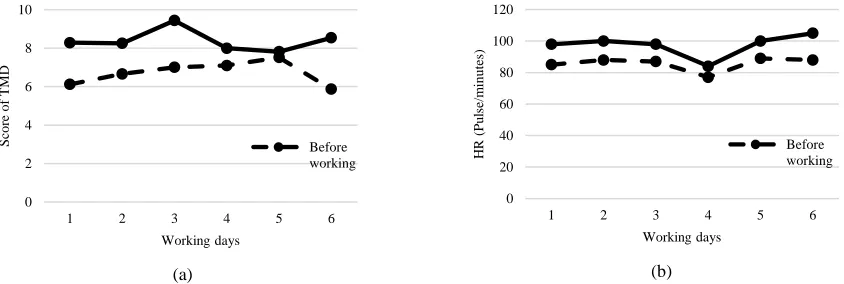
In crackers industry, KESAN predicted the sample of the male worker as less workload for the most days, except for day 5. The less workload status indicated that the working capacity was high and less utilized to achieve optimum performance. The normal status was confirmed in different patterns of day 5. Day 5 indicated the first day of decreasing trends for TMD before working and increasing trends after working (Figure 5a).
Different patterns in day 5 were caused by the highest
gap in heart rate between before and after working (Figure 5b). The transition status from less workload (Day 4) to normal (Day 5) indicated the optimum workload. It could be indicated by increasing patterns of TMD score after working (Figure 5a) and decreasing patterns of heart rate after working (Figure 5b). These results confirmed our previous research that normal status indicated the work capacity was maximum utilized and equal to production rate (Ushada et al., 2015a).
(a) (b)
Figure 5. Evaluation of KESAN in consecutive days for worker C1 in crackers industry: (a) Score of TMD; (b) HR
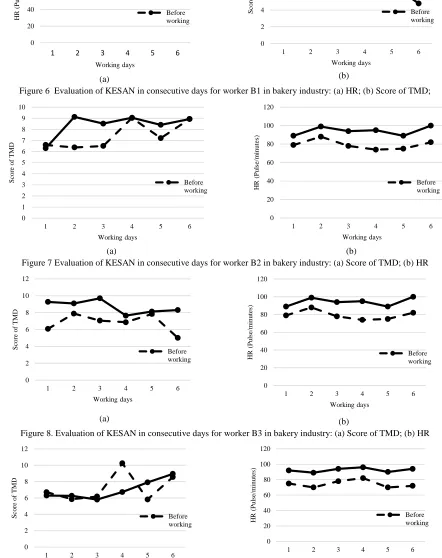
In the bakery industry, KESAN predicted various worker status. Figures 6-10 indicated the various pattern of workload status for each worker in bakery industry from less, normal and over workload. Figures 6a, 6b, 8a, 8b, 10a, and 10b, indicated the value of TMD and HR after working is higher than before working, while figures 7a, 7b, 9a, and
(a) (b)
Figure 6 Evaluation of KESAN in consecutive days for worker B1 in bakery industry: (a) HR; (b) Score of TMD;
(a) (b)
Figure 7 Evaluation of KESAN in consecutive days for worker B2 in bakery industry: (a) Score of TMD; (b) HR
(a) (b)
Figure 8. Evaluation of KESAN in consecutive days for worker B3 in bakery industry: (a) Score of TMD; (b) HR
(a) (b)
Figure 9 Evaluation of KESAN in consecutive days for worker B4 in bakery industry: (a) Score of TMD; (b) HR
0 20 40 60 80 100 120
1 2 3 4 5 6
H R ( P u ls e/m in u te s) Working days Before working 0 2 4 6 8 10 12
1 2 3 4 5 6
S cor e of T M D Working days Before working 0 1 2 3 4 5 6 7 8 9 10
1 2 3 4 5 6
S cor e of T M D Working days Before working 0 20 40 60 80 100 120
1 2 3 4 5 6
H R ( P u ls e/m in u te s) Working days Before working 0 2 4 6 8 10 12
1 2 3 4 5 6
S cor e of T M D Working days Before working 0 20 40 60 80 100 120
1 2 3 4 5 6
H R ( P u ls e/m in u te s) Working days Before working 0 2 4 6 8 10 12
1 2 3 4 5 6
S cor e of T M D Working days Before working 0 20 40 60 80 100 120
1 2 3 4 5 6
(a) (b)
Figure 10. Evaluation of KESAN in consecutive days for worker B5 in bakery industry: (a) Score of TMD; (b) HR 3.3 Workload monitoring in non-consecutive production
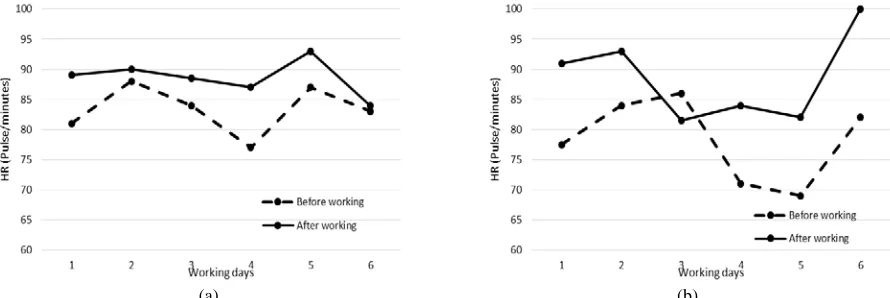
Table 4 indicated the interesting result that worker 1 and 2 have same workload status during four days measurement. They had the same workload status during
four non-consecutive days because both of the workers had the fasting condition. Besides, Figures 11a, 11b, 12a, and 12b indicated the clear difference between before and after working.
Table 4 Performance result of KESAN during non-consecutive days of production
Worker/ Days 1 2 3 4
B1 Less workload Normal workload Normal workload Over workload B2 Less workload Normal workload Normal workload Over workload
(a) (b)
Figure 11 Evaluation of KESAN in non-consecutive days for worker B1 in bakery industry: (a) Score of TMD; (b) HR
(a) (b)
Figure 12 Evaluation of KESAN in non-consecutive days for worker B2 in bakery industry: (a) Score of TMD; (b) HR
Tables 3 and 4 concluded that eight from nine workers indicated the over workload status in the last days of a
working cycle within 1 week. Eight workers were from fish chips and bakery industry. One worker from crackers
0 2 4 6 8 10
1 2 3 4 5 6
S cor e of T M D Working days Before working 0 20 40 60 80 100 120
1 2 3 4 5 6
H R ( P u ls e/m in u te s) Working days Before working 0 2 4 6 8 10 12
1 2 3 4
S cor e of T M D Working days Before working 0 20 40 60 80 100 120
1 2 3 4
H R ( P u ls e/m in u te s) Working days Before working 0 2 4 6 8 10 12
1 2 3 4
S cor e of T M D Working days Before working 0 20 40 60 80 100 120
1 2 3 4
industry indicated the less workload status in the last days. It can be concluded that the worker had a significant workload at the end of one production cycle during one week.
3.4 Verification for measurement periods
The measurement periods must be verified since the data captured by the device can reflect the difference caused by working. The verification was pursued using TMD and HR for another two evaluation weeks in fish processing industry (12 working days). TMD was used due to the representation of verbal parameter. HR was used due
to the capability of rapid measurement. The entire working days indicated TMD score of after working was higher than before (Figures 13a and 13b).
The pattern of HR indicated a similar result (Figures 14a and 14b). The contrary result of HR was indicated on the third day of second evaluation weeks. The lower heart rate after working was caused by the end of one production cycle during the day. Verification results indicated that measurement periods of before and after work could be used for workload monitoring in application of KESAN.
(a) (b)
Figure 13 Evaluation of KESAN for measurement periods in fish processing agro-industry using the score of TMD: (a) First evaluation weeks; (b) Second evaluation weeks
(a) (b)
Figure 14. Evaluation of KESAN for measurement periods in fish processing agro-industry using HR: (a) First evaluation weeks; (b) Second evaluation weeks
3.5 Feedback for design improvement of KESAN
Two usability attributes of “Not easy to handle” and “Price is not affordable” are accommodated in the improvement of KESAN. The improvement was based on the modification of dimension and resizing the platform of the microcontroller. The improved design has more compact dimension (Length = 15 cm, Wide = 9 cm dan
Thick = 2.8 cm), than the recent ones (Length = 17 cm, Wide = 9 cm and Thick = 4 cm). The compact design is expected to reduce the production cost and price of device technology.
4 Conclusion
attributes were accepted by respondent. There were two attributes which required further improvement as “Not easy to handle” and “Price is not affordable”. The attributes are accommodated in the improvement of KESAN. The improvement was based on the modification of dimension and resizing the platform of the microcontroller.
Evaluation of performance factors indicated the satisfied performance of KESAN based on the different scenario of production schedules. The device evaluated the over workload status of female worker in the fish processing industry. Besides, the most status of male worker in the crackers industry was evaluated as less workload. The device evaluated three workload status of male and female worker in the bakery industry as less, normal and over workload. The evaluation results in fish processing, crackers and bakery successfully verified for workload monitoring and measurement periods. Verification results indicated that measurement periods of before and after work could be used for workload monitoring in application of KESAN.
The evaluation results concluded the KESAN is usable for the manager and possible use of practice for workload monitoring in agro-industry. Most workers indicated over workload status in the last days of working within one week. The evaluation results of usability attributes and performance factors will be used as the feedback for design improvement of workload monitoring device based on human-machine interfaces.
Acknowledgment
This research was financially supported by the Ministry of Research, Technology and Higher Education of the Republic of Indonesia with 2016-2017 Research Grants of International Collaboration Competitive Research Grant for International Publication-Universitas Gadjah Mada ‘Penelitian Kerjasama Luar Negeri dan Publikasi Internasional” 2016 (No: 015/SP2H/LT/DRPM/II/2016 and 1037/UN1-P.III/LT/DIT-LIT/2016) and 2017 (No: SP DIPA-042.06.1.401516/2017 and
2273/UN1.P.III/DIT-LIT/LT/2017).
References
ASEAN. 2008. “ASEAN economic community blueprint”. ASEAN Secretariat, Jakarta, ISBN 978-979-3496-77-1. Accessed on September 2016.https://asean.org/wp-content/uploads/archive/5187-10.pdf
Indonesian National Ministry of Industry. 2011. “Outlook Industry 2012: Strategy for accelerating and enhancing agroindustry”. Indonesian National Ministry of Industry. Accessed on
September 2016.
https://kemenperin.go.id/artikel/2062/Seminar-Outlook- Industri-2012-Strategi-Percepatan-Dan-Perluasan-Agroindustri-
Burkolter, D., B. Weyers, A. Kluge, and W. Luther. 2014. Customization of user interfaces to reduce errors and enhance user acceptance. Applied Ergonomics, 45(2): 346-353.
Daria, B., C. Martina, P. Alessandro, and S. Fabio. 2015. Linking human availability and ergonomics parameters in order-picking systems. IFAC-PapersOnLine, 48(3): 345-350. Demartini, G. 2015 Hybrid human–machine information systems:
challenges and opportunities. Computer Networks, 90: 5-13. Di Pasquale, V., S. Miranda, R. Iannone, and S. Riemma. 2015. An
HRA-based simulation model for the optimization of the rest breaks configurations in human-intensive working activities. IFAC-PapersOnLine, 48 (3): 332-337.
Ehmen, H., M. Haesner, I. Steinke, M. Dorn, M. Gövercin, and E. Steinhagen-Thiessen. 2012. Comparison of four different mobile devices for measuring heart rate and ECG with respect to aspects of usability and acceptance by older people. Applied Ergonomics, 43(3): 582-587.
Herrera, R. S., M. A. Márquez, A. Mejías, R. Tirado, and J. M. Andújar. 2015. Exploring the usability of a remote laboratory for photovoltaic systems. IFAC-PapersOnLine, 48(29): 7-12. Muthig, O., J. Wang, Q. Deng, and D. Söffker. 2015. Integrating
situated human interaction modeling and stochastic state automata for improved technical situation awareness. IFAC-PapersOnLine, 48(1): 87-92.
Traxler, L., N. Bayer, B. Reutterer, and A. Drauschke. 2015. Improvement of optics, mechanics and the usability of a mechanical eye model for vision quality evaluation of IOLs. IFAC-PapersOnLine, 48(4): 1-18.
Ushada, M., A. Wicaksono, and H. Murase. 2012. Design of moss greening material for merapi disaster prone area using kansei engineering. Engineering in Agriculture, Environment, and Food, 5(4): 140-145.
Combining drum-buffer-rope Algorithm and Kansei engineering to control capacity constrained worker in a bioproduction system. IFAC Proceedings Volumes, 46(4): 384-389.
Ushada, M., T. Okayama, and H. Murase. 2015a. Development of Kansei Engineering-based watchdog model to assess worker capacity in Indonesian small-medium food industry. Engineering in Agriculture, Environment, and Food, 8 (4): 241-250.
Ushada, M., T. Okayama, N. Khuriyati, and A. Suyantohadi. 2015b. Kansei’s physiological measurement in small-medium sized enterprises using profile of mood states and heart rate. In Industrial Engineering, Management Science and Applications 2015, eds. M. Gen, K. Kim, X. Huang, and Y. Hiroshi, Lecture Notes in Electrical Engineering 349, 939-948. Berlin, Heidelberg: Springer.
Ushada, M., T. Okayama, A. Suyantohadi, N. Khuriyati, and H. Murase. 2017. Kansei Engineering-based artificial neural network model to evaluate worker performance in
small-medium scale food production system. International Journal of Industrial and Systems Engineering, 27(1): 28-47.
Ushada, M., T. Okayama, A. Suyantohadi, N. Khuriyati, and D. R. Fudholi. 2016. Integrated workload assesment sensor for agro-industrial production system (In Bahasa Indonesia: Alat penilai beban kerja terpadu di sistem produksi agroindustri); Indonesia Patent Application Registration Number : P00201601182 on February 24, 2016).
Weyer, J., R. D. Fink, and F. Adelt. 2015. Human–machine cooperation in smart cars. An empirical investigation of the loss-of-control thesis. Safety Science, 72: 199-208.
Xia, J., J. Zhang, and R. Wang. 2015. Regulation of adaptive human-machine system based on fuzzy inference petri net. IFAC-PapersOnLine, 48(20): 475-480.