IJPAR |Vol.6 | Issue 1 | Jan - Mar -2017
Journal Home page: www.ijpar.com
Research article Open Access
Method development and validation of simultaneous estimation of
hydrochlorothiazide and triamterene in combined tablet dosage form by
RP-HPLC method
Dr.A.Yasodha*
1, A.Chandramouli
1, G.Venkataih
1, A.Sivakumar
21
Dhanvanthri College of Pharmaceutical Sciences, Mahabubnagar- 509002, Telangana, India.
2
AurobindoPharma Limited, Unit –VII, Jadcherla, Hyderabad.
*Corresponding Author: Dr.A.YasodhaEmail: [email protected]
ABSTRACT
A new simple, accurate, rapid and precise isocratic high performance liquid chromatographic (HPLC) method was developed and validated for the determination of Hydrochlorothiazide (HTZ), and Triamterene (TMT) in tablet formulation. The optimized conditions comprises of column Purospher ®STAR C18 250 mm x 4.6 mm I.D; 5 μm with a flow rate of 1.0 mL/min, 0.05 M Phosphate buffer, methanol and acetonitrile mixture was used as mobile phase in the ratio 55:35:10 v/v at a detection wavelength 270 nm. Retention times of HTZ and TMT were found to be 3.49 min, and 4.68 min with a tailing factor 1.25, 1.27 and 4704, 4841 as theoretical plates respectively which are within the limits. All the parameters were validated according to the ICH guidelines and found to be within limits. Limit of detection (LOD) and Limit of quantification (LOQ) were estimated from the signal-to-noise ratio. The LOD values of HTZ and TMT were found to be 0.089 and 0.251 µg/mL respectively. HTZ and TMT LOQ’s were found to be 0.27, and 0.78µg/mL respectively. Linearity ranges for HTZ, and TMT were 2-10 µg/mL, and 3-15 µg/mL respectively. Percent recovery study values of HTZ and TMT were found to be within 98-102 %. This new method was successfully developed and validated as per ICH guidelines, can be utilized for the quantitative estimation of HTZ and TMT in pharmaceutical dosage forms.
Keywords:
Hydrochlorothiazide, Triamterene, RP-HPLC, Validation, Simultaneous estimation.INTRODUCTION
Analytical chemistry derives its principles from various branches of science like chemistry, physics, microbiology, nuclear science and electronics. This method provides information about the relative amount of one or more of these components [1].
Every country has legislation on bulk drugs and their pharmaceutical formulations that sets standards and obligatory quality indices for them. These regulations are presented in separate articles relating to individual drugs and are published in the form of book called “Pharmacopoeia” (e.g. IP, USP, and BP). Quantitative chemical analysis is an
important tool to assure that the raw material used and the intermediate products meet the required specifications. Every year number of drugs is introduced into the market. Also quality is important in every product or service, but it is vital in medicines as it involves life [1].
There is a time lag from the date of introduction of a drug into the market to the date of its inclusion in pharmacopoeias. This happens because of the possible uncertainties in the continuous and wider usage of these drugs, report of new toxicities and development of patient resistance and introduction of better drugs by the competitors. Under these conditions standard and analytical procedures for
these drugs may not be available in Pharmacopoeias. In instrumental analysis, a physical property of the substance is measured to determine its chemical composition. Pharmaceutical analysis comprises those procedures necessary to determine the identity, strength, quality and purity of substances of therapeutic importance [2].
The aim of the proposed work, attempt shall be made to develop new analytical method for simultaneous estimation of Triamterene and Hydrochlorothiazide in bulk and combination by HPLC and validate the above methods as per ICH guidelines [2].
MATERIALS AND METHODS
Materials
Table 2.1 List of chemicals.
MATERIAL SOURCE
Acetonitrile Sonicator
Potassium Phosphate Buffer Column
Hydrochloric Acid Injection system
Hydrochlorothiazide, Triamterene API Ph meter
Maxzide Tablets Micropipette
METHODS
Preparation of 0.01 M HCl
0.01 M HCL was prepared by taking 0.08 mL of HCl (37 %) dissolved in few mL of HPLC grade water and made up to 100mL with HPLC grade water [3].
Preparation of 0.05M Phosphate buffer
0.68045 grams of KH2PO4 was accurately weighed and transferred into a 1000 mL beaker, dissolved and made up to the volume with HPLC grade water and the pH was adjusted with 0.01 M HCl [4].
Preparation of mobile phase
A Combination of 0.05M Phosphate buffer-pH 3.8 (65 %), Methanol (35 %), Acetonitrile (10 %) was mixed and degassed in ultrasonic water bath for 5 minutes, finally filtered through 0.45 µ membrane filter. This prepared solution was used as mobile phase. This solution was also used for specificity blank solution [3].
Preparation of standard stock solution
Standard stock solution 200 μg/mL HTZ and 300 μg/mL TMT was prepared by dissolving 2 mg of HTZ and 3 mg of TMT in 10 mL of methanol and sonicated to degas [4].
Preparation of standard solution for trials
A solution of 2 µg/mL of HTZ and 3 µg/mL of TMT was prepared by taking 0.1 mL of stock solution into a 10 mL volumetric flask and diluted up to the mark with diluent with respect to trials [4].
Preparation of solutions for Assay
Standard solution
Sample solution
Maxzide-25 a commercial formulation containing a combination of Hydrochlorothiazide and Triamterene has been taken up for evaluating the proposed method for formulation. Ten tablets were weighed and titurated to a fine powder, was weighed accurately weight equivalent to 10 mg (i.e., 9.525 mg) from the powdered sample and dissolved in few mL of methanol and diluted to 10 mL with methanol.
The solution was shaken well and allowed to stand for 15 min with intermittent sonication to
ensure complete solubility of drug and filtered through a 0.45 μm membrane filter. From the filtrate, further dilution was made in a 10 mL volumetric flask by taking 0.3 mL of above solution and diluted to 10 mL with diluent (0.05M Phosphate Buffer of pH 3.8 (see chapter 6.2.1.2), Methanol and Acetonitrile in the ratio of 55:35:10) to get 6 μg/mL HTZ and 9 μg/mL TMT respectively [6-8].
Calculations
The % Assay was calculated by the following formula
Where:
AT = average area counts of sample preparation. AS = average area counts of standard preparation. WS = Weight of working standard taken in mg. WT = Weight of sample taken in mg.
DT = sample dilution DS = standard dilution
P = Percentage purity of working standard. LC = label claim in mg.
Preparation of solution for system suitability
A solution of 2 µg/mL of HTZ and 3 µg/mL of TMT was prepared by taking 0.1 mL of stock solution into a 10 mL volumetric flask and diluted
up to the mark with mobile phase. This solution was also used for specificity[8-9].
Preparation of solutions for Linearity
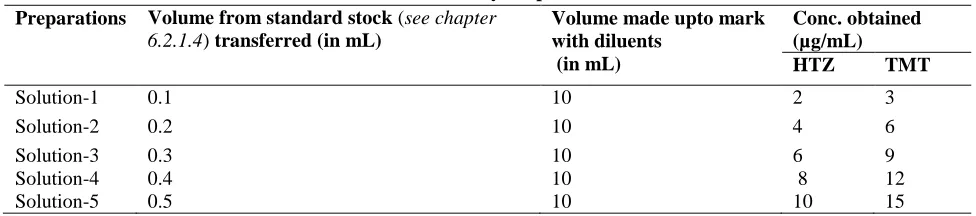
To establish linearity, the stock solutions were prepared (200 μg/mL Hydrochlorothiazide) and (300 μg/mL Triamterene) using methanol as the solvent, again from the stock solution further dilutions were given inTable 6.3 The experiments were performed by using HPLC instrument by injecting 20 μL and repeated for three times and the chromatograms were recorded. The coefficient of determination, equation of regression line obtained from the calibration curves[9-12].
Table 2.2.8.1 Linearity Preparations. Preparations Volume from standard stock (see chapter
6.2.1.4) transferred (in mL)
Volume made upto mark with diluents
(in mL)
Conc. obtained (µg/mL)
HTZ TMT
Solution-1 0.1 10 2 3
Solution-2 0.2 10 4 6
Solution-3 0.3 10 6 9
Solution-4 0.4 10 8 12
Solution-5 0.5 10 10 15
Preparation of solutions for Accuracy
To the prepared sample solution (see chapter 6.2.1.6 ) 0.8 mL, 1.0 mL and 1.2 mL of standard
solutions were added to get concentration of 80%, 100%, 120% (table 6.4) respectively [12-15].
Table 2.2.9.1 Sample preparation for Accuracy.
Level Amount of HTZ added (µg/mL) Amount of TMT added (µg/mL) Total volume (mL)
80% 8 12 10
100% 10 15 10
RESULTS AND DISCUSSION
Selection of wavelength
The sensitivity of the HPLC method which uses UV detection depends upon the proper selection of wavelength. An ideal wavelength is one that gives good response for all the drugs to be detected. The
prepared HTZ and TMT standard solution was placed in UV-Spectrophotometer and spectra was recorded in the UV region 200 nm-400 nm. The same absorbance for both the drugs was found at 270 nm (Fig. 7.1) and it is the isobestic point. Hence 270 nm was selected as detector wavelength for the HPLC chromatographic technique.
Fig.3.1.1: Spectrum of Hydrochlorothiazide (HTZ) and Triamterene (TMT).
Selection of chromatographic methods
The proper selection of methods depends upon the nature of the sample (ionic or ionisable or neutral molecule) its molecular weight and stability. The drugs selected are polar, ionic and Reversed phase chromatography can be used because of its simplicity and suitability.
Method development trials
Aliquots of the mixed solutions containing HTZ and TMT were prepared and a number of eluting experiments were conducted for the optimization of separation of drugs using mobile phase. The trials
were conducted by taking Stationary phase Purospher STAR RP-C18 (250 mm x 4.6 mm I.D; 5 μm), Flow rate 1 mL/min, λmax 270 nm, Injection volume 20 µL, Run time 8- 20 min and changing the mobile phase compositions.
TRIAL: 1
Mobile phase
Methanol: water were mixed in the ratio of 90:10 and sonicated to degas. 20 µL of prepared solution was injected into the HPLC and the chromatograms were recorded (Fig.3.3.1).
Fig. 3.3.1 Trial 1 chromatogram of HTZ and TMT.
Table 3.3.1 Results of trial-1
Drugs Rt Theoretical Plates Tailing Factor Resolution
HTZ 2.65 3709 2.65 -
The HTZ peak was observed at 2.65 min with theoretical plates 3709 and tailing factor 2.65, TMT peak was observed at 3.07 min with theoretical plates 1072 and tailing factor 2.10. The resolution between peaks was found to be 0.23 (Table 3.3.1). The theoretical pates for HTZ were within the limits and for TMT they were below the limits. Poor resolution of peaks and less theoretical plates
were observed for TMT as they were not within the acceptable recommendations.
TRIAL: 2
Mobile phase
Methanol: Water were mixed in the ratio of 60:40 and sonicated to degas.20 µL of prepared solution was injected into the HPLC and the chromatograms were recorded (Fig.3.3.2).
Fig.3.3.2 Trial 2 chromatogram of HTZ and TMT.
Table 3.3.2:Results of trial-2
Drugs Rt Theoretical Plates Tailing Factor Resolution
HTZ 2.892 5787 1.54 -
TMT 4.31 1594.1 1.76 2.57
The HTZ peak was observed at 2.892 min with theoretical plates 5787 and tailing factor 1.54, TMT peak was observed at 4.31 min with theoretical plates 1594.1 and tailing factor 1.76. The resolution between peaks was found to be 2.57 (Table 3.3.2). Lack of enough theoretical plates was observed for TMT. So further trials has been done in order achieve this.
TRIAL: 3
Mobile phase
Methanol: Acetonitrile: Water were mixed in the ratio of 50:30:20 and sonicated to degas.20 µL of prepared solution was injected into the HPLC and the chromatograms were recorded (Fig.3.3.3).
Fig.3.3.3 Trial 3 chromatogram of HTZ and TMT.
Table 3.3.3 Results of trial-3
Drugs Rt Theoretical Plates Tailing Factor Resolution
HTZ 2.717 6228 1.57 -
The HTZ peak was observed at 2.717 min with theoretical plates 6228 and tailing factor 1.53, TMT peak was observed at 3.042 min with theoretical plates 4433 and tailing factor 1.73. The resolution between peaks was found to be 0.84 (Table 3.3.3). Resolution of the compounds was not satisfactory for both drugs.
TRIAL: 4
Mobile phase
Methanol: Acetonitrile: Water were mixed in the ratio of 70:10:20 and sonicated to degas.20 µL of prepared solution was injected into the HPLC and the chromatograms were recorded (Fig.3.3.4).
Fig.3.3.4 Trial 4 chromatogram of HTZ and TMT.
Table3.3.4Results of trial-4
Drugs Rt Theoretical Plates Tailing Factor Resolution
HTZ 2.700 4510.87 1.9 -
TMT 3.142 3317.24 2.72 0.97
The HTZ peak was observed at 2.7 min with theoretical plates 4510.8 and tailing factor 1.9, TMT peak was observed at 3.142 min with theoretical plates 3317 and tailing factor 2.72. The resolution between peaks was found to be 0.97 (Table 3.3.4). Resolution of the compounds and tailing factor was not satisfactory for both HTZ and TMT compounds.
TRIAL: 5
Mobile phase
0.05 M Phosphate Buffer - pH 6.2 Methanol and Acetonitrile were mixed in the ratio of 30:60:10 and sonicated to degas.20 µL of prepared solution was injected into the HPLC and the chromatograms were recorded (Fig.3.3.5).
Fig.3.3.5 Trial 5 chromatogram of HTZ and TMT.
Table3.3.5Results of trial-5
Drugs Rt Theoretical Plates Tailing Factor Resolution
HTZ 2.93 2491 1.19 -
The HTZ peak was observed at 2.93 min with theoretical plates 2491 and tailing factor 1.19, TMT peak was observed at 4.68 min with theoretical plates 4330.2 and tailing factor 1.81. The resolution between peaks was found to be 2.8 (Table 3.3.5). Irregular peak shape was observed for HTZ.
TRIAL: 6
Mobile phase
0.05M Phosphate buffer pH 6.2 methanol and acetonitrile were mixed in the ratio of 50:35:15 and sonicated to degas. Prepared solution of injection volume 20 µL was injected into the HPLC and the chromatograms were recorded (Fig.3.3.6).
Fig.3.3.6:Trial 6 chromatogram of HTZ and TMT.
Table3.3.6Results of trial-6
Drugs Rt Theoretical Plates Tailing Factor Resolution
HTZ 3.85 2791 2.24 -
TMT 4.82 2851 2.32 2.41
The HTZ peak was observed at 3.85 min with theoretical plates 2791 and tailing factor 2.24, TMT peak was observed at 4.82 min with theoretical plates 2851 and tailing factor 2.32. The resolution between peaks was found to be 2.41 (Table 3.3.6). Poor peak shape and tailing was observed for HTZ and TMT.
TRIAL: 7
Mobile phase
0.05 M Phosphate buffer-pH 6.2 Methanol: Acetonitrile in the ratio of 55:35:10 v/v were mixed in the above ratio. 20 µL of prepared solution was injected into the HPLC and the observed chromatograms were recorded (Fig. 3.3.8).
Fig.3.3.7 Trial 7 chromatogram of HTZ and TMT.
Table3.3.7Results of trial-7
Drugs Rt Theoretical Plates Tailing Factor Resolution
HTZ 3.50 5084 2.19 -
The HTZ peak was observed at 3.50 min with theoretical plates 5084 and tailing factor 2.19, TMT peak was observed at 7.16 min with theoretical plates 5752 and tailing factor 2.20. The resolution between peaks was found to be 2.41 (Table 3.3.8). Tailing was observed for both HTZ and TMT and were beyond the limits.
TRIAL: 8
Mobile phase
0.05 M Phosphate buffer- pH 5.6 Methanol: Acetonitrile were mixed in the ratio of 55:35:10 v/v. About 20 µL of prepared solution was injected into the HPLC and the chromatograms were recorded (Fig.3.3.8).
Fig 3.3.8: Trial 8 chromatogram of HTZ and TMT.
Table3.3.8Results of 8
Drugs Rt Theoretical Plates Tailing Factor Resolution
HTZ 3.70 2491 2.48 -
TMT 7.34 2387 3.0 3.9
The HTZ peak was observed at 3.70 min with theoretical plates 2491 and tailing factor 2.48, TMT peak was observed at 7.34 min with theoretical plates 2387 and tailing factor 3.0. The resolution between peaks was found to be 0.23 (Table 3.3.8). Irregular peak shape and excess tailing was observed for HTZ and TMT.
TRIAL: 9
Mobile phase
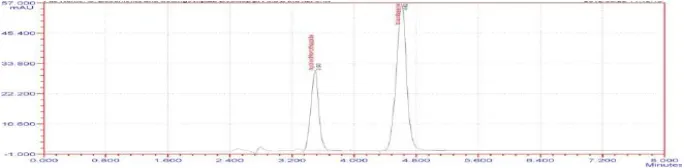
Phosphate buffer-pH 4.3 Methanol: Acetonitrile were mixed in the ratio of 55:35:10 v/v. prepared solution with injection volume 20 µL was injected into the HPLC and chromatograms were recorded. (Fig.3.3.9).
Fig.3.3.9:Trial 9 chromatogram of HTZ and TMT.
Table3.3.9:Results of trial-9
Drugs Rt Theoretical Plates Tailing Factor Resolution
HTZ 3.64 3065 2.30 -
TMT 5.44 2936 2.27 2.7
The HTZ peak was observed at 3.64 min with theoretical plates 3065 and tailing factor 2.30, TMT peak was observed at 5.44 min with theoretical
TRIAL: 10
Mobile phase
0.05M Phosphate buffer of pH 3.8 Methanol: Acetonitrile were mixed in the ratio of 55:35:10
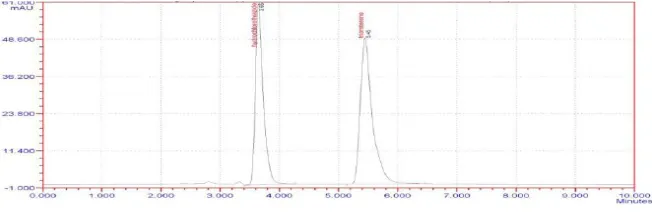
v/v. About 20 µL of prepared solution was injected into the HPLC and the chromatograms were recorded (Fig.3.3.10).
Fig. 3.3.10 Trial 10 Chromatogram of HTZ and TMT.
Table3.3.10Results of trial-10.
Drugs Rt Theoretical Plates Tailing Factor Resolution
HTZ 3.49 4704 1.25 -
TMT 4.68 4873 1.28 3.6
The HTZ peak was observed at 3.49 min with theoretical plates 4704 and tailing factor 1.25, TMT peak was observed at 4.68 min with theoretical plates 4873 and tailing factor 1.28.The resolution between peaks was found to be 3.6 (Table 3.3.10). Sharp peaks were observed at 3.49min for HTZ and
4.61min for TMT with a good resolution. All the parameters like resolution, tailing factors and RT’s were good and within limits according ICH guidelines. So this trail has been chosen as optimised method and further work was continued with this developed method that is validation.
OPTIMIZED CHROMATOGRAPHIC CONDITIONS FOR ASSAY
Table 3.4.1:Optimized chromatographic conditions.
Mobile phase 0.05M Phosphate buffer: Methanol: Acetonitrile (pH 3.8) in the ratio of 55:35:10v/v. Column Purosper® Star RP-18,250×4.6mm ID, 5µm Particle size
Flow rate 1 mL/min
Column temperature Room temperature(20-25oC) Sample temperature Room temperature(20-25oC) Wavelength 270 nm
Injection volume 20 µL
Run time 10min
Retention time About 3.49 min for HTZ and 4.61 min for TMT
Assay procedure
20L of the standard and sample solutions were injected into the HPLC system and the
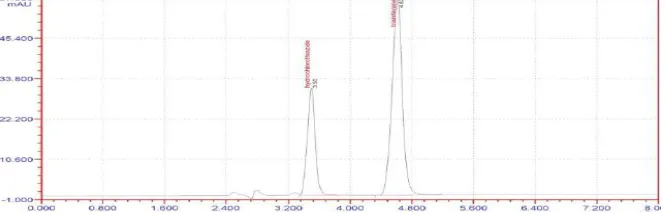
Fig.3.4.1:Chromatogram of tablet formulation.
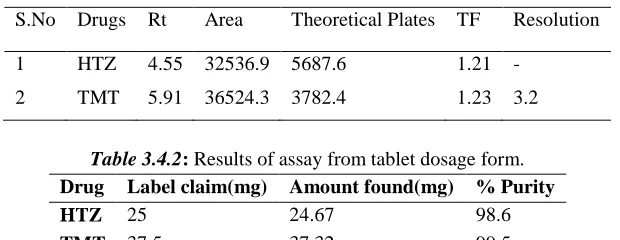
Table3.4.1:Results for HTZ and TMT.
S.No Drugs Rt Area Theoretical Plates TF Resolution
1 HTZ 4.55 32536.9 5687.6 1.21 - 2 TMT 5.91 36524.3 3782.4 1.23 3.2
Table 3.4.2:Results of assay from tablet dosage form. Drug Label claim(mg) Amount found(mg) % Purity
HTZ 25 24.67 98.6
TMT 37.5 37.32 99.5
The peaks for HTZ and TMT were observed at 4.55 min, 5.91 min with peak areas 32536.9, 36524.3, theoretical plates 5687.6, 3782.4, and tailing factor 1.21, 1.23 respectively. The resolution between the peaks was 3.2 (Table 3.1). The amount found from the tablet assay was 24.67 mg of Hydrochlorothiazide and 37.32 mg of Triamterene. The % purity was found to be 98.6, 99.5 (Table 3.4.2).The percentage purity of both
HTZ and TMT were found to be within the limits i.e., 98 - 102%.
VALIDATION OF HPLC FOR
METHOD DEVELOPMENT
To verify that the analytical system is working properly and can give accurate precise results, were evaluated by 2 µg/mL of and 3 µg/mL of Triamterene solution was injected six times.
Table 3.5.1:Results for system suitability of HTZ Injection RT Peak Area TP TF
1 3.495 10278.3 4704.05 1.25 2 3.501 10462.1 4532.16 1.08 3 3.487 10243.9 4821.47 1.21 4 3.581 10345.6 4763.52 1.14 5 3.445 10433.6 4865.21 1.32 6 3.489 10371.5 4792.51 1.24 Mean 3.4996 10355.83 4746.48 1.20 SD 0.0445 85.1245 - -
% RSD 1.2 0.82 - -
Table 3.5.2:Results for system suitability of TMT. Injection RT Peak area TP TF
3 4.721 14356.1 4795.29 1.25 4 4.698 14524.3 4789.12 1.19 5 4.701 14971.9 4812.43 1.28 6 4.651 14761.2 4813.45 1. 32 Mean 4.68166 14545.8 4803.282 1.242 SD 0.032592 277.867 - -
%RSD 0.69 1.2 - -
The % RSD for the peak area responses of HTZ and TMT peaks from 6 replicate injections of standard solution was 0.82, 1.2. The number of theoretical plates (TP) for the HTZ and TMT peaks was 4746.487, 4803.282. The Tailing factor (TF) for the HTZ and TMT peak was 1.20 (Table 3.5.1 & 3.5.2).
Acceptance criteria
The % RSD for the retention times and peak area of HTZ and TMT were found to be less than 2%. The plate count and tailing factor results were found to be satisfactory and within the limit.
Result
The % RSD for the retention times of HTZ and TMT peaks from 6 replicate injections of standard solution was found to be 1.2, 0.69.
SPECIFICITY
20L of the blank standard and sample solution were injected into the HPLC system and the chromatograms were recorded for blank (Fig.3.6.1), standard (Fig.3.6.2) and sample (Fig.3.6.3).
Fig. 3.6.1:Chromatogram of blank
Fig. 3.6.2:Chromatogram of HTZ and TMT standards.
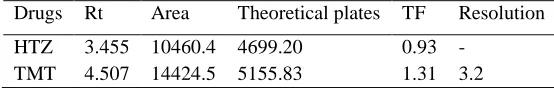
Table 3.6.1:Results for HTZ and TMT standards. Drugs Rt Area Theoretical plates TF Resolution HTZ 3.455 10460.4 4699.20 0.93 -
Fig. 3.6.3:Chromatogram of HTZ and TMT in sample preparation.
Table 3.6.2:Results for HTZ and TMT in sample preparation. Drugs Rt Area Theoretical Plates TF Resolution HTZ 3.605 10398.7 4077.35 1.76 -
TMT 4.824 14235.2 4313.55 1.40 3.1
The peaks for standard solution of HTZ and TMT were observed at 3.455 min, 4.507 min with peak areas 10460.43, 14424.5, theoretical plates4699.20, 5155.83 and tailing factor0.93, 1.31 respectively. The resolution between the peaks was 3.2 (Table 3.6.1).The peaks for sample solution of HTZ and TMT were observed at3.605 min, 4.824 min with peak areas10398.7, 14235.2, theoretical plates 4077.35, 4313.55, and tailing factor 1.76, 1.40 respectively. The resolution between the peaks was 3.1 (Table 3.6.2).
Acceptance criteria
No interference should be observed with the analyte of interest.
LINEARITY AND RANGE
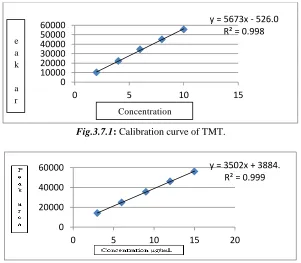
The prepared linearity sample solution was injected into the HPLC and observed peak area values for the concentration of HTZ and TMT solutions. Solution-1 (2 μg/mL, 3 μg/mL), Solution-2 (4 μg/mL, 6 μg/mL), Solution-3 (6 μg/mL, 9 μg/mL), Solution-4 (8 μg/mL, 12 μg/mL), Solution-5 (10 μg/mL, 15 μg/mL), were given below in the Table 7.18. A graph for HTZ (Fig. 3.7.1) and TMT (Fig. 3.7.2) was plotted against concentration Vs peak area and correlation coefficient (R2), equation of regression line obtained from the calibration curves were shown in the Table.
Fig.3.7.1:Calibration curve of TMT.
Fig.3.7.2: Calibration curve of TMT.
y = 5673x - 526.0 R² = 0.998
0 10000 20000 30000 40000 50000 60000
0 5 10 15
y = 3502x + 3884. R² = 0.999
0 20000 40000 60000
0 5 10 15 20
Concentration P
e a k
Table 3.7.1:Linearity data of HTZ and TMT.
S. No HTZ TMT
Concentration (µg/mL) Area Concentration (µg/mL) Area
Solution-1 2 10254.2 3 14210.1
Solution-2 4 22215.5 6 24935.9
Solution-3 6 34516.3 9 35576.2
Solution-4 8 44997.8 12 46167.1
Solution-5 10 55601.5 15 56125.9
Table 3.7.2:Observation for linearity.
S. No Parameter HTZ TMT
1 Correlation coefficient 0.998 0.999
2 Equation of Regression line y = 5673x - 526.05 y = 3502x + 3884.
The correlation coefficient for linear curve obtained between concentration vs. Area for standard preparations of HTZ and TMT is 0.998 and 0.99 respectively. The relationship between the concentration of HTZ and TMT and area of HTZ and TMT was linear in the range examined since all points were laid in a straight line and the correlation coefficient was well within limit.
Acceptance criteria
The Correlation coefficients R2 should not be less than 0.999
ACCURACY
Accuracy of the method was determined by recovery studies. To the formulation (pre analyzed sample), the reference standards of the drugs were added at the level of 80 %, 100 %, 120 % 20 µL of spiked samples were injected into HPLC and the chromatograms were recorded at 80 %, 100 %, and 120 % (Fig.3.8.1, 3.8.2 & 3.8.3).
Fig.3.8.1:Chromatogram for Accuracy 80 %.
Fig.3.8.3:Chromatogram for Accuracy 120 %.
Table3.8.1: Accuracy results for HTZ and TMT. Analyte Amount (%) of drug added to
analyte
Theoretical conc. (μg/mL)
Measured conc. (μg/mL)
Recovery (%)
% mean Recovery
HTZ
80 8 7.95 99.3
99.7
100 10 9.91 99
120 12 12.1 100.8
TMT
80 12 11.92 99.3
99.8
100 15 15.2 101.3
120 18 17.8 98.8
The recovery studies were carried out three times and the percentage recovery for HTZ and TMT was 99.3 (80%), 99 (100%), 100.8 (120%); 99.3 (80%), 101.3 (100%), 98.8 (120%) and percentage mean recovery 99.7 and 99.8 respectively.
Acceptance criteria
The percentage mean recovery should lie between 98-101.2%
PRECISION
The intra and inter-day precision was determined by analysing HTZ (6 μg/mL) and TMT (9 μg/mL) standard solution which was injected for six times on same day (intraday study) and repeated on the second day (interday study). The observed chromatograms were recorded (Fig.3.9.1 & 3.9.2).
Fig.3.9.1:Chromatogram for intraday precision.
Injection-4 35145.2 35873.0 Injection-5 34683.8 35688.9 Injection-6 34828.5 35429.3
Average 34883.4 35729.5
Standard Deviation 162.46 278.2
%RSD 0.46 0.77
Fig.3.9.2:Chromatogram for inter day precision.
Table3.9.2: Interday Precision results for HTZ and TMT. Injection Area of HTZ Area of TMT Injection-1 34516.3 35576.2 Injection-2 34823.2 35796.9 Injection-3 33987.8 35892.4 Injection-4 34757.3 34987.3 Injection-5 34726.2 34876.2 Injection-6 34528.1 35726.2
Average 34556.4 35475.8
Standard Deviation 305.49 435.3
% RSD 0.88 1.22
Acceptance criteria
The relative standard deviation of 6 determinations of HTZ and TMT for intra and inter day precision found to be within the acceptance criteria of less than 2.0 %
RESULT
The % RSD for the peak area responses of HTZ and TMT peaks from 6 replicate injections of standard solution for intraday and inter day
precision were 0.46, 0.77 and 0.88, 1.22 respectively.
LIMIT OF DETECTION (LOD) AND
LIMIT OF QUANTITATION (LOQ)
Six replicates of standard solution were injected into the HPLC. LOD and LOQ for HTZ and TMT were calculated from standard deviation of precision (Table 3.9.1) and slope of linearity graph from the equation (Table 3.9.2).
Result
The LOD, LOQ of HTZ and TMT were found to be 0.089 μg/mL, 0.27 μg/mL and 0.25 μg/mL, 0.78 μg/mL respectively.
ROBUSTNESS
The robustness of the method was determined as per ICH guidelines under different conditions including change in flow rate, wavelength, and pH
of buffer. The precision sample prepared was used for the robustness parameter. Variations in flow rate (0.8 mL/min and 1.2 mL/min), wavelength (268 nm and 272 nm) and pH (3.6 and 4.0) were made to evaluate the robustness parameter. The retention times, theoretical plates and asymmetry factor values were recorded (Table 3.11.1) and these variations were found to be in the acceptable changes.
Table3.11.1: Robustness results for HTZ and TMT. Actual conditions Variations made HTZ TMT
RT AF TP RT AF TP Flow rate 1 mL/min Flow rate 0.8 mL/min 4.553 1.47 4573.3 6.177 1.28 5349.1
Flow rate 1.2 mL/min 3.445 0.93 4699.2 4.507 1.31 5155.83 Wavelength 270 nm Wavelength 268 nm 3.521 1.25 4704.0 4.932 1.27 4841.27 Wavelength 272 nm 3.595 1.31 4670.1 5.040 1.43 5521.81 pH 3.8 pH 3.6 3.45 1.2 4789.2 4.517 1.31 5155.8
pH 4.0 3.542 1.18 4755.3 4.69 1.22 4675.5
Acceptance criteria
The tailing factor should not exceed 2%
Result
The tailing factor was found to be within the limits on small variation of flow rate, mobile phase pH and wavelength.
CONCLUSION
In RP-HPLC method, optimization of chromatographic parameters was done. After optimized of various parameters the optimized condition was found to be 0.05 M phosphate buffer (pH 3.8 adjusted with 0.01 M HCl), methanol, and acetonitrile in 55:35:10 % v/v ratios as mobile phase at a flow rate of 1 mL/min are optimum conditions for analysis. The peaks were well resolved with C18 column.
Using the optimized chromatographic conditions, chromatograms of mixed standard solutions which contained HTZ and TMT were recorded. Retention times were found to be 3.49 and 4.68 min for HTZ and TMT respectively. Calibration curves were obtained by using peak area vs. concentration and correlation coefficient value was found to be r2 > 0.999 for HTZ and TMT. This method was also tried on pharmaceutical dosage forms in order to find its accuracy and the recovery studies were found to be within limits i.e., for HTZ and TMT 99.7 %, 99.8 % respectively.
Precision of the method was studied by making the replicate injections of the standard solutions and standard deviation was determined. The reliability and sensitivity of the method could be seen from recovery studies. There is no interference due to excipients. The proposed method is simple, accurate, and rapid and it can be usedin industries.
REFERENCES
[1]. Skoog, A.; West, M. Introduction to analysis. Principles of Instrumental Analysis, Saunders College Publishers; 2, 1998, 666-709.
[2]. Kenneth, A. C.; Liquid Chromatography. A Text Book of Pharmaceutical Analysis, John Wiley &Sons, Inc.: 3, 2009, 373-438.
[4]. Jonczyk, A.; Nowakowska, Z. Determination of Hydrochlorothiazide Triamterene, Proponalol Hydrochloride by the spectrophotometric method and High Performance Liquid Chromatographic method. Acta Poloniae Pharmaceutica -Drug Research. 58, 2001, 339-344.
[5]. Stolarczyk, M.; Apola, A.; Krzek, J.; Lech, K. Simultaneous determination of Triamterene and Hydrochlorothiazide in tablets using derivative spectrophotometry. Acta Poloniae Pharmaceutica -Drug Research.65, 2008, 283-287.
[6]. Raja, B.; Lakshamana, A. Development and validation of a reversed phase HPLC method for simultaneous estimation of Olmesartan and Hydrochlorothiazide in combined tablet dosage form. International Journal of Research in Pharmacy and Chemistry.1, 2011, 714-717.
[7]. Pawar, A. K. M.; Nageshwara Rao, A. B. N.; Sankar, D. G.; Simultaneous estimation of Enalaprilmaleate, Hydrochlorothiazide, Aspirin an Atorvastatin in pure and its combined dosage form using RP-HPLC. Der PharmaciaLettre, 3, 2011, 58-67.
[8]. Lakshmi, K. S.; Amudhavalli, V.; Kartick, M. Determination of Olmesartan and Hydrochlorothiazide in combined dosage forms by Reversed phase HPLC method .Int.J.Chem.Sci, 9, 2011, 470-476.
[9]. Godse, V. D.; Bhosle, A. V.; Bafana, Y. S.; Borkar, D. D. Validated stability-indicating HPLC method for simultaneous determination of Olmesartan medoximil and Hydrochlorothiazide in combination drug. Eurasian J. Anal.Chem.2, 2010, 137-144.
[10].Al-Momani, I. F. Determination of Hydrochlorothiazide and Enalapril Maleate in tablet formulations by reversed-phase HPLC. Turk J Chem. 25, 2001, 49-54.
[11].Qutab, S. S.; Razzaq, S. N.; Ashfaq, M.; Shuja, Z. A.; Khan, I. U. Simple and sensitive LC–UV method for simultaneous analysis of Hydrochlorothiazide and candesartan cilexetil in pharmaceutical formulations. Acta Chromatographica. 19, 2007, 119-129.
[12].Deventer, K.; Pozo, O. J.; Vaneenoo, P.; Delbeke, F.T. Qualitative detection of diuretics and acidic metabolites of other doping agents in human urine by high-performance liquid chromatography–tandem mass spectrometry Comparison between liquid–liquid extraction and direct injection. Journal of Chromatography A. 1216, 2009, 5812-5827.
[13].Kargosha, K.; Saraffi, A. H. M. Spectrophotometric simultaneous determination of Triamterene and Hydrochlorothiazide in Triamterene-H tablets by multivariate calibration methods. Journal of Pharmaceutical and Biomedical. Analysis. 26, 2001, 273-279.
[14].Eerk, N. Determination of active ingredients in the pharmaceutical formulations containing Hydrochlorothiazide and its binary mixtures with benazepril hydrochloride, Triamterene and cilazapril by ratio spectra derivative spectrophotometry and vierordt’s method. Journal of Pharmaceutical and Biomedical. Analysis. 20, 1999, 155-167.