UDC 616.1:57.087
DOI: 10.21668/health.risk/2017.3.04.eng
APPLICATION OF REGRESSION ANALYSIS AND CLASSIFICATION
TREES IN CALCULATING ADDITIONAL POPULATION RISK OF ISCHEMIC HEART DISEASE
S.A. Maksimov, D.P. Tsygankova, G.V. Artamonova
Scientific Institution Research Institute for Complex Issues of Cardiovascular Diseases, 6 Sosnoviy blvd, Kemerovo, 650002, Russian Federation
Our research goal was to perform a comparative analysis of regression analysis application and tree classifi-cation appliclassifi-cation in calculating additional population risk on the example of ischemic heart diseases (IHD). Our research object was a random population sample comprising both male and female population aged 25-64 in Ke-merovo region (1,628 people) within ESSE-RF multi-centered epidemiologic research. We considered the following IHD risk factors: lipid metabolism parameters, arterial hypertension, lifestyle factors, psychoemotional peculiari-ties, and social parameters. IHD occurrence was assessed as per sum of 3 epidemiologic criteria: on the basis of ECG changes coding as per Minnesota code, Rose questionnaire, and cardiac infarction in case history. We calcu-lated additional population IHD risk determined by risk factors as per unified original algorithms, but with various statistic analysis techniques: logistic regression analysis and classification trees.
We built up mathematic models for IHD probability as per risk factors, with predictive significance equal to 83.8% for logistic regression analysis and to 71.9% for classification trees. The applied statistical analysis techniques show different contributions made by risk factors into IHD prevalence which results from absence of correlation between them.
IBD risk additional to population one and determined by risk factors as per both statistical analysis tech-niques in sex-age groups changed from negative values in age groups younger than 45 to positive values in older people. Increase in additional IHD risk in aged groups as per both techniques was practically linear with slight deviations. Difference in additional population risk calculated as per two statistical analysis techniques was insignificant and as a rule it didn't exceed 1.5%. Consequently, both techniques give similar results and can be equally used in calculating IHD population risk.
Key words: regression analysis, risk factor, ischemic heart disease, population risk, predictive models, sta-tistical analysis techniques.
Cardiovascular diseases etiology is de-termined by a lot of factors and it makes it necessary to consider probability of their evolvement and unfavorable outcomes with integral risk assessment models. Such models should include several basic fac-tors. In most cases one respondent can have a combination of two and even more
risk factors and a forecast for development and clinical course of cardiovascular dis-eases is much worse when several, even moderately apparent, risk factors are com-bined [8, 9,12,]. In particular, РROCAM research revealed that a combination of two or more factors of cardiovascular sys-tem disorders risks led to significant
in-__________________________
Maksimov S.A., Tsygankova D.P., Artamonova G.V., 2017
Sergei A. Maksimov – Candidate of Medical Sciences, Associate Professor; leading researcher at Laboratory for Cardiovascular Diseases Epidemiology (e-mail: [email protected]; tel.:+7 (3842) 64-42-40).
Dar'ya P. Tsygankova – researcher at Laboratory for Cardiovascular Diseases Epidemiology (e-mail: [email protected]; tel.: +7 (3842) 64-34-71).
crease in number of sudden deaths and cardiac infarctions [11, 13]. It made for a creation of "summary cardiovascular risk" notion [8]. Models for predicting individu-al risks have been widely used in everyday cardiologists' practices as they help to make decisions on prevention techniques and remedies, and on prescribing, giving up, or intensifying drug therapy [11, 13, 14]. Up to now, a great number of individ-ual risks prediction models have been de-veloped including such well-known ones as Framingham Risk Score, SCORE, PROCAM etc., as well as their numerous modifications [1, 2, 10, 11, 13, 14].
Population cardiovascular diseases risks are usually assessed when epidemio-logic research takes place; such assess-ments are mostly aimed at modeling and predicting risks at population or subpopu-lation level (regions or popusubpopu-lation groups) [4]. Population regularities modeling is frequently used in practice to solve tasks set before a public healthcare system, for example, assessing efficiency of various approaches to treatment and prevention [3, 4, 15].
Approaches to population risk assess-ment which we have created are methodo-logically in line with individual cardiovas-cular risks scores [5]. In the latter case in-dividuals are an object of analysis; and risk factors which they have (for example, smoking) and quantitative characteristics describing them (for example, age or blood pressure) are integrated into a final predic-tive cardiovascular risk value. When a population risk is assessed, research focus-es on population groups and cardiovascular risk factors prevalence can differ signifi-cantly among them due to their heterogene-ity as per medical-demographical, national, geographic, and social-economic, and other peculiarities. In this case population risk integration is based on analyzing both
dis-crepancies in risk factors prevalence and assessing their contribution into examined cardiovascular events.
Application of methodical approaches which we created allowed to derive a com-plex characteristics for a cardiovascular risk factors burden (17 factors) in 14 occu-pational groups with different working conditions [6]. Population risk analysis of ischemic heart disease (IHD) based on in-tegral assessment of 12 risk factors enabled detecting sex-age and social-economic regularities of the examined disease [5, 7]. To assess contributions made by various risk factors into the examined diseases prevalence, we applied a decision tree technique in our research. But as this statis-tical analysis techniques is rather compli-cated when applied and is not so widely spread in biomedical research, we thought it necessary to assess possibility of other techniques application.
Our research goal was to perform a comparative analysis of regression analysis application and decision trees application to calculate additional population risk on the example of IHD.
Data and methods. This work is completed within the frameworks of multi-centered epidemiologic research "Cardio-vascular diseases etiology and their risk factors in the RF" (ESSE-RF) in Kemerovo region. We chose a random population sampling, both male and female, as our re-search object; people were 25-64 and they all lived in Kemerovo region. Our sam-pling was made of 1,628 people, 700 males (43.0%) and 928 females (57.0%).
partici-pants gave their written informed consent to take part in it.
We studied such IHD risk factors as lipid metabolism parameters, arterial hy-pertension, lifestyle factors, psychoemo-tional peculiarities, social parameters (low incomes, poor education, having no family, being unemployed).
According to WHO classification, we considered body mass index being more than 30 kg/m2 being a proof of obesity. Arterial hypertension was classified as per WHO/ISoH criteria (1999) when systolic blood pressure was not lower than 140 mm Hg, and diastolic one, not lower than 90 mm Hg, as well as when both these param-eters were equal to a standard but under hypertensive drugs.
Hypercholesterolemia was classified when crude cholesterol concentration was higher than 5.0 mmol/l; hypertriglycer-idemia, when triglycerides were higher than 1.7 mmol/l; high low density lipopro-teins level was registered at their values exceeding 3.0 mmol/l; low high density lipoproteins level, lower than 1.0 mmol/l; hyperglycemia on an empty stomach was registered when dextrose level was higher than 5.6 mmol/l.
We applied Hospital Anxiety and De-pression Scale (HADS) validated in the RF to assess depression; susceptibility to stress was assessed as per Perceived Stress Scale. We calculated 75-percentile on the basis of the obtained ordinal series, and values higher than 8 scores and more as per de-pression scale and 5 scores and more as per stress scale were considered to be a risk factor.
IDH occurrence was assessed as per a sum of three epidemiologic criteria: on the basis of coding of ECG changes as per Minnesota code, Rose questionnaire (pec-toris) and cardiac infarction in a case histo-ry.
Additional population IHD risk caused by risk factors was calculated as per uni-fied algorithms but with application of dif-ferent statistical analysis techniques.
At the first stage, we calculated a con-tribution made by the examined risk factors into IHD prevalence values for the whole sampling. To do this, we first applied logi-cal regression analysis, and then, decision trees. To remove possible modifying influ-ence exerted by sex and age in the course of logical regression analysis, we intro-duced them into it as well. B-coefficient values were used as a value describing a contribution made by a risk factor into IHD prevalence.
When we applied decision trees we chose on a discriminant one-dimensional branching technique for categorical and ordinal predictors. We took equal costs of wrong objects classification and a priori probabilities proportionate to sizes of de-pendent variable classes as fidelity criteria. Branching was stopped according to a pruning rule as per an error in classifica-tion, minimal number of incorrectly classi-fied objects being equal to 12, and a stand-ard error, equal to 1.0. We used values of predictors significant ranks as parameters of contributions made by risk factors into IHD prevalence.
Further on, calculation was made as per the same scheme. We calculated risk factors prevalence in sex-age groups and in the whole sampling. Load with IHD risk factors was calculated as a sum of multi-plying risk factors prevalence by their con-tribution into IHD risks as per the follow-ing formula:
Р = ∑(RC)n, (1)
Then we calculated a difference be-tween risk factors load in age-sex groups in comparison with the overall sampling as per formula:
∆Р = Ргр. – Рв., (2)
Where ∆Р is a difference between risk factors load in age-sex groups in compari-son with the overall sampling as per formu-la; Рgr is a risk factors load in age-sex groups; Рs. is a risk factor load in the over-all sampling.
On the next stage we applied linear re-gression analysis to determine frequency of IHD association with the risk factor loads values in age-sex groups. B-coefficient which was obtained in the course of linear regression analysis was used to recalculate difference in risk factor loads in age-sex groups into population risk values as per formula:
Р% = ∆РВ, (3)
Where Р% is IHD risk which is addi-tional to population one and caused by risk factors, %; В is В-coefficient showing a correlation between IHD frequency and risk factors load in linear regression analy-sis.
Critical level of statistic significance and p-level for a choice on a branching variable (for decision trees) was considered equal to 0.05.
Results and discussion. As per lo-gistic analysis results statistically signifi-cant (or very close to such, 0.1>р>0.05) associations with IHD allowing for age and sex are observed as per following risk fac-tors: hypertension, hypertriglyceridemia, hyperglycemia, obesity, pancreatic diabe-tes, smoking, stress, depression, absence of high education, and being unemployed (Table 1). We used only these risk factors in our further analysis.
Table 1 contains B-coefficients as per regression analysis (from 0.046 hypergly-cemia to 0.491 pancreatic diabetes) and ranks as per decision trees (from 20 for smoking to 100 for obesity) which describe the selected risk factors and which were further used in risk factors load calcula-tions (formula 1) as per two techniques. We should note that predictive significance of a mathematical model for IHD probabil-ity as per risk factors sum was equal to 83.8% when this model was designed via logistic regression analysis, and to 71.9% in case when decision trees were applied.
We didn't detect any statistically signif-icant correlation between B-coefficient val-ues and risk factors significance ranks as correlation coefficient was equal to -0.32 at
р = 0.37. Therefore, different statistic analy-sis techniques gave different values of con-tributions made by the examined risk fac-tors into IHD prevalence parameters.
Tables 2 and 3 contain information on IHD and risk factors prevalence in age-sex groups and in the overall sampling. Risk factors prevalence in the overall sampling varied from 3.9% (pancreatic diabetes) to 60.7% (absence of high education). IHD prevalence in the overall sampling reached 16.8%; 13.5% in males; 19.2%, in females.
Risk factors load (as per formula 1) and difference in loads in sex-age groups in comparison with the overall sampling (as per formula 2) calculated via two tech-niques is given in tables 2 and 3. Risk fac-tors load calculated with logistic regression analysis amounted to 71.8 for the overall sampling; 72.0, for males; 71.7, for females. This load naturally grew with age and in-creased from 49.6 to 93.8 for males, and from 45.6 to 97.0 for females.
T a b l e 1
Influence exerted by risk factors on IHD probability as per regression analysis data (allowing for age and sex) and rank values as pre decision trees data.
Risk factors OR 95% CI р-level В-coeff. Ranks
Hypertension 1,28 0,97–1,70 0,082 0,118 68
Hypercholesterolemia 0,89 0,67–1,18 0,41 – –
Hypertriglyceridemia 1,66 1,22–2,25 0,0013 0,355 80
High LDL levels 0,92 0,68–1,24 0,58 – –
Low HDL levels 0,72 0,21–2,49 0,61 – –
Hyperglycemia 1,37 0,99–1,90 0,060 0,046 85
Obesity 1,49 1,13–1,97 0,0048 0,260 100
Pancreatic diabetes 1,96 1,13–3,41 0,016 0,491 81
Smoking 1,59 1,16–2,16 0,0036 0,359 20
Low physical activity 0,97 0,70–1,34 0,83 – –
Stress 1,56 1,15–2,11 0,0042 0,311 74
Depression 1,88 1,39–2,55 0,000049 0,402 47
Income 0,98 0,65–1,47 0,91 – –
Education 1,57 1,17–2,11 0,0026 0,292 71
Employment 1,40 1,04–1,88 0,028 0,170 83
Family 1,02 0,76–1,37 0,89 – –
T a b l e 2
IHD and risk factors prevalence and risk factors load in male age groups and in the overall sampling
Risk factors
Age groups, number of observations
All men (700)
Over-all sam-pling Young
er than 30 (86)
31–35 (85)
36–40 (88)
41–45 (65)
46–50 (98)
51–55 (94)
56–60 (107)
61–65 (77)
Hypertension, % 20,9 37,6 44,3 56,9 51,0 69,1 61,7 71,4 51,7 43,3
Hypertriglycer-idemia, % 14,1 17,6 21,8 24,6 25,5 25,5 27,4 23,7 22,7 20,3 Hyperglycemia, % 8,2 7,1 11,5 7,7 17,3 28,7 22,6 43,4 18,5 17,2 Obesity, % 12,9 22,3 21,6 35,4 36,7 35,5 34,6 37,7 29,7 35,2 Pancreatic diabetes,
% 1,2 0,0 0,0 0,0 4,1 5,3 4,7 14,7 3,7 3,9
Smoking, % 47,7 47,1 46,6 47,7 50,0 48,9 43,0 33,8 45,7 30,5 Stress, % 10,5 15,3 12,5 9,2 13,3 11,7 14,0 16,9 13,0 22,6 Depression, % 8,1 11,8 10,2 9,2 13,3 13,8 16,8 27,3 13,9 19,0 Education, % 43,0 51,8 61,4 55,4 70,4 71,3 63,6 63,6 60,6 60,7 Employment, % 9,3 9,4 9,1 7,7 16,3 26,6 32,1 64,9 22,0 25,4
IHD, % 3,5 3,5 5,9 9,2 10,3 22,3 21,5 30,3 13,5 16,8
T a b l e 3
IHD and risk factors prevalence and risk factors load in
female
age groupsRisk factors
Age groups, number of observations
All women
(928) Younger
than 30 (97)
31–35 (97)
36–40 (86)
41–45 (91)
46–50 (112)
51–55 (159)
56–60 (170)
61–65 (116)
Hypertension, % 10,3 8,2 18,6 30,8 42,0 50,3 52,3 57,8 37,2
Hypertriglycer-idemia, % 5,2 9,3 9,3 17,6 26,4 23,4 20,4 28,1 18,5
Hyperglycemia, % 0,0 2,1 12,8 13,2 15,5 15,8 26,9 32,5 16,2 Obesity, % 9,3 14,4 27,9 41,8 46,4 44,9 50,6 61,2 39,4 Pancreatic diabetes,
% 0,0 0,0 1,2 2,2 2,7 5,1 6,5 10,6 4,0
Smoking, % 26,8 29,9 29,1 26,4 17,9 17,0 10,0 6,9 19,0 Stress, % 26,8 26,8 29,4 27,8 36,6 28,9 31,4 29,3 29,8 Depression, % 11,3 7,2 17,4 17,6 23,2 28,9 31,8 31,9 22,8 Education, % 48,5 33,0 59,3 51,6 71,4 63,5 69,4 76,7 60,9 Employment, % 20,6 12,4 24,4 11,0 14,3 18,9 44,7 63,7 27,9
IHD, % 4,1 14,6 13,2 15,4 18,0 25,2 26,5 25,2 19,2
Load 1 45,6 41,8 62,0 64,6 78,8 77,6 85,0 97,0 71,7
Difference 1 –26,2 –30,0 –9,8 –7,2 7 5,8 13,2 25,2 –0,1 Load 2 10250 9211,9 15794,9 16971,6 21557,3 21452,6 25717,1 30457,8 19947 Difference 2 –9209,6 –10247,7 –3664,7 –2488 2097,7 1993 6257,5 10998,2 487,4
to 19,947.0, for females. The load grew with age from 10,570.0 to 28,512.9 for males and from 10,250.0 to 30,457.8 for females.
Mathematical models created with lin-ear regression analysis showed that risk fac-tor load could account for IHD prevalence in age-sex groups by 62.6% (logistic regres-sion) and by 71.7% (classification trees). Regression B-coefficients calculated as per these models were used to recalculate dif-ferences in risk factors loads into population risk values as per formula 3.
B-coefficient was equal to 0.4345 when logistic regression analysis was ap-plied, and to 0.0012, when decision trees were applied.
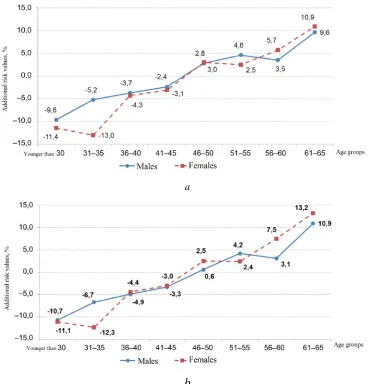
IHD risk, additional to population one, caused by risk factors, and calculated
а
b
Figure 1. IHD risk additional to population one, caused by risk factors, %: а – regression analysis; b – decision trees
Note: м – are males, ж – are females, 1 – younger than 30, 2 – 31-35, 3 – 36-40, 4 – 41-45, 5 – 46-50, 6 – 51-55, 7 – 56-60, 8 – 61-65.
Data which are obtained via these tech-niques allow calculating load with risk fac-tors. And here, as per both techniques (re-gression analysis and decision trees) differ-ence in load in age-sex groups in comparison with the overall sampling changes from negative values in age groups up to 45 years (inclusive), to positive values in people older than 45. IHD risk additional to population one and caused by risk factors changes similarly. Increase in additional IHD risk in age groups as per both tech-niques is practically linear, with slight devi-ations. Additional IHD risk in age groups younger than 30, both sexes, is lower than population one by 9.6–11.4 %; it becomes higher than population one in age groups
closer to 50 (by 0.6–2.8 %); and it reaches its maximum values by 65 (by 9.6–13.2 %).
Despite different statistical analysis techniques giving different values of contri-butions made by the examined risk factors into IHD prevalence parameters, the corre-lation between values of additional popula-tion risk calculated with regression analysis and with decision trees is strong and statis-tically significant. Difference of additional population risk calculated as per different statistical analysis techniques is slight and, as a rule, doesn't exceed 1.5%. Therefore, both techniques give similar results and can be equally applied to calculate population IHD risks.
References
1. Batyushin M.M. Modernizatsiya shkaly SCORE otsenki desyatiletnego riska serdechno-sosudistoi smertnosti [Modernization of 10-year cardiovascular death risk scale SCORE]. Rossi-iskii kardiologicheskii zhurnal, 2005, no. 6, pp. 40–44. (in Russian).
2. Zykov M.V., Zykova D.S., Kashtalap V.V., Pecherina T.B., Barbarash O.L. Znachimost' mul'tifokal'nogo ateroskleroza dlya modifikatsii shkaly otdalennogo riska smertnosti GRACE u bol'nykh ostrym koronarnym sindromom s pod"emom segmenta ST [The prognostic value of peripheral arteries diseases in patients with st-segment elevation myocardial infarction]. Ateroskleroz, 2012, vol. 8, no. 1, pp. 14–20 (in Russian).
3. Kontsevaya A.V., Suvorova E.I., Khudyakov M.B. Ekonomicheskaya effektivnost' re-nal'noy denervatsii u patsientov s rezistentnoy arterial'noy gipertoniey: rezul'taty markovskogo modelirovaniya [Economic eificiency of renal denervation in patients with resistant hyperten-sion: results of markov modeling]. Kardiologiya, 2014, vol. 54, no. 1, pp. 41–47 (in Russian).
4. Kontsevaya A.V., Shal'nova S.A. Populyatsionnye modeli prognozirovaniya serdechno-sosudistogo riska: tselesoobraznost' modelirovaniya i analiticheskiy obzor sushchestvuyush-chikh modeley[Population models of cardiovascular risk prediction: expedience of modeling and analytic review of current models]. Kardiovaskulyarnaya terapiya i profilaktika, 2015, vol. 14, no. 6, pp. 54–58 (in Russian).
5. Maksimov S.A., Indukaeva E.V., Artamonova G.V. Integral'naya otsenka riska ishem-icheskoy bolezni serdtsa v epidemiologicheskikh issledovaniyakh (ESSE-RF v Kemerovskoy oblasti). Soobshchenie I: vozrastno-polovye determinant [Integral assessment of coronary heart disease risk in the epidemiological studies (ESSE-RF in the Kemerovo Region). Communication 1: Age and sex determinants]. Profilakticheskaya meditsina, 2015, vol.18, no. 6, pp. 34–39 (in Russian).
work-related arterial hypertension risk factors]. Rossiyskiy kardiologicheskiy zhurnal, 2015, vol.120, no. 4, pp. 38–42 (in Russian).
7. Maksimov S.A., Tabakaev M.V., Artamonova G.V. Integral'naya otsenka riska ishem-icheskoy bolezni serdtsa v epidemiologicheskikh issledovaniyakh (ESSE-RF v Kemerovskoy oblasti). Soobshchenie II: sotsial'no-ekonomicheskie determinant [Integral assessment of coro-nary heart disease risk in the epidemiological studies (ESSE-RF in the Kemerovo Region). Communication 1I: Socioeconomic determinants]. Profilakticheskaya meditsina, 2016, vol.19, no. 1, pp. 24–29 (in Russian).
8. Mamedov M.N., Chepurina N.A. Summarnyi serdechno-sosudistyi risk: ot teorii k prak-tike: posobie dlya vrachei [Total cardio-vascular risk: from theory to practice: a manual for phy-sicians]. In: R.G. Oganov, ed. Moscow, 2007, 23 p. (in Russian).
9. Boytsov S.A, Vatolina M.A., Samorodskaya I.V., Barbarash O.L., Ovcharenko O.A., Kondrikova N.V. Mnenie vrachey o roli otdel'nykh faktorov smertnosti ot bolezney sistemy krovoobrashcheniya v regionakh Rossiyskoy Federatsii [Medical care practitioners' opinion on the role of specific factors contributing to the mortality from circulatory system disease in the regions of the Russian Federation]. Kompleksnye problemy serdechno-sosudistykh zabolevaniy, 2015, no. 4, pp. 53–60 (in Russian).
10. Oganov R.G., Shal'nova S.A., Kalinina A.M., Deev A.D., Glazachev O.S., Gusev E.I., Belyaeva I.A., Sudarev A.M. Novyy sposob otsenki individual'nogo serdechno-sosudistogo summarnogo riska dlya naseleniya Rossii [The novel method of assessment of individual total cardiovascular risk for the population of Russia]. Kardiologiya, 2008, vol. 48, no. 5, pp. 87–91 (in Russian).
11. Assmann G. Assessment of cardiovascular risk – PROCAM and new algorithms. Bio-med. Tech. (Berl), 2005, vol. 50, no. 7–8, pp. 227–232.
12. Vanuzzo D., Pilotto L., Mirolo R., Pirelli S. Cardiovascular risk and cardiometabolic risk: an epidemiological evaluation. G. Ital. Cardiol. (Rome), 2008, vol. 9, no.4, pp. 6S–17S.
13. Gorenoi V., Hagen A. Overview of risk – estimation tools for primary prevention of cardiovascular diseases in European populations. Cent. Eur. J. Public. Health., 2015, vol. 23, no.2, pp. 91–99.
14. Berger J.S., Jordan C.O., Lloyd-Jones D., Blumenthal R.S. Screening for cardiovascular risk in asymptomatic patients. J. Am. Coll. Cardiol., 2010, vol. 55, no.12, pp. 1169–1177.
15. Kahn R., Robertson R.M., Smith R., Eddy D. The impact of prevention on reducing the burden of cardiovascular disease. Circulation, 2008, vol. 118, pp. 576–585.
Maksimov S.A., Tsygankova D.P., Artamonova G.V. Application of regression analysis and classification trees in calculating additional population risk of ischemic eart disease. Health Risk Analysis, 2017, no. 3, pp. 31–39. DOI: 10.21668/health.risk/2017.3.04.eng