
Comparative study on the effect of hydrophilic and hydrophobic polymers on the dissolution rate of a poorly water soluble drug
10
0
0
Full text
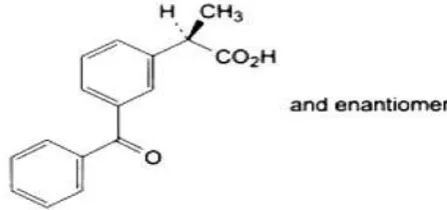
(2) Jiyauddin Khan et al / Int. J. of Pharmacy and Analytical Research Vol-3(3) 2014 [291-300]. Ketoprofen is a white or off-white, odourless, nonhygroscopic, fine to granular powder, melting at about 94°C. It is a Class II drug with low solubility and high permeability. It is freely soluble in ethanol, chloroform, acetone, ether and soluble in benzene and strong alkali, but practically insoluble in water (51 mg/L at 22 °C) (DrugBank, 2013). Ketoprofen is chosen as a model drug for controlled release dosage form formulation due to its short plasma elimination half-life and poor solubility in water (Tripathi, 2003), which affects its bioavailability. The basic goal of ketoprofen therapy is to achieve a steady state blood level that is therapeutically effective and non-toxic for an extended period of time (Remington, 2013).. INTRODUCTION Controlled drug delivery systems allow the desired concentration of drug to reach the site of action at the desired delivery rate, maintaining the plasma concentration of the drug within the therapeutic range. Rate and duration of delivery are designed to achieve desired concentration (W, 1998). Controlled release formulations facilitate better patient compliance by reducing the dosing frequency. In addition, the safety level of potent drugs is higher with controlled release formulations (A. Wahab et al., 2011). Additionally, these novel formulations contribute to the improvement of quality of life, better control of symptoms and reduction of medical costs (Talukder R, 2004).. Figure 1 Structure of Ketoprofen In this experiment, direct compression is to be used for ketoprofen tablet formulation along with the addition of suitable additives by using hydrophilic polymers of hydroxypropyl methylcellulose (HPMC) as well as hydrophobic polymers of povidone (Kollidon® SR). Direct compression offers a higher efficacy as compared with wet granulation (Shangraw, 1998). One of the methods of fabricating controlled release drug delivery system is by using hydrophilic matrices, also referred as hydrogels. Plastics (polymethacrylates, polyethylene), hydrophilic (methylcellulose, hypromellose), and lipophilic (carnauba wax, glyceryl tristearate) materials are commonly used for matrix preparation (DR, 1991). Several factors including the polymer type and concentration as well as the presence of additives and excipients in the final formulation can modify the drug release from the matrices. The viscosity grade of HPMC influences drug release profiles by modifying the diffusion and erosion behavior of the matrix system (RajabiSaihboomi AR, 2000).To minimize the gastro intestinal side effects due to high amount of drug in gastro intestinal tract, the objective of the present. study was aimed to formulate and evaluate controlled release matrix tablets of ketoprofen having comparable dissolution profiles to that of the marketed preparation Apo-keto SR® tablets.. MATERIALS AND METHODS Materials Ketoprofen was supplied by Hovid Pharmaceutical Company (Hovid Inc, Ipoh, Malaysia) as a gift sample. Hydroxy propyl methylcellulose (Methocel® HPMC) (K100M) was obtained from Dow Chemical Company (USA). Meanwhile, povidone (Kollidon® SR) was obtained from Pharmaniaga Manufacturing Berhad (PMB), Malaysia. Microcrystalline cellulose (Avicel PH102), Lactose DC, talc, magnesium stearate and disodium hydrogen phosphate was obtained from Pharmaniaga Manufacturing Berhad (PMB), Malaysia as a gift sample. Methanol was obtained from J.T. Baker, Netherlands. The reference tablet Apo-Keto SR® 200 mg (Apotex, Pharma forte, Malaysia) was purchased from a local pharmacy.. 292.
(3) Jiyauddin Khan et al / Int. J. of Pharmacy and Analytical Research Vol-3(3) 2014 [291-300]. used. Six formulations were fabricated by using a constant amount of active ingredient (200 mg ketoprofen) while varying the composition of the excipients. The polymers used were hydroxypropyl methylcellulose HPMC (K100M) and Povidone (Kollidon® SR) as shown in Table 1 and 2.. Preparation of ketoprofen matrix tablets The controlled release ketoprofen matrix tablets were prepared using direct compression method with a 10 mm concave punch and die set at constant hardness. Various concentrations 5%, 10%, 20% and 25% of different polymers were. Table 1: Composition of ketoprofen 200 mg matrix tablets containing different amount in (mg) of hydroxypropyl methylcellulose HPMC (K100M). Ingredients. Composition of different formulations. (mg/tablet). F1. F2. F3. Ketoprofen. 200.1. 200.1. 200.1. HPMC (K100M). 30.0 (10%). 60.0 (20%). 75.0 (25%). MCC. 33.9. 18.9. 9.9. Lactose DC. 30.0. 15.0. 9.0. Talc. 3.0. 3.0. 3.0. Magnesium stearate. 3.0. 3.0. 3.0. Tablet weight. 300. 300. 300. Table 2 Composition of ketoprofen 200 mg matrix tablets containing different amount in (mg) of Povidone Ingredients. Composition of different formulations. (mg/tablet). F4. F5. F6. Ketoprofen. 200.1. 200.1. 200.1. Povidone. 15.0 (5%). 30.0 (10%). 60.0 (20%). MCC. 39.9. 33.9. 18.9. Lactose DC. 39.0. 30.0. 15.0. Talc. 3.0. 3.0. 3.0. Magnesium stearate. 3.0. 3.0. 3.0. Tablet weight. 300. 300. 300. 293.
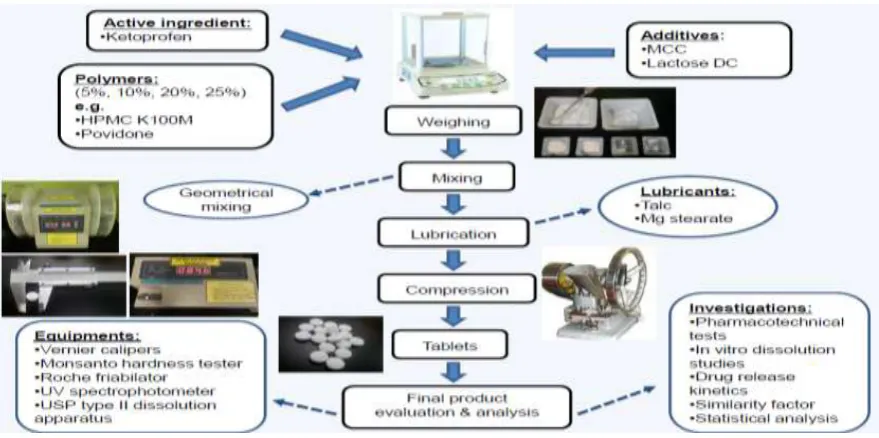
(4) Jiyauddin Khan et al / Int. J. of Pharmacy and Analytical Research Vol-3(3) 2014 [291-300]. Figure 2 Ketoprofen tablets formulation and evaluation tests. Preparation of phosphate buffer pH 6.8. Thickness and diameter. 0.05 M phosphate buffer was prepared by mixing 8.9 gram of disodium hydrogen phosphate in 1 litre of distilled water. The pH of the buffer was adjusted to 6.8 and measured using pH-meter.. The thickness and diameter of tablets were determined using a vernier caliper. Ten individual tablets from each formulation were obtained and the average values were calculated.. Standard curve of ketoprofen. Hardness. 50 mg of ketoprofen was weighted accurately and dissolved in 100 mL of methanol in a 200 ml beaker for the preparation of stock solution. The prepared stock solution of ketoprofen was subsequently diluted with phosphate buffer of pH 6.8 to get 1.563, 3.125, 12.5, 25 and 50 µg/mL of the final solution. The absorption maximum of ketoprofen was measured at 289 nm in the chosen solvent. This wavelength was used in the analysis of ketoprofen. Thus, the absorbance was measured using UV-visible spectrophotometer (Thermo Scientific Evolution 60S UV-Visible Spectrophotometer) at 289 nm using phosphate buffer of pH 6.8 as blank. Average of triplicate readings was recorded.. The tablet hardness value was determined using Monsanto hardness tester. Ten tablets from each formulation batch are tested randomly and the average reading noted.. EVALUATION OF MATRIX TABLETS. Friability A sample of six pre weighed tablets was placed in the Roche friabilator and operated for 100 revolutions. The friabilator revolved at a speed of 25 rotations per minute (rpm), dropping the tablets to a distance of 6 inches in each revolution. The tablets were then dedusted and reweighed.. In vitro Dissolution Release Studies The in vitro dissolution studies were carried out using USP dissolution test Apparatus-II (Lab India DS 8000 dissolution test apparatus), paddle method to study the drug release profile from various formulations of matrix tablets prepared. The round bottom dissolution vessel and rotating paddles were assembled at stirring speed of 100 rpm using 900 mL of dissolution medium (0.05 M phosphate buffer pH 6.8) for 12 hours and temperature at 37°C ± 0.5°C. Three tablets from each batch of formulation were tested. 5 mL of samples were. PREPARED. Weight uniformity 20 tablets from each formulation were weighed individually on an analytical balance. The average weight per tablet was calculated and individual tablet weight was then compared with the average value to determine the deviation in weight.. 294.
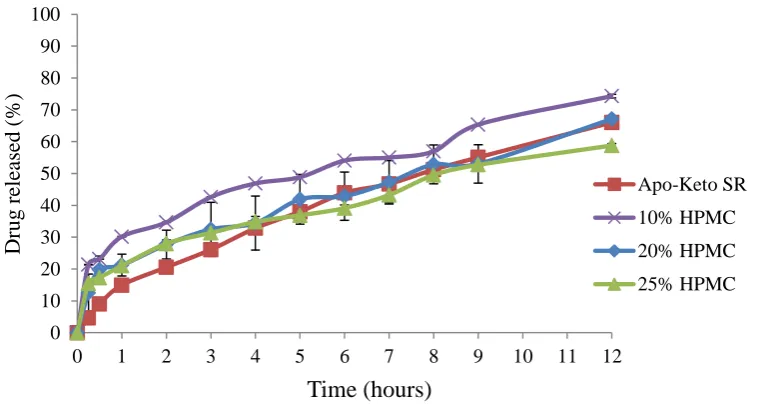
(5) Jiyauddin Khan et al / Int. J. of Pharmacy and Analytical Research Vol-3(3) 2014 [291-300]. withdrawn at predetermined time intervals and immediately replaced with equal volumes of dissolution medium. Time intervals determined were 0.25, 0.5, 1, 2, 3, 4, 5, 6, 7, 8, 9 and 12 hours. 0.5 mL of sample was diluted to 5 mL with the dissolution medium, thereby a dilution factor of 10 times was obtained. The concentrations of the filtered samples were determined at 289 nm using UV-visible spectrophotometer. An average of three absorbance readings was taken for each formulation.. t, for the reference and test dissolution profiles, respectively. FDA has set a public standard of f2 value between 50 to 100 to indicate similarity between two dissolution profiles. The f2 comparison metric with a value of 50 or greater is a conservative, but a reliable estimate to assure product sameness and product performance. (Vinod P. Shah, 1998).. Statistical analysis The drug release data obtained from different formulations were analyzed by one-way analysis of variance (ANOVA) procedure using the Statistical Package for the Social Science (SPSS) program (SPSS Statistics 22.0). The time required for 50% release of the drug content (T 50%) and mean dissolution time (MDT) were analyzed. When there was a statistically significant difference, a post-hoc Tukey test was then conducted to detect the differences among the pairs (SPSS Statistics 22.0). A statistically significant difference was considered at p < 0.05.. ANALYSIS OF DRUG RELEASE Determination of mean dissolution time (MDT) In order to characterize the drug release process, the mean dissolution time (MDT) was calculated according to the following equation. ∫. t. ∫0. t. MDT = 0. ---- (Equation 1). Drug Release Kinetics. RESULTS AND DISCUSSION. Various kinetic models and equations were applied on the data obtained from invitro dissolution studies of each matrix tablets formulation to determine the release kinetics (M.Chandira, 2009). Determination of the kinetic mechanism of drug release from the ketoprofen matrix tablets were done by fitting the dissolution data to zero order (cumulative percentage of drug released versus time), first order (log cumulative percentage of drug remaining versus time), Higuchi (cumulative percentage of drug released versus square root of time), Hixson-Crowell (cube root of cumulative percentage of drug remaining versus time), and Korsmeyer-Peppas (log cumulative percentage of drug released versus log time) equations.. Evaluation of physical properties of the matrix tablets Physical characteristics of the various matrix tablet formulations were presented acceptable readings. The weight variation of all the formulated matrix tablets fell within the prescribed limits of ± 5%, diameter 10.1 mm, thickness between 3.3 to 3.4 mm, hardness ranged between 70 to 100 N, and friability was less than 0.7%. Therefore, all the formulations were prepared showed good pharmacotechnical characteristics.. Evaluation of in vitro release of drug from matrix tablets Figure 3 showed the mean percentage of drug release profiles of ketoprofen from various tablet formulations. It was observed that the prepared matrix formulations of ketoprofen using HPMC (K100M) showed a decrease release profiles from that of the reference marketed tablets. By increasing the concentration of HPMC (K100M), there is a decrease in the rate of drug release. The order of drug release was F1 (10% HPMC) > F2 (20% HPMC) > F3 (25% HPMC). Researchers had concluded that the polymer concentrations were inversely proportional to the release rate in all formulations (Panna Thapa, 2005 et al.). Swelling. Determination of Similarity Factor (f2) Similarity factor (f2) stresses on the comparison of closeness of two comparative formulations. Dissolution profiles of the test and reference products were compared using a similarity factor (f2). It was computed using the formula: f2= 50 x log {[1+ (1/n) S t=1n (Rt-Tt) 2] -0.5 x 100} - (Equation 2). Where, n is the number of dissolution sample times, Rt and Tt are the individual or mean percent dissolved at each time point,. 295.
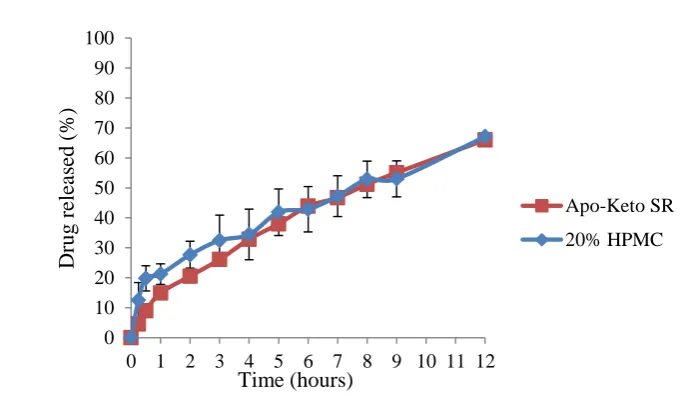
(6) Jiyauddin Khan et al / Int. J. of Pharmacy and Analytical Research Vol-3(3) 2014 [291-300]. of the matrix tablets occurred during the dissolution. This may be due to hydrating property of the polymer which eventually leads to the swelling of the tablet (Syed Umer Jan, 2012). Figure 4 showed that drug release from matrix formulations of ketoprofen using Povidone demonstrated an increase release profile as compared to the reference tablets. In 5% and 20% Povidone polymer, the release of drug was more than 50% in less than 2 hour, while 50% drug release in 10% Povidone was achieved in 2 to 3 hours. The drug release from the matrix tablet formulations was not dependent on the concentration of the polymer according to the observed results. Moreover, faster drug release. profile was observed for formulations F4, F5 and F6. In Figure 5, formulation F2 containing 20% HPMC (K100M) showed a comparable in vitro dissolution profiles to that of reference tablets, Apo-Keto® SR. Over a 12-hours period, it was noticed that the differences in the percentage of drug released between the two preparations were minimal throughout the entire dissolution period. Besides, the f2 value of 71.94% ensured high similarity between the two formulations.. 100 90. Drug released (%). 80 70 60 50. Apo-Keto SR. 40. 10% HPMC. 30. 20% HPMC. 20. 25% HPMC. 10 0 0. 1. 2. 3. 4. 5. 6. 7. 8. 9. 10. 11. 12. Time (hours) Figure 3 In vitro drug release profile of ketoprofen from tablets containing different concentrations of HPMC (K100M). N = 3.. 140 120. Drug released (%). 100 80. Apo-Keto SR. 60. 5% Povidone 10% Povidone. 40. 20% Povidone. 20 0 0. 1. 2. 3. 4. 5. 6. 7. 8. 9. 10. 11. 12. Time (hours) Figure 4 In vitro drug release profile of ketoprofen from tablets containing different concentrations of Povidone. N = 3. 296.
(7) Jiyauddin Khan et al / Int. J. of Pharmacy and Analytical Research Vol-3(3) 2014 [291-300]. 100 90. Drug released (%). 80 70 60 50. Apo-Keto SR. 40. 20% HPMC. 30 20 10 0 0 1 2 3 4 5 6 7 8 9 10 11 12. Time (hours). Figure 5 Comparison of In vitro drug release profile of ketoprofen from tablets containing 20% HPMC (K100 M) with reference product Apo-Keto® SR.Mean ± SD, N = 3. First-order kinetics model plot. y = 9.2461x + 25.726 R² = 0.8159. 120 100 80 60 40 20 0 0. 3. 6. 9. Log Cumulative % drug remaining. Cumulative % drug released. Zero-order kinetics model plot. 12. 5 4 y = -0.4218x + 4.5493 R² = 0.9615. 3 2 1 0 0. 3. (a). 2. 3. Cu.rt Cumulative % drug remaining. Cumulative % drug released. Hixson-Crowell model plot. y = 35.741x + 0.8788 R² = 0.9545. 1. 12. (b). Higuchi model plot. 0. 9. Time (hr). Time (hr). 120 100 80 60 40 20 0. 6. 4. 5 4 y = -0.5452x + 4.7471 R² = 0.9252. 3 2 1 0 0. 3. 6 Time (hr). Sq.rt Time (hr). (c). (d). 297. 9. 12.
(8) Jiyauddin Khan et al / Int. J. of Pharmacy and Analytical Research Vol-3(3) 2014 [291-300]. Log Cumulative % drug released. Korsmeyer-Peppas model plot y = 0.6373x + 3.3766 R² = 0.9454. 5 4 3 2 1 0 0. 1. 2. 3. Log Time (hr). (e). Figure 6 (a) - (e) Kinetic plots of ketoprofen release from F6, formulation containing 20% Povidone. Mean, N = 3. Drug Release Factor. Kinetics. and. From Table 4, when Povidone was used as a matrix forming material in the tablet for dissolution study, the drug release was faster compared to the reference tablets. The polymer was unable to sustain the drug release of ketoprofen. When the data were fitted into the first order kinetic equation, the r2 values were unable to be determined due to their faster release from the matrix tablet formulations. In addition, drug release was also interpreted by fitting the dissolution data into the Higuchi model and was shown to follow the principle of diffusion. The lower r2 value obtained from the Hixson-Crowell equation determined that erosion was not involved in the drug release mechanism. From Korsmeyer-Peppas equation, the n values ranging between 0.5140 to 0.6373, suggesting non-Fickian type of release (Anomalous transport) which refers to a combination of both diffusion and erosion drug release mechanisms. The similarity factor (f2) of formulation F4, F5 and F6 were less than 50%, showing that the dissolution profile was not similar to that of the reference product, R. An extremely statistically significant difference was observed among the T50% values for reference (R) with F4 (P = 0.0002), F5 (P = 0.0007) and F6 (P = 0.0005). Based on the results obtained on T50% and MDT, the release ability of the polymer cannot be compared with the marketed tablet dissolution profile.. Similarity. From Table 3, it was evident that when the dissolution data were fitted into the first order kinetic equation, r2 values closer to unity were obtained for formulations F1, F2 and F3. These results were suggestive of concentration dependent drug release from the matrix system, following the first order release. Referring to Table 3, a linear relationship was shown to be obtained with all the formulations, suggesting the release of drug from the formulated ketoprofen matrix tablets was based on the diffusion mechanism. It was observed that the r2 values were low when dissolution data were fitted into the Hixson-Crowell equation, implying that erosion may not have been involved in the drug release mechanism. Korsmeyer-Peppas equation further confirmed that the only diffusion mechanism was involved in the drug release with n values ranging between 0.3218 to 0.4288, suggesting a Fickian iffusion release n ≤ 0.45 . The similarity factor (f2) of formulations F2 and F3 were more than 50%, demonstrating similar dissolution profiles as compared to that of the reference product (R). A statistically significant difference was observed in F1 and F3 as compared to reference, only F2 was accepted as a reliable result because there was no significant difference between reference and F2 in term of T50% and MDT values.. 298.
(9) Jiyauddin Khan et al / Int. J. of Pharmacy and Analytical Research Vol-3(3) 2014 [291-300]. Table 3 Kinetics data of ketoprofen release from different concentrations of HPMC (K100M) formulations. Mean, N = 3. Formulation. Zero-order. Reference (R) F1 10% (K100M) F2 20% (K100M) F3 25% (K100M). r2 0.9663 0.8732 0.9447 0.9051. First-order. K0 4.8586 4.4944 4.2898 3.7455. r2 0.9924 0.9489 0.9702 0.9538. Higuchi r2 0.9900 0.9738 0.9764 0.9808. K1 0.0724 0.0770 0.0675 0.0551. KH 17.576 16.963 15.949 13.935. HixsonCrowell r2 KC 0.9887 0.0975 0.9302 0.0989 0.9666 0.0900 0.9406 0.0747. KorsmeyerPeppas 2 r n 0.9939 0.6581 0.9786 0.3218 0.9676 0.4288 0.9749 0.3506. Where, r2 is the regression coefficient, K0 is the zero-order release rate constant, K1 is the first-order release rate constant, KH is the Higuchi rate constant, KC is the cube root law release constant, and n is the release or, slope exponent.. Table 4 Kinetics data of ketoprofen release from different concentrations of Povidone formulations. Mean, N = 3. Formulation. Zero-order. Reference (R) F4 5% (Povidone) F5 10% (Povidone) F6 20% (Povidone). r2 0.9663 0.8499 0.8499 0.8159. First-order. K0 4.8586 9.1226 9.1226 9.2461. r2 0.9924 — — —. Higuchi r2 0.9900 0.9766 0.9674 0.9545. K1 0.0724 — — —. Where, r2 is the regression coefficient, K0 is the zero-order release rate constant, K1 is the first-order release rate constant, KH is the Higuchi rate constant, KC is the cube root law release constant, and n is the release or, slope exponent.. KH 17.576 40.214 34.784 35.741. HixsonCrowell r2 KC 0.9887 0.0975 — — 0.9474 0.4451 — —. KorsmeyerPeppas r2 n 0.9939 0.6581 0.9786 0.5303 0.9622 0.5140 0.9454 0.6373. prepared using HPMC (K100M) compared to Kollidon® SR the same polymer content was used in the matrix. At different HPMC (K100M) levels studied, 20% was proved to give the highest value f2 value, 71.94%.The release kinetics from various matrices was also studied and suggested that matrix tablets formulated using HPMC (K100M) followed diffusion mechanism of drug release whereas those formulated using Povidone showed the involvement of both diffusion and erosion mechanisms.. Comparison between the different polymers studied Drug release was controlled in polymer content of HPMC whereas a faster drug release profile was observed with all the formulations containing the Povidone polymer. Furthermore, it was found the drug release was most sustained with matrix tablets. Table 5 Similarity factors (f2) value of ketoprofen formulations containing various amounts of HPMC (K100M) and Povidone. Formulation. F1. F2. F3. F4. F5. F6. Similarity factor (f2) value. 41.58%. 71.94%. 62.78%. 12.49%. 19.43%. 16.17%. 299.
(10) Jiyauddin Khan et al / Int. J. of Pharmacy and Analytical Research Vol-3(3) 2014 [291-300]. CONCLUSION In conclusion, out of all the formulations studied, matrix tablets containing 20% HPMC (K100M) showed comparable dissolution profile to that of the reference product. The hydrophilic polymer, HPMC (K100M) could be successfully employed in the formulation of hydrophilic matrix tablets with Higuchi model used for prediction of drug release.. ACKNOWLEDGEMENTS The authors gratefully acknowledge to the Research Management Center of Management & Science University for providing the necessary facilities to carry out the research project successfully.. REFERENCES [1] A. Wahab, G. M. K., M. Akhlag, N. R. Khan, A. Hussain, M. Rafiq, H. Khan, M. F. Khan, & N. UrRehman, A. K. 2011. Formulation and evaluation of controlled release matrices of ketoprofen and influence of different co-excipients on the release mechanism. University of Karachi. [2] BP 2004. British Pharmacopeia. London, UK: The Stationery Office. [3] DR, F. 1991. Colon-specific drug delivery. Adv Drug Deliv Rev., 7(1), 99-149. [4] Drugbank 2013. Ketoprofen. September 16, 2013 ed.: DrugBank Version 4.0. [5] Rajabi-Saihboomi AR, J. M. 2000. Slow Release HPMC Matrix Systems. Eur. Pharm. Rev, 5, 21-23. [6] Remington 2013. The Science and Practice of Pharmacy. 22 nd ed.: Mack Publishing Company, Easton, Pa, USA. [7] Shangraw, R. 1998. Pharmaceutical Dosage Form Tablets. In: Liberman HA, Lacbman L, Schwartz JB. New York: Marcel Dekker, Inc. [8] Syed Umer Jan, G. M. K., Haroon Khan, Asim-Ur-Rehman, Kamran Ahmad Khan, Sehfaat Ullah Shah, Kifayat Ullah Shah, Amir Badshah, Izhar Hussain 2012. Release Pattern of Three New Polymers in Ketoprofen Controlled-Release Tablets. African Journal of Pharmacy and Pharmacology, 6 601-607. [9] Talukder R, F. R. 2004. Gastroretentive delivery systems: a mini review. Drug Dev Ind Pharm. , 30(10), 28. [10] Tripathi, K. 2003. Essential Medical Pharmacology. 5th ed. New Delhli Jaypee Publications (P) Ltd. [11] Vinod P. Shah, Y. T., Pradeep Satheand Roger L. Williams 1998. Dissolution Profile Comparison Using Similarity Factor, f2. [12] W,G. 1998. Controlled Release Drug Delivery Systems [Online]. Available: http://courses. ahc.umn.edu /medicalSchool/BMEn/5001/notes/ddsystems.html[Accessed 4 September 2013]. *******************************. 300.
(11)
Figure
+3


Related documents
The most important contributions of this paper are (i) the proposal of a concern mining approach for KDM, what may encourage other groups to start researching on
Based on these considerations, in Oct 2013 we adopted a biweekly low dose docetaxel regimen (40 mg/m 2 every 2 weeks) as an institutional standard chemotherapy regi- men for
Results of this procedure were compared with the solutions obtained by the governing parameter method (Kojic and Bathe 2005), as well as with the results obtained by the
This documentation of a history of tattoo making is however incomplete and it does not account for the prevalence and significance of tattoo making in all
Shukla and Ojha (2010) have a discussion on the use of data model based markov chain model for deadlock index analysis of multi-level queue scheduling in
Healthcare resources identified from medical records were recorded, grouped, and itemized according to in- patient admissions (including day case procedures, de- fined as
Thus, in the context of circulatory cessation (including DBCDD), death is often determined during a state of permanent ces- sation but before a state of irreversible cessation
[19] using finite element analysis (FEA) concluded that the elastics have to be applied with a variable downward direction of about 30° to the occlusal plane in order to control
