ISSN : 2581-7175 ©IJSRED: All Rights are Reserved Page 872
An Intelligent Evaluation of Enterprise System
UmohMfreke E.
1, Enoch. O. Nwachukwu
21
Department of Computer Science, AkwaIbom State Polytechnic, IkotOsurua, Nigeria
2
Department of Computer Science, University of Port Harcourt, Port Harcourt, Nigeria
email:[email protected], [email protected].
Abstract:
Nowadays, individuals, organizations depend largely on software systems for smooth running of their businesses, unfortunately, most of the organizations fail to realize their set goal, due to software failure and malfunctioning. The existing system for software evaluation is limited by lack of capabilities to handle imprecise knowledge, lack of capability to learn from previous data and make a valid decision. This research is motivated by the need to overcome these limitations by the integration of Adaptive Neuro-Fuzzy Inference System (ANFIS) to optimize the software performance evaluation by classifying, training and quantifying software quality attributes. We employed back propagation and hybrid learning approach in training our network. The training, testing and checking Root mean Square Error(RMSE) values of 0.026347, 0.026073, and 0.025819 respectively were observed in the hybrid learning process at 100 epochs. ANFIS processes are faster and have a minimal error of 0.026344 at 100 epochs. Average error of 0.047283 was observed in back propagation as against the average error of 0.024642 with hybrid learning at 300 epochs. Therefore, ANFIS evaluation with hybrid learning performed better than back propagation.
Keyword: Software evaluation, Software Quality metrics, Fuzzy logic, Neural Network. ANFIS
Introduction
Software evaluation implies assessing
different parts offramework in other to determine its effectiveness and also to select
the best alternative. A software
evaluation is a type of assessment that seeks to determine if software or a combination of software is the most ideal fit for the necessities of a given customer. What matter is to look closely at the resources and tools provided by the software that is either currently in use or is being examined as a possible addition to programs already in use by that customer?
In software evaluation, there are many factors for consideration.one is
software-hardware compatibility, another is the interaction between the proposed software and the one already in the system or the right combination of software.
Software evaluation is important to ensure that all software utilized by an individual or business is really expanding the productivity of the operation as opposed to making extra work loads. While people and organizations can lead this sort of assessment all alone, there are additionally specialists who can take part in item and programming appraisal for a customer, rolling out proposals for any improvements or options that would be to the greatest advantage of the customer. This approach can regularly reveal issues that would be neglecting something else, at last
International Journal of Scientific Research and Engineering Development
ISSN : 2581-7175
sparing the organization a lot of cash regarding work and different sorts operational expenses.
Fuzzy Inference System (FIS)
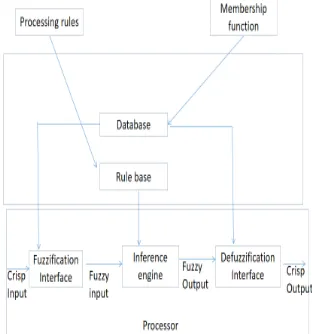
The fuzzy Logic model for software evaluation can be envisioned as involving a knowledge base and a processing stage. The knowledge base provides membership functions and the fuzzy rules needed for the process. Numerical crisp variables are the input of the system in the processing stage. These variables are passed through a
fuzzification stage where they are
transformed to linguistic variables, which become the fuzzy input of the inference engine. This fuzzy input is transformed by rules of the inference engine to fuzzy output. These linguistic results are then changed by a defuzzification stage into numerical values that becomes the output of the system.
The block diagram of the fuzzy logic
is as shown in figure1. It has fuzzification, inference, rulebase and defuzzification as components. The design of the components is as shown in the following section
Figure 1: Fuzzy Inference System
International Journal of Scientific Research and Engineering Development-– Volume 2 Issue 3 Available at
©IJSRED: All Rights are Reserved sparing the organization a lot of cash
regarding work and different sorts of
The fuzzy Logic model for software evaluation can be envisioned as involving a knowledge base and a processing stage. The knowledge base provides membership functions and the fuzzy rules needed for the process. Numerical crisp variables are the input of the system in the processing stage. These variables are passed through a
fuzzification stage where they are
transformed to linguistic variables, which become the fuzzy input of the inference fuzzy input is transformed by rules of the inference engine to fuzzy output. These linguistic results are then changed by a defuzzification stage into numerical values that becomes the output of the system. The block diagram of the fuzzy logic model
. It has fuzzification, inference, rulebase and defuzzification as components. The design of the components is as shown in the following section
Figure 1: Fuzzy Inference System
Rules Generation
The rules automatically generated from data collection using subtractive clustering (genfis2) and fuzzy inference TagakiSugeno Kang order-1 method. 13
found that modelled the data behavior as follows:
1. If (Functionality is Very High) and (Reliability is Very High) and
Very High) and (Efficiency is Very High) and (Maintainability is Very High) and (Portability is Very High) then (Q
out1cluster1) (1)
2. If (Functionality is High) and (Reliability is High) and (Usability is High) and (Efficiency is High) and (Maintainability is High) and (Portability is High) then
is out1cluster2) (1)
3. If (Functionality is Moderately High) and (Reliability is Moderately High) and
(Usability is Moderately High) and
(Efficiency is Moderately High) and (Maintainability is Moderately High) and (Portability is Moderately High) then (Quality is out1cluster3) (1)
4. If (Functionality is Low) and (Reliability is Low) and (Usability is Low) and (Efficiency is Low) and (Maintainability is Low) and (Portability is Low
is out1cluster4) (1)
5. If (Functionality is Very Low) and (Reliability is Very Low) and (Usability is Very Low) and (Efficiency is Very Low) and (Maintainability is Very Low) and (Portability is Very Low) then (Qu
out1cluster5) (1)
6. If (Functionality is in1cluster6) and (Reliability is in2cluster6) and (Usability is in3cluster6) and (Efficiency is in4cluster6)
Volume 2 Issue 3, May-June 2019 Available at www.ijsred.com
Page 873 The rules automatically generated from the data collection using subtractive clustering (genfis2) and fuzzy inference TagakiSugeno set of rules was found that modelled the data behavior as
1. If (Functionality is Very High) and (Reliability is Very High) and (Usability is Very High) and (Efficiency is Very High) and (Maintainability is Very High) and (Portability is Very High) then (Quality is
2. If (Functionality is High) and (Reliability is High) and (Usability is High) and igh) and (Maintainability is High) and (Portability is High) then (Quality
3. If (Functionality is Moderately High) and (Reliability is Moderately High) and
(Usability is Moderately High) and
(Efficiency is Moderately High) and inability is Moderately High) and (Portability is Moderately High) then (Quality is out1cluster3) (1)
4. If (Functionality is Low) and (Reliability is Low) and (Usability is Low) and (Efficiency is Low) and (Maintainability is Low) and (Portability is Low) then (Quality
5. If (Functionality is Very Low) and (Reliability is Very Low) and (Usability is Very Low) and (Efficiency is Very Low) and (Maintainability is Very Low) and (Portability is Very Low) then (Quality is
ISSN : 2581-7175
and (Maintainability is in5cluster6) and (Portability is in6cluster6) then
out1cluster6) (1)
Artificial Neural Networks
An artificial neural network (ANN) learning algorithm, usually called "neural network" (NN), is a learning algorithm that is inspired by the structure and functional aspects of biological neural networks. Computations are structured in terms of an interconnected group of artificial neurons, processing information using a connectionist
to computation. Modern neural networks are
non-linearstatisticaldata modeling
They are usually used to model complex relationships between inputs and outputs, to find patterns in data, or to capture the statistical structure in an unknown probability distribution between observed variables.
An artificial neural network is an
interconnected group of nodes, akin to the vast network of neurons in a brain
each circular node represents an art neuron and an arrow represents a connection from the output of one neuron to the input of another. In machine learning and
science, artificial neural networks are a family of models inspired by
neural networks (the central nervous systems of animals, in particular the
and are used to estimate or
approximatefunctions that can depend on a large number of inputs and are generally unknown. Figure 2 depicts a diagram of Artificial neural Network.
©IJSRED: All Rights are Reserved and (Maintainability is in5cluster6) and
(Portability is in6cluster6) then (Quality is
(ANN) learning algorithm, usually called "neural network" (NN), is a learning algorithm that is inspired cture and functional aspects of . Computations are structured in terms of an interconnected , processing connectionist approach . Modern neural networks are
data modeling tools.
They are usually used to model complex relationships between inputs and outputs, to in data, or to capture the statistical structure in an unknown joint between observed
work is an
interconnected group of nodes, akin to the brain. Here, each circular node represents an artificial neuron and an arrow represents a connection from the output of one neuron to the input of and cognitive artificial neural networks (ANNs) are a family of models inspired by biological central nervous of animals, in particular the brain)
and are used to estimate or
that can depend on a and are generally depicts a diagram of
Figure2. Diagram of Artificial Neural network
Neuro – Fuzzy Systems
A neuro-fuzzy framework is a fuzzy framework that uses a taking in calculation got from or roused by neural system hypothesis to decide its parameters
sets and fuzzy principles by handling information tests. Present day neuro
frameworks are typically spoken to as uncommon multilayer bolster forward neural systems. However,fuzzification of other
neural system design are likewise
considered, for instance self
elements.In those neuro fuzzy networks,
connection weights, propagation and
activation functions differ from common neural networks. Although there are a lot of different approaches, the term neuro
system displays the following properties.
i. A neuro-fuzzy framework depends
on a fuzzy framework which is prep
taking in calculation got from neural system
hypothesis. The (heuristical) learning
technique works on nearby data, and causes
just neighborhood alterations in
fundamental fuzzy framework.
Page 874
Diagram of Artificial Neural
fuzzy framework is a fuzzy framework that uses a taking in calculation got from or roused by neural system hypothesis to decide its parameters – fuzzy sets and fuzzy principles by handling information tests. Present day neuro – fuzzy rameworks are typically spoken to as er forward neural fuzzification of other
neural system design are likewise
considered, for instance self-sorting out In those neuro fuzzy networks,
propagation and
activation functions differ from common neural networks. Although there are a lot of different approaches, the term neuro- fuzzy system displays the following properties.
fuzzy framework depends on a fuzzy framework which is prepared by taking in calculation got from neural system
hypothesis. The (heuristical) learning
technique works on nearby data, and causes
just neighborhood alterations in the
International Journal of Scientific Research and Engineering Development
ISSN : 2581-7175
ii. A neuro – fuzzy system can be view
as a 3- layer feed forward neural network. The first layer represents input variables, the middle (hidden) layer represents fuzzy rules and the third layer represents output variables. Fuzzy sets are encoded as (fuzzy) connection weights. It is not necessary to represent a fuzzy system like this to apply a learning algorithm to it. However, it can be convenient, because it represents the data flow of input processing and learning within the model. Sometimes five
architecture is used, where the fuzzy sets are represented in the units of the second and fourth layer. A neuro -fuzzy system can be dependable, before, during and after learning interpreted as a system of fuzzy rules. It is also possible to create the system out of training data from scratch, as it is possible to initialize it prior knowledge in form of fuzzy rules but not all neuro
models specify learning procedures for fuzzy rule creation. The learning procedure of a euro- fuzzy system takes the semantical properties of the underlying fuzzy system into account. The results in constraints on the modifications applicable to the system parameters.
International Journal of Scientific Research and Engineering Development-– Volume 2 Issue 3 Available at
©IJSRED: All Rights are Reserved fuzzy system can be view
feed forward neural network. The first layer represents input variables, the middle (hidden) layer represents fuzzy rules and the third layer represents output variables. Fuzzy sets are encoded as (fuzzy) connection weights. It is not necessary to t a fuzzy system like this to apply a learning algorithm to it. However, it can be convenient, because it represents the data flow of input processing and learning within the model. Sometimes five- layer architecture is used, where the fuzzy sets sented in the units of the second fuzzy system can be dependable, before, during and after learning interpreted as a system of fuzzy rules. It is also possible to create the system out of training data from scratch, as it is ible to initialize it prior knowledge in form of fuzzy rules but not all neuro- fuzzy models specify learning procedures for fuzzy rule creation. The learning procedure fuzzy system takes the semantical properties of the underlying into account. The results in constraints on the modifications applicable
Figure: 3: Architecture of ANFIS
(Adopted from Takagi and Sugeno, 2015)
Layer 1: The nodes in this layer represent the Fuzzy input linguistic variables wh convert input values to the next level.
Layer 2: The nodes in this layer represent the Input membership functions which perform fuzzification of the input linguistic variables. Gaussmf membership functions are proposed in this work to describe the variables. The membership functions are normal distribution with a range between 0 and 1
Layer 3: The nodes in this layer represent the fuzzy rules and there are 13 rules, and the nodes in this layer perform the max operation to determine the firing stren the associated rule and also to determine the overall system output.
Volume 2 Issue 3, May-June 2019 Available at www.ijsred.com
Page 875
Architecture of ANFIS
(Adopted from Takagi and Sugeno, 2015)
e nodes in this layer represent guistic variables which input values to the next level.
e nodes in this layer represent the Input membership functions which perform fuzzification of the input linguistic variables. Gaussmf membership functions are proposed in this work to describe the . The membership functions are normal distribution with a range between 0
ISSN : 2581-7175
Layer 4: The nodes in this layer represent the Output membership function that handles the weight assigned directly by an expert or from the historical data.
Layer 5: The nodes in this layer represent the Output Variables which performs the defuzzification by evaluating the entire system output.
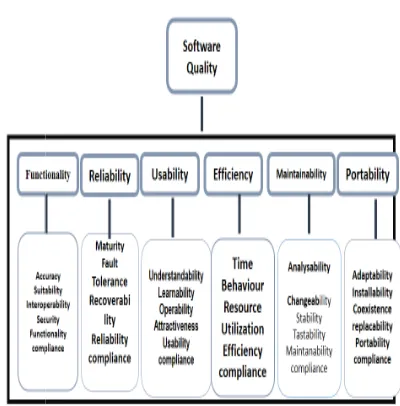
Figure 4: SOFTWARE QUALITY MODEL
Table 1: Summary of related works
Topic Author
An Intelligent Framework for Website Usability-
AlexieiDingli and Sarah Cassar (2014)
Empirical Evaluation of Software Testing Techniques – Need, Issues and Mitigation
Sheikh Umar
Farooq, SMK
Quadri (2013)
©IJSRED: All Rights are Reserved
Layer 4: The nodes in this layer represent the Output membership function that handles the weight assigned directly by an expert or from the historical data.
in this layer represent the Output Variables which performs the defuzzification by evaluating the entire system output.
SOFTWARE QUALITY MODEL.Source :( ISO 9126)
Table 1: Summary of related works
Method Construct/Include
d/ parameters
Models
AlexieiDingli Empirical
Expert analysis- Heuristic- CWW
Usability: learnability, efficiency. Satisfaction,
memorability, error,
USEFUL IUE (tool)
Sheikh Umar
Farooq, SMK
Quadri (2013)
Intra and Inter family
techniques
Empirical, qualitative, quantitative, predictive
Effectiveness, Efficiency
Page 876 Layer 4: The nodes in this layer represent the Output membership function that handles the
in this layer represent the Output Variables which performs the
9126)
Models
International Journal of Scientific Research and Engineering Development-– Volume 2 Issue 3, May-June 2019 Available at www.ijsred.com
ISSN : 2581-7175 ©IJSRED: All Rights are Reserved Page 877
An Empirical Foundation forAutomated Web Interface Evaluation Melody Yvette Ivory (2001) Empirical 157 quantitative page-level and site level measures. Usability, performance Statistical Software Evaluation: Criteria-based Assessment Mike Jackson, Steve Crouch and Rob Baxter (2011)
Criteria- based Usability,
sustainability, Maintainability ISO/IEC 9121-1 Knowledge Based Evaluation of Software System. IoannisStameles (2013) MCDA, AHP, MAUT Usability, maintainability, portability ESSE WAS, Aggregate Usability
evaluation of
software system
Sanjay Kumar
Dubey1,
Anubha Gulati2
and Prof.(Dr.)
Ajay Rana3,(
2012) Fuzzy Multi Criteria multi-criteria decision making (MCDM) Effectiveness, Efficiency, satisfaction, comprehensibility, safety, Usability Model
Evaluating
web-based learning
systems
Teresa M. pergola and L. Mlissa Walters. (2013) System’s interface, functions, content, features, and support SDLC- survey, analysis, selection process Evaluating Websites
Using a Practical Quality Model. A model for website quality evaluation - a practical approach Zihou Zhou (2009) Kavindra Kumar Singh1 & Praveen Kumar (2014) A website evaluation calculation method
Aesthetics, Ease of Use, Multimedia, Rich Content and Reputation
WEF
The Evaluation of WebCost Using Software Usability Measurement Inventory (SUMI) ZulkefliMansor 1, ZarinahMohd Kasirun2, Saadiah Yahya3, Noor Habibah Arshad 4(2012) SUMI Questionnaire Usability. Usability testing of WebCost was done by meeting the respondent physically
ISSN : 2581-7175 Reliability
Evaluation model for composite web services
N.Sasikaladevi Dr.L.Arockiam (2010)
Adaptive Neuro-Fuzzy Inference System (ANFIS) Based
Software Evaluatio
Khyati M.
Mewada Amit
Sinhal an
BhupendraVerm a (2013)
Proposed system
The procedure for initial FIS generation and ANFIS optimizat begins with setting the adjacent radius in subtractive clustering.
Figure 5: Procedure For Initia
©IJSRED: All Rights are Reserved N.Sasikaladevi
Dr.L.Arockiam
vector calculation
Availability, accessibility.
SOA(service oriented architecture) reliability evaluation model.
Khyati M.
Mewada Amit
Sinhal and
BhupendraVerm
Cost attribute
The procedure for initial FIS generation and ANFIS optimization is depicted in figure 5 begins with setting the adjacent radius in subtractive clustering.
Procedure For Initial Fis Generation And Anfis Optimization Of Iwses
Page 878 SOA(service oriented architecture) reliability evaluation model.
ion is depicted in figure 5. It
International Journal of Scientific Research and Engineering Development
ISSN : 2581-7175
Figure 6: ANFIS Inference Editor
Figure 6 shows the Sugeno fuzzy editor with six input parameters, one output and thirteen rules.
Figure 7: Membership function editor (Input: Usability)
Figure 7 shows gauss membership function editor with usability as an input with the linguistics variables very low, low moderate, high and very high.
International Journal of Scientific Research and Engineering Development-– Volume 2 Issue 3 Available at
©IJSRED: All Rights are Reserved
ANFIS Inference Editor
Sugeno fuzzy inference editor with six input parameters, one linear
Figure 7: Membership function editor
Figure 7 shows gauss membership function editor with usability as an input with the linguistics variables very low, low moderate,
Figure 8: ANFIS output Training Window with back propagation
Figure 8 shows the number of input six an output one with 13 rules. The training data are the blue (0) while the FIS output are red (*) sign. It has average testing error value of 0.027306
Figure 9:ANFIS Training Error Window
Figure 9 shows the training error window with six inputs, one output and thirteen rules at epoch 300 and zero error tolerance.
Volume 2 Issue 3, May-June 2019 Available at www.ijsred.com
Page 879
ANFIS output Training Window with back propagation
shows the number of input six and output one with 13 rules. The training data are the blue (0) while the FIS output are red (*) sign. It has average testing error value of
ANFIS Training Error Window
ISSN : 2581-7175
1. ANFIS Results
The result of the training of
generated shows that Usability and
Portability are software attributes with less hierarchy. The trained FIS shows how inspections with low weights for the above attributes had little or no much effect on software design. Software performance according to the data shows that reliability, functionality and maintainability influence much more the overall software quality.
Table 2: ANFIS Performance with hybrid algorithm
Table 2 shows the ANFIS performance with hybrid algorithm at different training models and their average errors.
©IJSRED: All Rights are Reserved The result of the training of the FIS
shows that Usability and
Portability are software attributes with less hierarchy. The trained FIS shows how ts for the above had little or no much effect on software design. Software performance according to the data shows that reliability, y and maintainability influence e the overall software quality.
ith hybrid
Table 2 shows the ANFIS performance with hybrid algorithm at different training models
Table 3: ANFIS Performance with back propagation algorithm
Table 3 shows ANFIS performance with back propagation algorithm at different training models and their average errors.
Table 4: Comparison Of result
Table 4 shows the comparison of the two training models with their average training error
Page 880 : ANFIS Performance with back
Table 3 shows ANFIS performance with on algorithm at different training models and their average errors.
Table 4: Comparison Of result
International Journal of Scientific Research and Engineering Development
ISSN : 2581-7175
Table 5: ANFIS Training Information
Table 4 shows ANFIS training
information with sub- clustering method.
International Journal of Scientific Research and Engineering Development-– Volume 2 Issue 3 Available at
©IJSRED: All Rights are Reserved
: ANFIS Training Information
ining
clustering method.
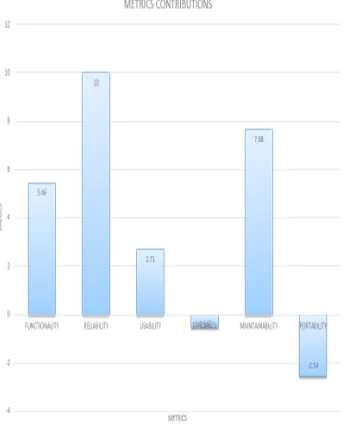
Figure 10: Graph of metrics evaluation
The graph of metrics evaluation shows that reliability is more importance, followed by maintainability, and functionality, while portability is less importance followe efficiency considering the information system.
Conclusion
In this research, we discus
quality evaluation. An implementation with ANFIS was done in order to optimize the performance evaluation of the system. The result showed that hybrid learning algorithm processed faster than the back propagation algorithm in the evaluation of software quality attributes. The average error of 0.047283 was observed at epoch 300 in the back propagation learning algorithm while an average error of 0.024642
at training epoch of 300 in hybrid learning algorithm. The training, checking, and
testing errors at 100 epochs were
0.026347.0.026073, 0.025819 respectively.
The subtractive clustering algorithm,
reduced the dimension of the fuzzy rules from 15625 To 13 rules, thereby reducing computational complexity.
Recommendations
• More research should be carried out
on software evaluation systems to include the quality, the cost, effort, and standard in order to determine the best software product.
• Users of software systems should
place importance to software quality attributes based on how relevant the attributes are for the success of the organization.
• Software developers should employ
test driven approach during software development in order to mini error.
Volume 2 Issue 3, May-June 2019 Available at www.ijsred.com
Page 881
Graph of metrics evaluation
The graph of metrics evaluation shows that reliability is more importance, followed by maintainability, and functionality, while portability is less importance followed by efficiency considering the information
In this research, we discussed on software . An implementation with ANFIS was done in order to optimize the performance evaluation of the system. The learning algorithm processed faster than the back propagation algorithm in the evaluation of software quality attributes. The average error of 0.047283 was observed at epoch 300 in the back propagation learning algorithm while an average error of 0.024642 was observed at training epoch of 300 in hybrid learning algorithm. The training, checking, and
testing errors at 100 epochs were
0.026347.0.026073, 0.025819 respectively.
The subtractive clustering algorithm,
reduced the dimension of the fuzzy rules 15625 To 13 rules, thereby reducing
More research should be carried out on software evaluation systems to include the quality, the cost, effort, and standard in order to determine the best software product.
s of software systems should place importance to software quality attributes based on how relevant the attributes are for the success of the
ISSN : 2581-7175 ©IJSRED: All Rights are Reserved Page 882
• Raw data set collected from any
source for machine learning must undergo data cleaning to eliminate noise or bias associated during data collection in order to have an accurate result.
• All the six top level attributes of
software quality must be assessed for final decision making on software quality product.
References
Alexiei, D. andSarah, C. (2014). An Intelligent Framework for Website
Usability-Advancesin Human
Computer Interaction. Academic Kerstin S. Eliundh
Dubey S. K., Anubha, G., Ajay R.,
(2012)Usability Evaluation of
Software System Using fuzzy Multi criteria approach.IJCSI
International Journal of Computer Science 9:3 1694-0814
IoannisStameles (2013). Knowledge Based Evaluation of Software System:
International Journal of Digital
Information and Wireless
Communications (IJDIWC) 2(2): 197-201
ISO/IEC (1991). ISO/IEC 9126. Information
technology - Software Product
Evaluation – Quality Characteristics and Guidance for their Use.
Ivory, Melody Yvette (2001).An Empirical
Foundation for Automated Web
Interface Evaluation
Khyaatt M.M. ,Sinhat A., Verma, B (2013) Adaptive Neuro- Fuzzy Inference System (ANFIS) Based Software Evaluation. International Journal of Computer Science Issues, 10 (5): 1694-0814: 1694-0784
Melody, Y. I. and Hearst, M. (2001). The
State-of-The-Art in Automating
Usability Evaluation of User
Interfaces, in ACM Computing
Surveys.
Mike J., Steve C. and Rob B. (2011). Software Evaluation: Criteria-Based Assessment
Sheikh U. F., Quadri SMK (2013). Empirical Evaluation of Software Testing Techniques – Need, Issues and Mitigation. Software Engineering: An International Journal (SEIJ). 3: 141 Teresa M. P. and Walters. L. M. (2013). Evaluating web-based learning systems
Zihou Z. (2009). Evaluating Websites Using a Practical Quality Model.