R E S E A R C H
Open Access
Transcriptome and proteome profiling of
neural stem cells from the human
subventricular zone in Parkinson
’
s disease
Vanessa Donega
1†, Saskia M. Burm
1†, Miriam E. van Strien
1, Emma J. van Bodegraven
1, Iryna Paliukhovich
2,
Hanneke Geut
3, Wilma D. J. van de Berg
3, Ka Wan Li
2, August B. Smit
2, Onur Basak
1,4and Elly M. Hol
1,5*Abstract
It is currently accepted that the human brain has a limited neurogenic capacity and an impaired regenerative potential. We have previously shown the existence of CD271-expressing neural stem cells (NSCs) in the subventricular zone (SVZ) of Parkinson’s disease (PD) patients, which proliferate and differentiate towards neurons and glial cells in vitro. To study the molecular profile of these NSCs in detail, we performed RNA sequencing and mass spectrometry on CD271+ NSCs isolated from human post-mortem SVZ and on homogenates of the SVZ. CD271+cells were isolated through magnetic cell separation (MACS). We first compared the molecular profile of CD271+NSCs to the SVZ homogenate from control donors and then compared CD271+cells to CD11b+microglia. These results confirmed their neural stem cell identity. Finally we compared controls and PD patients to establish a specific molecular profile of NSCs and the SVZ in PD. While our transcriptome analysis did not identify any differentially expressed genes in the SVZ between control and PD patients, our proteome analysis revealed several proteins that were differentially expressed in PD. Some of these proteins are involved in cytoskeletal organization and mitochondrial function. Transcriptome and proteome analyses of NSCs from PD revealed changes in the expression of genes and proteins involved in metabolism, transcriptional activity and cytoskeletal organization. Our data suggest that NSCs may transit into a primed-quiescent state, that is in an“alert”non-proliferative phase in PD. Our results not only confirm pathological hallmarks of PD (e.g. impaired mitochondrial function), but also show that the NSCs from SVZ undergo significant changes at both transcriptome and proteome level following PD.
Keywords:RNA sequencing, Transcriptomics, Proteomics, Neural stem cells, Quiescence, Human SVZ, Parkinson’s disease
Introduction
Parkinson’s disease (PD) is characterized by progressive degeneration of dopaminergic neurons resulting in signifi-cant impairments of both cognitive and motor function
[51]. Current therapeutic options, such as L-Dopa
treat-ment, triggers side-effects with prolonged use of the drug [7]. It is therefore, crucial that new therapeutic options are developed, which lead to long-term improvement of both
motor and cognitive functions. An alternative treatment option would be the replacement of lost dopaminergic neurons by stimulating endogenous neural stem cells (NSCs) to generate new dopaminergic neurons. The chal-lenge for this alternative is that the mammalian brain has an impaired capacity to repair. Following birth, neuroge-nesis in humans becomes restricted to two germinally active regions: the subventricular zone (SVZ) along the lateral ventricles and the subgranular zone (SGZ) of the
hippocampal dentate gyrus [13, 14, 23]. Importantly, we
found evidence that a population of NSCs persist in the
SVZ of both elderly [30, 52] and PD patients [54]. Our
previous studies show that these NSCs, which are GFAPδ
and NGFR (i.e. CD271) positive, proliferate and
differen-tiate towards neurons and glial cells in vitro [44, 52].
These findings offer hope for the development of
© The Author(s). 2019Open AccessThis article is distributed under the terms of the Creative Commons Attribution 4.0 International License (http://creativecommons.org/licenses/by/4.0/), which permits unrestricted use, distribution, and reproduction in any medium, provided you give appropriate credit to the original author(s) and the source, provide a link to the Creative Commons license, and indicate if changes were made. The Creative Commons Public Domain Dedication waiver (http://creativecommons.org/publicdomain/zero/1.0/) applies to the data made available in this article, unless otherwise stated.
* Correspondence:[email protected]
†Vanessa Donega and Saskia Burm contributed equally to this work. 1Department of Translational Neuroscience, UMC Utrecht Brain Center,
University Medical Center Utrecht, Utrecht University, Utrecht, The Netherlands
5Department of Neuroimmunology, Netherlands Institute for Neuroscience,
Institute of the Royal Netherlands Academy of Arts and Sciences, Amsterdam, The Netherlands
therapeutic strategies to stimulate these NSCs to regener-ate the injured brain.
Studies in rodents suggest that activation of endogenous NSCs leads to the replacement of lost dopaminergic
neu-rons [5, 27–29]. Endogenous NSCs may thus be a source
of stem cells for brain repair to improve cognitive func-tion. Developing an approach to stimulate the endogenous capacity of the brain to repair also has advantages, as it circumvents the risks and ethical concerns of cell-replace-ment based strategies in which fetal or induced pluripo-tent stem cell-derived NSCs are transplanted into the injured brain [3,32,53].
Due to the scarcity of human brain material and tech-nical limitations, it remains unresolved whether repair occurs in the human brain. Despite the lack of conclusive evidence for neurogenesis following injury in humans
[36], the fact that NSCs can be found in germinal regions
in the human brain raise new possibilities for the develop-ment of therapeutic strategies [23, 46, 47, 50]. However, little is known about the nature of adult human NSCs due to the limitations mentioned above. Recent advances in transcriptome analysis offer an unprecedented level of resolution into the molecular signature of specific cell types. Recently, single cell RNA sequencing has provided novel insights into the molecular profile and behavior of radial glial cells (RGCs) from the rodent [12, 34, 49, 57]
and fetal human SVZ [22,58]. These studies revealed that
RGCs are a highly heterogeneous population of cells.
In this study, we isolated CD271+ NSCs from human
post-mortem SVZ tissue from control and PD donors,
[55] and assessed their molecular profile by RNA
sequen-cing and mass spectrometry. First, we compared the
mo-lecular profile of CD271+ NSCs to the SVZ homogenate
and CD11b+ microglia to determine their gene signature
profile. We next compared the transcriptome of CD271+
cells to CD11b+ microglia, which confirmed the NSC
identity of the CD271+ cells and provide a molecular
sig-nature of NSCs of the adult human SVZ. The expression
profiles of CD271+cells and SVZ homogenate were
com-pared between controls and PD patients to establish a molecular profile of NSCs and the SVZ following PD. Transcriptome and proteome analysis revealed changes in the expression of genes and proteins involved in metabo-lism, cytoskeletal organization and transcriptional activity.
Material and methods
Human post-mortem brain tissue
Human post-mortem SVZ tissue from PD patients (n= 16)
and donors without neurological disease (i.e. control
donors) (n= 11) were obtained from the Netherlands Brain
Bank (NBB;https://www.brainbank.nl). The NBB is
special-ized in performing quick brain autopsies (average
post-mortem delay of samples included in this study is 7 h), which is a prerequisite to ensure excellent tissue quality.
NBB has permission from the donors to perform autopsies for tissue isolation and accessing medical records for scien-tific purposes. All donors, or their next of kin, have given in-formed consent for the use of brain tissue for scientific purposes. To ensure donor anonymity we only disclose a serial number, which is given by the NBB. This number re-lates to the year the autopsy was performed and the autopsy number in that year. We obtained freshly dissected SVZ
tis-sue (1–5 g per donor) of Parkinson’s patients (PD) and
con-trol (Cntr) donors. Clinico-pathological information of all
donors was gathered (Additional file1: Table S1, Additional
files8and9: Figure S1 and Figure S2). The clinical diagno-sis was confirmed by post-mortem pathological evaluation of several brain regions, which included evaluation of Alz-heimer’s and PD pathology according to the Braak staging
system, Brain Net Europe protocols and ARTAG [1, 39].
For the RNA sequencing analysis there was a significant dif-ference in the mean age of the donors (Cntr = 84 years; PD = 76 years) (Additional file8: Figure S1) and in the dis-tribution of males and females in the groups (Additional file 8: Figure S1 and S2). Control donors were only included to the analysis, following assessment of medical history and pathological scoring. Because these are all aged donors, it is practically impossible to have control donors with a score of 0 on Thal_phase and Braak NFT. Donors used for RNA sequencing showed no significant difference in Braak NFT
and CERAD scores, but both Thal_phase and Braakα-syn
scores were significantly higher in the PD donors
(Additional file 8: Figure S1). Donors used for proteomics
analysis only differed significantly in Braak α-syn scores
(Additional file9: Figure S2). Following pathological evalu-ation by the NBB, it appeared that one control donor that was used for RNA sequencing of the SVZ had early signs of PD pathology in the brainstem, as shown on the Braak
α-syn and McKeithα-syn scores. As this was not associated
with cognitive and motor impairments we kept this donor as a control.
Immunohistochemistry and quantification
Immunohistochemistry was performed on post-mortem
SVZ tissue (Additional file 2: Table S2) post-fixed in 4%
paraformaldehyde (PFA) dissolved in PBS. Briefly, 7μm
thin paraffin sections were deparaffinated, washed, and antigen retrieval was performed in 10 mM citrate buffer pH 6.0 at 80 °C for 20 minutes (min). After cooling down, sections were thoroughly washed in 0.25% Triton-X in PBS and incubated with blocking solution 0.25% BSA with 0.4% Triton-X in PBS at room temperature for 1 hour (h). Sections were incubated with primary antibodies at 4 °C overnight. The following pri-mary antibodies were used: rabbit anti-FGFR3 (1:100;
Santa Cruz sc-9007) and rabbit anti-S100β (1:1000;
antibodies conjugated to Alexa-555 (1:1000, Invitrogen) at room temperature for 1 h. Subsequently, the sections were incubated with Sudan Black to quench autofluores-cence for 7 min and washed in 70% ethanol for 1 min. Nuclear counterstaining was done with Hoechst 33258 (1:1000, Biorad). The stained sections were analyzed on a Zeiss LSM880 confocal laser microscope using 40x/ 1.3NA oil DICII objectives (EC PlnN), a AxioCam MRm camera (Zeiss), and the software Zen black Z.1SP3.
Im-ages were taken with a z-step of 2μm and a resolution
of 1024 × 1024. FGFR3 and S100β positive cells in the
SVZ were counted by eye in one section of the SVZ and corrected for the area (SVZ area ranged from 2 to 7 mm2).
Cell isolation
CD271+NSCs and CD11b+microglia were isolated from
post-mortem human SVZ tissue as described previously [55]. Briefly, all visible blood vessels were removed and the tissue was dissociated mechanically and enzymatically using 2.5% trypsin (Gibco, Life Technologies, Paisley, UK) and 20 U/ml DNase (Roche Diagnostics GmbH, Mannheim, Germany) at 37 °C for 30 min. The tissue homogenate was washed and resuspended in cold DMEM without phenol red (Gibco, Life Technologies), and filtered through a
100μM nylon cell strainer (Corning, New York, USA).
Next, Percoll (GE Healthcare Bio-sciences AB, Uppsala, Sweden) density gradient centrifugation (30 min at 3200 x g at 4 °C) was used to separate the different cellular fractions. The turbid fraction containing NSCs (second fraction with lowest density) was collected and washed in complete DMEM (Gibco, Life Technologies) supplemented with 10%
fetal calf serum (FCS), 25 mM HEPES pH 7.2, 25μg/ml
penicillin, 25μg/ml streptomycin. CD271+ NSCs and
CD11b+ microglia were isolated with magnetic cell
sepa-ration (MACS) (Miltenyi Biotec, Bergisch Gladbach, Germany) by using microbeads coated with an antibody against CD271 or CD11b (Miltenyi Biotec). This procedure
yielded between 25.000–100.000 CD271+
NSCs and
500.000–1.000.000 CD11b+
microglia per donor. SVZ samples were generated on unsorted SVZ tissue by homogenization in Trizol (Ambion, Life Technologies, Carlsbad, CA). Following centrifugation, the cell pellets were either lysed in Trizol at room temperature for 15 min
and stored at −80 °C until RNA sequencing analysis or
stored directly at−80 °C for mass spectrometry analysis.
RNA sequencing
RNA isolation and quality control
Total cellular RNA was isolated using the miRNeasy mini kit in combination with DNase treatment (Qiagen GmbH, Hilden, Germany) according to the
manufac-turers’ instructions. Total RNA was eluted in 10μl
RNase-free water and RNA concentration was measured
on a Nanodrop (Thermo Scientific). The RNA Integrity Number (RIN) value was determined using the Agilent RNA 6000 p kit (Agilent Technologies, Waldbronn, Germany) on the Agilent 2100 Bioanalyzer according to
the manufacturers’ protocol. When possible only
samples with a RIN value higher than 6 were included
(Additional file 3: Table S3). We did not observe any
effect of lower RIN value on total number of reads after
mapping following RNA sequencing (Additional file 3:
Table S3).
Cel-Seq2 library preparation and sequencing
For each sample a custom-made primer solution was added to 15 ng RNA, which was subsequently denatured at 70 °C for 2 min, and quickly cooled thereafter. mRNA was reverse transcribed into cDNA (first and second strand) using the Cel-Seq kit and purified using clean up columns (ThermoFisher Scientific, Ambion, Waltham, USA). The purified cDNA was transcribed in vitro to obtain amplified RNA, which was followed by purification with Agencourt RNAClean XP (RNAse free) beads (Beck-man Coulter) and ExoSap treatment to remove residual primers (Thermo Fisher Scientific). aRNA was fragmented using the Cel-Seq kit (Ambion) and purified using RNA-Clean XP (RNAse free) beads. Quality of the amplified RNA was assessed by Agilent 2100 Bioanalyzer measure-ments using RNA pico chips (Agilent). Next, cDNA libra-ries were made from the amplified RNA using a modified
Cel-Seq2 method [18]. The amplified RNA was reverse
transcribed and amplified by PCR. Libraries were labeled with a 4 bp random unique molecular identifier (UMI) that was added to the primer in between the cell-specific barcode and the poly-T stretch. Libraries were purified twice using AMPure XP Beads (Beckman Coulter). Qua-lity of the DNA libraries was assessed by Bioanalyzer measurements using high sensitivity DNA chips (Agilent). Libraries were sequenced on Illumina Nextseq 500 and Illumina HighSeq 2500 using paired-end sequencing.
Data analysis
Paired-end reads from Illumina sequencing were aligned to the human genome with Burrows-Wheeler Aligner
(BWA) [31] (version 0.7.10-r126) and assigned to the
correct libraries. Reads that mapped equally well to mul-tiple loci were discarded. For each sample, all transcripts derived from the same gene locus were aggregated. Libraries for RNA sequencing were prepared by match-ing samples that were comparable in RIN profile and
RNA concentration (Additional file 3: Table S3). There
was no correlation between read count and age of the donors, disease status, post-mortem delay, cell type, or RIN values of the RNA (not shown). Upon alignment of the raw RNAseq reads, we excluded samples that had
Read counts were normalized by using transcripts per million (TPM). A total of 21 samples, including six
CD11b+ (2 Control and 4 PD), eight CD271+samples (3
Control and 5 PD) and seven SVZ samples (3 Control and 4 PD) were analyzed. Differentially expressed genes were identified with R studio package DESeq2.
Gene ontology enrichment analysis
The gene ontology (GO) analysis, Panther pathway analysis, and Protein Protein Interaction (PPI) analysis were performed on a list of differentially expressed genes that was obtained by performing differential gene expression analysis with R studio package DESeq2 (both down- or up-regulated genes). The lists of genes
used for this analysis are provided as Additional files5,
6 and 7: Tables S5-S7 and provide the list of
differen-tially expressed genes in CD271+ NSCs vs SVZ from
control donors, CD271+ NSCs vs CD11b+ microglia
from both control and PD donors and in CD271+NSCs
from control vs PD donors. We loaded these lists in
EnrichR web-based tool [6, 26] (http://amp.pharm.
mssm.edu/Enrichr/), which performs enrichment ana-lysis. The selection of NSC, oligodendrocyte and neuro-blast genes for the heatmaps was based on a single cell RNA sequencing dataset that identified these
popu-lation of cells in the mouse brain [34] using the
Morpheus Broad Institute Software (https://software.
broadinstitute.org/morpheus/).
qRT-PCR
From the residual RNA, cDNA was synthetized using the Quantitect Reverse Transcription kit (Qiagen GmbH,
Hilden, Germany) according to manufacturers’protocol.
Primers were designed using the Primer-BLAST
desig-ning tool from the NCBI website (https://www.ncbi.nlm.
nih.gov/tools/primer-blast/; listed in Additional file 4: Table S4) and qRT-PCRs were performed on the Quan-tistudio 6 Flex (Applied Biosystems, Life Technologies) using FastStart Universal SYBR green master (Rox) reagent (Roche Diagnostics) and analyzed using the Quantstudio Realtime PCR software (version v1.1; Applied Biosystems). Relative gene expression was normalized to the reference genesE2Ubi,Alus,andEf1ausing the Pfaffl method [42].
Mass spectrometry
Sample preparation
The pellets of NSCs (Control n= 6; PDn= 7) and fresh
frozen whole SVZ (Control n= 3; PD n = 7) were
homogenized in 2x sodium dodecyl sulfate (SDS) buffer
and heated to 98 °C for 5 min, and 3μL 30% acrylamide
was added to alkylate the cysteine. Samples were loaded onto a 10% SDS-polyacrylamide gel and run briefly for 10 min. Gels were stained lightly with colloidal Coomas-sie Blue, and the gel lane of each sample was cut out
and chopped into smaller pieces using a scalpel and transferred to an Eppendorf tube. The gel pieces were destained with 50% acetonitrile in 50 mM ammonium bicarbonate, dehydrated in 100% acetonitrile, and rehydrated in 50 mM ammonium bicarbonate. This destaining cycle was repeated once. After dehydration in 100% acetonitrile, the samples were incubated with
trypsin solution containing 10μg/ml trypsin (sequence
grade; Promega, Madison, WI, USA) in 50 mM ammo-nium bicarbonate at 37 °C overnight. Peptides from the
gel pieces were extracted twice with 100μl 50%
aceto-nitrile in 0.1% trifluoroacetic acid, dried in a speedvac
and stored at−20 °C until further use.
Mass spectrometry
Peptides were redissolved in 7.5μL 0.1% formic acid and
analyzed by mass spectrometry according to protocols
previously described [41] using the TripleTOF 5600
mass spectrometer (Sciex, Ontario, Canada) coupled to an Ultimate 3000 LC system (Dionex, ThermoFisher Scientific). Peptides were fractionated on a 200 mm
All-tima C18 column (300μm ID, 3μm particle size) at a
flow rate of 5μl/min. Acetonitrile concentration in the
mobile phase in 0.1% formic acid was increased from 5 to 18% in 88 min, to 25% at 98 min, 40% at 108 min, and to 90% at 110 min. The MS survey scan range was m/z 350–1250, with top 20 precursor ions selected for MS/ MS acquisition. Rolling CID function was activated. All raw MS data were analyzed by MaxQuant software (version 1.5.2.8) with search engine Andromeda. The
Human database used was UniProt_2015–02. The fixed
modification was propioamide. Match between runs with match time window of 0.7 min and alignment time window of 5 min were used for all analyses. For other parameters the default settings were used.
Data analysis
The mass spectra were searched against the Swissprot human database (version Feb 2015) with MaxQuant soft-ware (version 1.6.2.3). The mass tolerances in MS and MS/MS were set to 6 ppm and 0.5 Da, respectively. Tryp-sin was selected as the digestion enzyme and up to two missed cleavages were allowed. Methionine oxidation and protein N-terminal acetylation were set as variable modifi-cations, and cysteine alkylation with acrylamide was set as fixed modification. False discovery rates of both peptides and proteins were set within a threshold value of 0.01. The valid protein hits should contain at least one unique
peptide. The intensity-based absolute quantification
P-values and logFC were calculated with the R studio package Limma (version 3.36.1).
Statistical analysis
Data are expressed as mean ± SEM. Significance was tested on GraphPad Prism 7 with two-tailed unpaired t-test or one-way ANOVA followed by Sidak’s multiple comparisons test.
Results
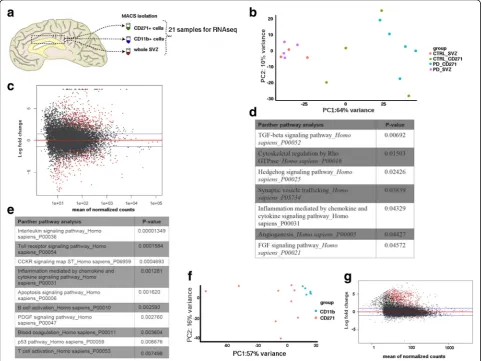
Transcriptome analysis of the human SVZ
Transcriptome analysis was performed on sorted
CD271+NSCs, CD11b+cells, and total SVZ tissue (from
here on called SVZ homogenate) from controls and PD
patients (Fig. 1a). We started by comparing the CD271+
NSCs with the SVZ homogenate. A principle component
analysis (PCA) revealed one well-defined cluster,
corresponding to the SVZ homogenate (Fig.1b). In
con-trast, no clusters were identified in the CD271+ NSCs,
suggesting heterogeneity. This heterogeneity is observed in both control and PD patients and is thus, not due to differences in disease progression. Differential gene ex-pression analysis identified 605 genes that were
differen-tially expressed in CD271+ NSCs when compared to the
SVZ cell population (adj p-value < 0.01; Fig. 1c and
Additional file 5: Table S5). Of these differentially
expressed genes 334 were higher expressed in CD271+
cells in comparison to SVZ homogenate, indicating that these are the signature genes of the NSCs.
Panther pathway analysis on genes downregulated in
CD271+ cells identified enrichment for genes involved in
TGF-β, Hedgehog, and FGF signaling pathways, which are
important regulators of neurogenesis and cell cycle
progression [8] (Fig. 1d). Panther pathway analysis on
genes upregulated in CD271+cells showed enrichment for
inflammation and apoptosis signaling pathways (Fig. 1e),
thus hinting that we isolated an immune cell population.
Therefore, we next compared these cells to CD11b+
microglia, which confirmed the stem cell identity of
CD271+ cells (adjp-value < 0.01; Fig.1fand Additional
file 6: Table S6). Differential gene expression analysis
identified 895 genes that were differentially expressed
in CD271+ cells when compared to CD11b+ microglia
(Fig. 1g and Additional file 6: Table S6). 825 of these
genes were upregulated in CD271+ cells, among which
the neural stem cell markers SOX2 and NES. Gene
ontology (GO) analysis on these upregulated genes showed enrichment for GO terms related to central nervous system development and glial cell differen-tiation (not shown). Differentially expressed genes
be-tween CD271+ cells and SVZ homogenate, further
confirmed the phenotype of the isolated populations of
cells, with CD271+cells showing the expression of NSC
markers, such as CD9, ID2, EGFR and MCM2. As
expected, the SVZ homogenate showed expression of
oligodendrocyte (e.g. Sox10 and Olig1), NSC and
neuroblast (e.g.DCX andTUBB3) markers (Additional
file10: Figure S3).
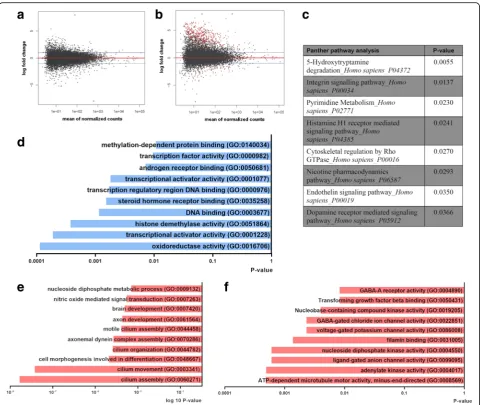
Changes in transcript profile of CD271+NSCs following Parkinson’s disease
Next, we determined the changes in the transcriptome that occurred in PD. No significant differences in gene expres-sion between controls and PD patients were found in the
SVZ homogenate (Fig. 2a). In contrast, we identified 483
genes that were differentially expressed in CD271+ NSCs
from PD patients compared to control donors (Fig.2b). The
expression of 61 genes was significantly increased, while the
expression of 422 genes was decreased (Additional file 5:
Table S5) in PD patients. A selection of top upregulated and
downregulated transcripts (viz. KDMA2A, RAD51C,
HSPA1L, IGFBP5 adj. p-value < 0.005) was validated by
qPCR (Additional file 11: Figure S4). These genes encode
for proteins involved in protein demethylation, mtDNA integrity, mitochondrial quality control and tissue develop-ment [19,35,38,45].
Interestingly, Panther pathway analysis highlighted changes in serotonin degradation and dopamine signaling
due to downregulation of MAOB, ALDH3A1, ADCY2,
CLIC6 and PPP1R1B genes (Fig. 2c). GO analysis of
up-regulated genes in PD-derived CD271+ NSCs revealed
changes in the “oxidoreductase activity” and “
transcrip-tional activity”(Fig.2d). Moreover, GO analysis of
down-regulated genes showed changes in “TGFβ binding”,
“filamin binding” and “cilium assembly and movement”
(Fig.2d-e). Our results underline key changes in the
tran-scriptome signature of CD271+NSCs in PD, among which
are cytoskeletal organization, transcriptional activity and channel activity.
It has been shown in adult rodents, that NSCs are a dy-namic population of cells that transit between different ac-tivation states, i.e. dormant/quiescent (qNSC), primed-quiescent, and aNSC [9,16,34]. Interestingly, qNSCs were shown to re-enter the cell cycle through interferon
(IFN)-γ mediated activation following ischemic brain
lesion in adult mice [34]. Thus, to determine whether the
dysregulated gene expression could be associated with changes in NSC cell cycle transition, i.e. quiescent to activated state, we assessed gene expression of specific markers for qNSCs/astrocytes, lineage specification, and proliferation [12,48], showed a decrease in the expression
of astrocyte marker S100β (Fig. 3a). No significant
changes were observed for the expression of lineage
markers (Fig. 3b). Proliferation markers did not
in-crease significantly (Fig.3c) as previously shown by
im-munohistochemical analysis on SVZ tissue sections
from PD patients [54]. Immunohistochemical validation
showed a significant decrease in the expression of FGFR3, a marker for quiescence in the SVZ of PD
patients compared to control donors (Fig. 3d-e). All
together, our data suggest that CD271+NSCs may
tran-sit into a primed-quiescent state in PD.
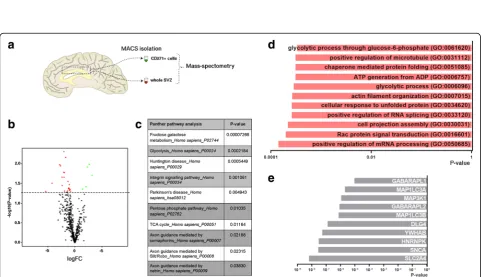
Changes in proteins involved in metabolism in CD271+ NSCs in Parkinson’s disease
We next assessed whether there were any significant
changes in protein expression in CD271+NSCs in PD, by
mass spectrometry analysis of CD271+ NSCs of control
(n= 6) and PD patients (n= 7) (Fig. 4a). Proteomics
ana-lysis included 480 proteins, as we only selected proteins that were detected in at least 5 out of 6 donors. Linear re-gression analysis identified 26 proteins that were
differen-tially expressed in PD (Fig.4band Additional file7: Table
S7). Interestingly, Panther pathway analysis on these pro-teins showed changes in signaling pathways involved in “metabolism” (ALDOA, HK1, MDH1), and
“neurodegen-erative diseases”(VAT1, RHOG, RAC1, HSPA9, HSPA1A)
(Fig. 4c and Additional file 11: Figure S5). ALDOA and
HK1 are both key enzymes in glucose metabolism. HK1 is also significantly downregulated at gene level (Additional
file 12: Figure S5a). Interestingly, the protein expression
level of some ATP synthases was increased in PD (Add-itional file 12: Figure S5a). These ATP synthases are
in-volved in producing ATP during oxidative
phosphorylation. Changes in metabolic processes were
further highlighted by GO analysis (Fig. 4d). To assess
involved in “glucose transport” (SLC2A4), “mRNA
pro-cessing” (HNRNPK) and “cell cycle” (YWHAB) were
among the top 10 proteins that could potentially interact
with the downregulated proteins (Fig.4e).
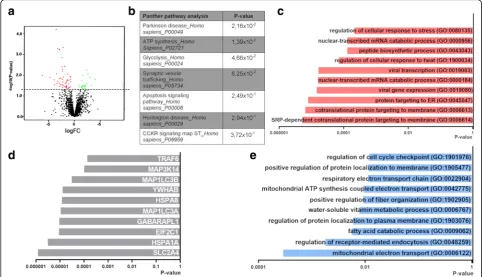
We then assessed protein expression in the SVZ of
con-trol (n= 4) and PD patients (n= 7) (Fig. 4a). Proteome
analysis detected 2027 proteins (only proteins that were detected in at least 2 out of 3 donors) of which 90 were dif-ferentially expressed in PD in the SVZ homogenate
com-pared to control (Fig.5a and Additional file 7: Table S7).
Panther pathway analysis on downregulated proteins further underlines a dysregulation in pathways involved in
Parkinson’s disease (PSMA7, SNCA) as seen in the CD271+
NSCs, and also on metabolism (viz. ATP synthesis: CYCS,
and glycolysis: GAPDH) (Fig.5b). GO analysis on
downreg-ulated proteins suggest changes in the “protein
transloca-tion machinery” (e.g. RPL21, RPL14 and RPS23) and
“catabolism of mRNA molecules” (e.g. RPL14 and RPL8)
(Fig. 5c). Protein-protein interaction (PPI) analysis showed
that proteins involved in “protein folding and transport”
(HSPA1 and HSPA8) and “formation of autophagosomes”
(MAP1LC3B and MAP1LC3A) were among the top 10 proteins postulated to interact with the downregulated
proteins (Fig. 5d). GO term analysis suggest changes in
mitochondria function (e.g. UQCRQ, UQCR11 and MUT) (Fig.5e).
Fig. 3Expression of genes involved in NSC activation state remains unaltered after PD.a-cRelative expression of markers for qNSCs and aNSCs (a), lineage progression (b) and proliferation (c). Data shown are TPM-normalized read counts.dQuantification of the number of S100β+and FGFR3+cells in the human SVZ (control and PD).eRepresentative images of FGFR3+cells in the human SVZ. Cntr = control; PD = Parkinson’s disease. Data are presented as mean ± SEM. Scale bar = 10μm
Discussion
We have previously described a population of NSCs that not only persists in the SVZ at old age, but are also found in the SVZ of PD patients. These cells retain their
proliferative and multipotent capacity [52, 54] and are
characterized by CD271 expression [55]. The presence
of NSCs in PD brains potentially opens up new possibi-lities for the development of novel therapeutic strategies to stimulate the endogenous NSC pool to replace lost dopaminergic neurons. To further characterize the CD271-expressing NSCs, we performed transcriptome and proteome analysis of cells isolated from the SVZ of both controls and PD patients. Our results provide the gene signature of NSCs from the adult human SVZ and
suggest that these CD271+ NSCs may transit in a
primed-quiescent state, and may thus, be amenable for manipulation to boost their neurogenic potential.
First, we performed in controls a transcriptome profiling of CD271 expressing NSCs by comparing these to SVZ
homogenate and CD11b+ microglia, which confirmed
their NSC identity at transcriptome level and provides a gene signature for NSCs of the adult human SVZ. Our
transcriptome and proteome analysis of CD271+ NSCs
from controls and PD patients revealed several processes
and signaling pathways that are altered in PD.
Interestingly, Panther pathway analysis showed a dysregu-lation of the 5-hydroxytryptamine degradation pathway,
due to the downregulation of MAOBgene expression in
PD, which encodes for the enzyme Monoamine Oxidase B
that degrades dopamine and serotonin (Fig. 2c). This
could reflect an attempt of the system to compensate for the lower level of dopaminergic and serotonergic signaling found in PD. Neurotransmitters have long been known to regulate neurogenesis during development and adulthood
[4]. It has been suggested that both dopaminergic and
serotonergic signaling promote proliferation in the SVZ
[2, 56]. However, a previous study from the lab showed
that dopamine had no effect on proliferation of human
NSCs in vitro [54]. It is still unclear whether dopamine
positively regulates neurogenesis in both NSCs and pro-genitors. Also, the exact role that neurotransmitter
signa-ling plays in the regulation of neurogenesis after injury
remains unclear and it might have a different function than under physiological conditions [20,24].
Our proteomic data suggest a downregulation in
glyco-lytic metabolism (Fig. 4), which has been described as a
hallmark of qNSC identity [12,25,34, 48]. Moreover, the
quiescence marker FGFR3 was significantly decreased in
the SVZ of PD patients.FGFR3is enriched in qNSC [40]
[15]. Constitutive activation of FGFR3 increases prolifera-tion while decreasing apoptosis in progenitors of the
embryonic mouse brain [21]. qNSCs have been shown to
downregulate glycolysis and enter a primed-quiescent intermediate state before becoming active and switching to oxidative phosphorylation. Moreover, qNSCs have been shown to enter a primed-quiescent state upon ischemic
brain injury in adult mice [34]. In other tissues, such as
bone marrow [37] and muscle [43], quiescent stem cells
alternate between a quiescent and active state and may
enter an“alert state”upon injury, thereby participating to
tissue regeneration. Indeed, qNSCs may be more respon-sive to injury signals, as their higher expression of mem-brane receptors such as G protein-coupled receptors, may make them more sensitive to changes in their
environ-ment [9, 11, 33, 34]. Despite the high variation within
groups we took a closer look into genes specifying
quies-cent or activated NSCs (Fig.3), lineage specification, and
proliferation. Based on these expression profiles we found no evidence for NSC activation or proliferation in PD,
thereby confirming earlier results [54]. Thus, in the one
hand we found no evidence for increased NSC prolifera-tion, but our proteomic analysis suggest changes in the metabolic and quiescent state of these NSCs. These
changes suggest that the CD271+ NSCs may transit into
an alert state as result of the injury.
Interestingly, we also observed a large number of
cilia-related genes that were downregulated in PD (Fig.2e).
These genes are known to be involved in cilia movement, formation, and function. Recently, one of the best known genetic contributors for the development of PD, leucine rich-repeat kinase 2 (LRRK2), has been shown to interfere with primary cilia formation both in vitro and in vivo as a result of its increased kinase activity [10]. Loss of primary cilia on cholinergic neurons led to reduced response to hedgehog signaling, which has been suggested to have
neuroprotective effects on dopaminergic neurons [17].
Further studies are necessary to confirm the dysregulation in the expression of cilia-related genes in NSCs of PD patients and its biological significance.
Conclusions
We provide a first comprehensive overview of the tran-scriptome and proteome profiles of the human SVZ and NSCs from the human SVZ in health and in PD. Our
study confirms the stem cell identity of the CD271+cells
and provides the gene signature of NSCs from the adult human SVZ. Our data offers a platform with novel target genes and pathways for manipulation to promote brain repair in PD. This study is the first to show the molecu-lar response of NSCs of the human SVZ to degeneration and provide a first indication that human NSCs of the
SVZ may transit into an“alert”state in a
neurodegenera-tive disease. It is important to keep in mind that we
investigated the end stage of the disease, and that the transcriptome and proteome profiles offer only a narrow
window into the identity of CD271+ NSCs. Future
stud-ies with single cell RNAseq could circumvent the high variation between donors by providing higher resolution into the profile of this heterogeneous population of NSCs in the adult human brain.
Additional files
Additional file 1:Table S1.Characteristics, diagnosis and pathological evaluation of PD patients and control donors. CNTR = control; PD = Parkinson’s disease; PDD = Parkinson’s disease and dementia; CAA = cerebral amyloid angiopathy; AG = argyrophilic grain; PMD = post-mortem delay; UNK = unknown; ND = not determined; NA = not applicable. (XLSX 13 kb)
Additional file 2:Table S2.Characteristics and diagnosis of PD patients and control donors used for immunohistochemical analysis. (DOCX 14 kb)
Additional file 3:Table S3.Overview of RNA samples used for RNA sequencing. (DOCX 16 kb)
Additional file 4:Table S4.List of qPCR primer sequences. (DOCX 17 kb)
Additional file 5:Table S5.Genes differentially expressed in CD271+ cells in comparison to SVZ homogenate from control donors and differentially expressed genes in CD271+NSCs from PD patients compared to CD271+cells from control donors. (XLSX 189 kb)
Additional file 6:Table S6.Genes differentially expressed in CD271+ NSCs in comparison to CD11b+microglia cells from PD and control donors pooled together. (XLSX 120 kb)
Additional file 7:Table S7.Proteins differentially expressed in CD271+ NSCs and SVZ from PD patients in comparison to control donors. (XLSX 21 kb)
Additional file 8:Figure S1.Overview data from donors used for RNAseq analysis. Cntr = control; PD = Parkinson’s disease. *p-value < 0.03; ** p-value < 0.002; *** p-value < 0.0002. Data are presented as mean ± SEM. (TIF 4537 kb)
Additional file 9:Figure S2.Overview data from donors used for proteome analysis. Cntr = control; PD = Parkinson’s disease. *** p-value < 0.0002. Data are presented as mean ± SEM. (TIF 4590 kb)
Additional file 10:Figure S3.Heatmaps showing expression levels of lineage specific genes for NSC, neuroblasts and oligodendrocytes from controls in CD271+cells and SVZ homogenate. CTRL = control; PD = Parkinson’s disease; NSCs = neural stem cells. (TIF 2029 kb)
Additional file 11:Figure S4.Validation of gene expression by qPCR analysis. A select number of genes(a) that were identified as differentially expressed in the RNAseq analysis(b)were validated. Cntr = control; PD = Parkinson’s disease. *p-value < 0.03, **p-value < 0.002. Data are presented as mean ± SEM. (TIFF 4220 kb)
Additional file 12:Figure S5.Differentially expressed proteins involved in metabolism and neurodegenerative diseases. (a)Expression level of proteins involved in glycolysis (HK1 and ALDOA), malate metabolism (MDH1) and oxidative phosphorylation (ATP5-). (b)Expression level of proteins involved in neurodegenerative diseases. Data shown are average protein expression and TPM-normalized read counts. Cntr = control; PD = Parkinson’s disease. Data are presented as mean ± SEM. (TIF 8689 kb)
Abbreviations
aNSC:Activated neural stem cells; CTRL: Control; GO: Gene Ontology; NSC: Neural stem cells; PD: Parkinson’s Disease; qNSC: Quiescent neural stem cells; SVZ: Subventricular zone
Acknowledgments
Funding
This work was supported by grants from ZonMW-MKMD (#114021011), ZonMw-TAS (#116004204), and Parkinson Fund.
Availability of data and materials
The data files with the raw counts from the RNA sequencing and mass-spectrometry can be downloaded from data repository at GEO accession number: GSE130752.
Authors’contributions
V.D performed experiments, analyzed RNA sequencing data, data
interpretation and wrote the manuscript. S.B. designed the study, performed experiments and edited the manuscript. M.S. performed experiments and edited the manuscript. E.B analyzed mass-spectometry data and edited the manuscript. H.G analyzed pathology data and edited manuscript. W.B ana-lyzed pathology data and edited manuscript. I.P performed
mass-spectometry and edited manuscript. K.W.L performed mass-mass-spectometry and edited the manuscript. G.S. gave advice on mass-spectometry experiments and edited the manuscript. O.B performed RNA-sequencing experiments and edited the manuscript. E.H obtained funding, designed the study and wrote the manuscript. All authors read and approved the final manuscript.
Ethics approval
All the human brain material used in this study was obtained from the Netherlands Brain Bank (NBB;https://www.brainbank.nl). NBB has permission from the donors to perform autopsies for tissue isolation and accessing medical records for scientific purposes. All donors, or their next of kin, have given informed consent for the use of brain tissue for scientific purposes.
Consent for publication
Not applicable.
Competing interests
SB is currently employed at Genmab. The authors declare that they have no competing interests.
Publisher’s Note
Springer Nature remains neutral with regard to jurisdictional claims in published maps and institutional affiliations.
Author details
1
Department of Translational Neuroscience, UMC Utrecht Brain Center, University Medical Center Utrecht, Utrecht University, Utrecht, The
Netherlands.2Department of Molecular and Cellular Neurobiology, Center for Neurogenomics and Cognitive Research, Neuroscience Campus Amsterdam, VU University, Amsterdam, The Netherlands.3Department of Anatomy and Neurosciences, Amsterdam Neuroscience, Amsterdam UMC, VU University Medical Center, Amsterdam, The Netherlands.4Hubrecht Institute, Royal Netherlands Academy of Arts and Sciences and University Medical Center Utrecht, Utrecht, The Netherlands.5Department of Neuroimmunology, Netherlands Institute for Neuroscience, Institute of the Royal Netherlands Academy of Arts and Sciences, Amsterdam, The Netherlands.
Received: 29 March 2019 Accepted: 13 May 2019
References
1. Alafuzoff I, Ince PG, Arzberger T, Al-Sarraj S, Bell J, Bodi I et al (2009) Staging/typing of Lewy body relatedα-synuclein pathology: a study of the BrainNet Europe consortium. Acta Neuropathol 117:635–652.https://doi.org/ 10.1007/s00401-009-0523-2
2. Banasr M, Hery M, Printemps R, Daszuta A (2004) Serotonin-induced increases in adult cell proliferation and neurogenesis are mediated through different and common 5-HT receptor subtypes in the dentate gyrus and the subventricular zone. Neuropsychopharmacology 29:450–460.https://doi.org/ 10.1038/sj.npp.1300320
3. Barker RA, Barrett J, Mason SL, Björklund A (2013) Fetal dopaminergic transplantation trials and the future of neural grafting in Parkinson’s disease. Lancet Neurol 12:84–91.https://doi.org/10.1016/S1474-4422(12)70295-8
4. Berg DA, Belnoue L, Song H, Simon A (2013) Neurotransmitter-mediated control of neurogenesis in the adult vertebrate brain. Development 140: 2548–2561.https://doi.org/10.1242/dev.088005
5. Bertilsson G, Patrone C, Zachrisson O, Andersson A, Dannaeus K, Heidrich J et al (2008) Peptide hormone exendin-4 stimulates subventricular zone neurogenesis in the adult rodent brain and induces recovery in an animal model of Parkinson’s disease. J Neurosci Res 86:326–338.https://doi.org/10. 1002/jnr.21483
6. Chen EY, Tan CM, Kou Y, Duan Q, Wang Z, Meirelles GV et al (2013) Enrichr: interactive and collaborative HTML5 gene list enrichment analysis tool. BMC Bioinformatics 14.https://doi.org/10.1186/1471-2105-14-128
7. Chen JJ (2010) Parkinson’s disease: health-related quality of life, economic cost, and implications of early treatment. Am J Manag Care 16:S87–S9.3 8. Choe Y, Pleasure SJ, Mira H (2016) Control of adult neurogenesis by
short-range morphogenic-signaling molecules. Cold Spring Harb Perspect Biol 8: a018887.https://doi.org/10.1101/cshperspect.a018887
9. Codega P, Silva-Vargas V, Paul A, Maldonado-Soto AR, DeLeo AM, Pastrana E et al (2014) Prospective identification and purification of quiescent adult neural stem cells from their in vivo niche. Neuron 82:545–559.https://doi. org/10.1016/j.neuron.2014.02.039
10. Dhekne HS, Yanatori I, Gomez RC, Tonelli F, Diez F, Schüle B et al (2018) A pathway for Parkinson’s disease LRRK2 kinase to block primary cilia and sonic hedgehog signaling in the brain. Elife 7:1–26.https://doi. org/10.7554/eLife.40202
11. Donega V, Raineteau O (2017) Postnatal neural stem cells: probing their competence for cortical repair. Neuroscientist 23.https://doi.org/10.1177/ 1073858417697036
12. Dulken BW, Leeman DS, Hebestreit K (2017) Single cell transcriptomic analysis defines heterogeneity and transcriptional dynamics in the adult neural stem cell lineage. Cell Rep 18:777–790.https://doi.org/10.1016/j. celrep.2016.12.060
13. Eriksson PS, Perfilieva E, Björk-Eriksson T, Alborn AM, Nordborg C, Peterson DA et al (1998) Neurogenesis in the adult human hippocampus. Nat Med 4: 1313–1317.https://doi.org/10.1038/3305
14. Ernst A, Alkass K, Bernard S, Salehpour M, Perl S, Tisdale J et al (2014) Neurogenesis in the striatum of the adult human brain. Cell 156:1072–1083. https://doi.org/10.1016/j.cell.2014.01.044
15. Frinchi M, Bonomo A, Trovato-Salinaro A, Condorelli DF, Fuxe K, Spampinato MG et al (2008) Fibroblast growth factor-2 and its receptor expression in proliferating precursor cells of the subventricular zone in the adult rat brain. Neurosci Lett 447:20–25.https://doi.org/10.1016/j.neulet.2008.09.059 16. Giachino C, Basak O, Lugert S, Knuckles P, Obernier K, Fiorelli R et al (2014)
Molecular diversity subdivides the adult forebrain neural stem cell population. Stem Cells 32:70–84.https://doi.org/10.1002/stem.1520 17. Gonzalez-Reyes LE, Verbitsky M, Blesa J, Jackson-Lewis V, Paredes D, Tillack K
et al (2012) Sonic hedgehog maintains cellular and neurochemical homeostasis in the adult nigrostriatal circuit. Neuron 75:306–319.https://doi. org/10.1016/j.neuron.2012.05.018
18. Hashimshony T, Wagner F, Sher N, Yanai I (2012) CEL-Seq: single-cell RNA-Seq by multiplexed linear amplification. Cell Rep 2:666–673.https://doi.org/ 10.1016/j.celrep.2012.08.003
19. Hasson SA, Kane LA, Yamano K, Huang CH, Sliter DA, Buehler E et al (2013) High-content genome-wide RNAi screens identify regulators of parkin upstream of mitophagy. Nature 504(7479):291–295.https://doi. org/10.1038/nature12748
20. Höglinger GU, Rizk P, Muriel MP, Duyckaerts C, Oertel WH, Caille I, Hirsch EC (2004) Dopamine depletion impairs precursor cell proliferation in Parkinson disease. Nat Neurosci 7:726–735.https://doi.org/10.1038/nn1265 21. Inglis-Broadgate SL, Thomson RE, Pellicano F, Tartaglia MA, Pontikis CC,
Cooper JD et al (2005) FGFR3 regulates brain size by controlling progenitor cell proliferation and apoptosis during embryonic development. Dev Biol 279:73–85.https://doi.org/10.1016/j.ydbio.2004.11.035
22. Johnson MB, Wang PP, Atabay KD, Murphy EA, Doan RN, Hecht JL et al (2015) Single-cell analysis reveals transcriptional heterogeneity of neural progenitors in human cortex. Nat Neurosci:6–8.https://doi.org/10.1038/ nn.3980
23. Kempermann G, Gage FH, Aigner L, Song H, Curtis MA, Thuret S et al (2018) Human adult neurogenesis: evidence and remaining questions. Cell Stem Cell:1–6.https://doi.org/10.1016/j.stem.2018.04.004
antipsychotic drugs. J Neurosci 25:5815–5823.https://doi.org/10.1523/ JNEUROSCI.1120-05.2005
25. Knobloch M, Pilz GA, Ghesquière B, Kovacs WJ, Wegleiter T, Moore DL et al (2017) A fatty acid oxidation-dependent metabolic shift regulates adult neural stem cell activity. Cell Rep 20:2144–2155.https://doi.org/10.1016/j. celrep.2017.08.029
26. Kuleshov MV, Jones MR, Rouillard AD, Fernandez NF, Duan Q, Wang Z et al (2016) Enrichr: a comprehensive gene set enrichment analysis web server 2016 update. Nucleic Acids Res 44:W90–W97.https://doi.org/10. 1093/nar/gkw377
27. L’Episcopo F, Tirolo C, Testa N, Caniglia S, Morale MC, Cossetti C et al (2011) Reactive astrocytes and Wnt/β-catenin signaling link nigrostriatal injury to repair in 1-methyl-4-phenyl-1,2,3,6-tetrahydropyridine model of Parkinson’s disease. Neurobiol Dis 41:508–527.https://doi.org/10.1016/j.nbd.2010.10.023 28. L’Episcopo F, Tirolo C, Testa N, Caniglia S, Morale MC, Impagnatiello F et al
(2013) Aging-induced Nrf2-ARE pathway disruption in the subventricular zone drives neurogenic impairment in parkinsonian mice via PI3K-Wnt/ -catenin dysregulation. J Neurosci 33:1462–1485.https://doi.org/10.1523/ JNEUROSCI.3206-12.2013
29. L’Episcopo F, Tirolo C, Testa N, Caniglia S, Morale MC, Serapide MF et al (2014) Wnt/β-catenin signaling is required to rescue midbrain dopaminergic progenitors and promote neurorepair in ageing mouse model of Parkinson’s disease. Stem Cells 32:2147–2163.https://doi.org/ 10.1002/stem.1708
30. Leonard BW, Mastroeni D, Grover A, Liu Q, Yang K, Gao M, et al (2009) Subventricular zone neural progenitors from rapid brain autopsies of elderly subjects with and without neurodegenerative disease 294:269–294. doi: https://doi.org/10.1002/cne.22040
31. Li H, Durbin R (2009) Fast and accurate short read alignment with burrows-wheeler transform. Bioinformatics 25:1754–1760.https://doi.org/10.1093/ bioinformatics/btp324
32. Lindvall O, Kokaia Z (2010) Stem cells in human neurodegenerative disorders—time for clinical translation? J Clin Invest 120:29–40.https://doi. org/10.1172/JCI40543
33. Llorens-Bobadilla E, Martin-Villalba A (2017) Adult NSC diversity and plasticity: the role of the niche. Curr Opin Neurobiol 42:68–74.https://doi. org/10.1016/j.conb.2016.11.008
34. Llorens-Bobadilla E, Zhao S, Baser A, Saiz-Castro G, Zwadlo K, Martin-Villalba A (2015) Single-cell transcriptomics reveals a population of dormant neural stem cells that become activated upon brain injury. Cell Stem Cell 17:329– 340.https://doi.org/10.1016/j.stem.2015.07.002
35. Lu L, Gao Y, Zhang Z, Cao Q, Zhang X, Zou J et al (2015) Kdm2a/b lysine demethylases regulate canonical Wnt signaling by modulating the stability of nuclear b-catenin. Developmenal Cell 33:660–679.https://doi.org/10. 1016/j.devcel.2015.04.006
36. Marti-Fabregas J, Romaguera-Ros M, Gomez-Pinedo U, Martinez-Ramirez S, Jimenez-Xarrie E, Marin R et al (2010) Proliferation in the human ipsilateral subventricular zone after ischemic stroke. Neurology 74:357–365.https://doi. org/10.1212/WNL.0b013e3181cbccec
37. Mendelson A, Frenette PS (2014) Hematopoietic stem cell niche maintenance during homeostasis and regeneration. Nat Med 20:833–846. https://doi.org/10.1038/nm.3647
38. Mishra A, Saxena S, Kaushal A, Nagaraju G (2018) RAD51C/XRCC3 facilitates mitochondrial DNA replication and maintains integrity of the mitochondrial genome. Mol Cell Biol 38(3).https://doi.org/10.1128/MCB.00489-17 39. Montine TJ, Phelps CH, Beach TG, Bigio EH, Cairns NJ, Dickson DW et al
(2012) National institute on aging-Alzheimer’s association guidelines for the neuropathologic assessment of Alzheimer’s disease: a practical approach. Acta Neuropathol 123:1–11.https://doi.org/10.1007/s00401-011-0910-3 40. Morizur L, Chicheportiche A, Gauthier LR, Daynac M, Boussin FD, Mouthon
MA (2018) Distinct molecular signatures of quiescent and activated adult neural stem cells reveal specific interactions with their microenvironment. Stem Cell Reports 11:565–577.https://doi.org/10.1016/j.stemcr.2018.06.005 41. Pandya NJ, Klaassen RV, van der Schors RC, Slotman JA, Houtsmuller A, Smit
AB et al (2016) Group 1 metabotropic glutamate receptors 1 and 5 form a protein complex in mouse hippocampus and cortex. Proteomics 16:2698– 2705.https://doi.org/10.1002/pmic.201500400
42. Pfaffl MW (2001) A new mathematical model for relative quantification in real-time RT-PCR. Nucleic Acids Res 29:e45
43. Rodgers JT, King KY, Brett JO, Cromie MJ, Charville GW, Maguire KK et al (2014) mTORC1 controls the adaptive transition of quiescent stem cells
from G0 to G(alert). Nature 509:393–396.https://doi.org/10.1038/ nature13255
44. Roelofs RF, Fischer DF, Houtman SH, Sluijs JA, Haren W, Leeuwen FW et al (2005) Adult human subventricular , subgranular , and subpial zones contain astrocytes with a specialized intermediate filament cytoskeleton. 300:289– 300.https://doi.org/10.1002/glia.20243
45. Salih DAM, Tripathi G, Holding C, Szestak TAM, Gonzalez MI, et al (2004) Insulin-like growth factor-binding protein 5 (Igfbp5) compromises survival, growth, muscle development, and fertility in micePNAS 101 :4314–4319. doi:https://doi.org/10.1073/pnas.0400230101
46. Sanai N, Nguyen T, Ihrie RA, Mirzadeh Z, Tsai HH, Wong M et al (2011) Corridors of migrating neurons in the human brain and their decline during infancy. Nature 478:382–386.https://doi.org/10.1038/nature10487 47. Sanai N, Tramontin AD, Quiñones-Hinojosa A, Barbaro NM, Gupta N, Kunwar
S et al (2004) Unique astrocyte ribbon in adult human brain contains neural stem cells but lacks chain migration. Nature 427:740–744.https://doi.org/10. 1038/nature02301
48. Scott CE, Wynn SL, Sesay A, Cruz C, Cheung M, Gomez Gaviro MV et al (2010) SOX9 induces and maintains neural stem cells. Nat Neurosci 13: 1181–1189.https://doi.org/10.1038/nn.2646
49. Shin J, Berg DA, Zhu Y, Shin JY, Song J, Bonaguidi MA et al (2015) Single-cell RNA-seq with waterfall reveals molecular cascades underlying adult neurogenesis. Cell Stem Cell 17:360–372.https://doi.org/10.1016/j. stem.2015.07.013
50. Spalding KL, Bergmann O, Alkass K, Bernard S, Salehpour M, Huttner HB et al (2013) Dynamics of hippocampal neurogenesis in adult humans. Cell 153: 1219–1227.https://doi.org/10.1016/j.cell.2013.05.002
51. Sveinbjornsdottir S (2016) The clinical symptoms of Parkinson’s disease. J Neurochem:318–324.https://doi.org/10.1111/jnc.13691
52. van den Berge SA, Middeldorp J, Eleana Zhang C, Curtis MA, Leonard BW, Mastroeni D et al (2010) Longterm quiescent cells in the aged human subventricular neurogenic system specifically express GFAP-δ. Aging Cell 9: 313–326.https://doi.org/10.1111/j.1474-9726.2010.00556.x
53. van den Berge SA, van Strien ME, Hol EM (2013) Resident adult neural stem cells in Parkinson’s disease-the brain’s own repair system? Eur J Pharmacol 719:117–127.https://doi.org/10.1016/j.ejphar.2013.04.058
54. van den Berge SA, van Strien ME, Korecka JA, Dijkstra AA, Sluijs JA, Kooijman L et al (2011) The proliferative capacity of the subventricular zone is maintained in the parkinsonian brain. Brain 134:3249–3263.https://doi.org/ 10.1093/brain/awr256
55. van Strien ME, Sluijs JA, Reynolds BA, Steindler DA, Aronica E, Hol EM (2014) Isolation of neural progenitor cells from the human adult subventricular zone based on expression of the cell surface marker CD271. Stem Cells Transl Med 3:470–480.https://doi.org/10.5966/sctm.2013-0038 56. Winner B, Desplats P, Hagl C, Klucken J, Aigner R, Ploetz S et al (2009)
Dopamine receptor activation promotes adult neurogenesis in an acute Parkinson model. Exp Neurol 219:543–552.https://doi.org/10.1016/j. expneurol.2009.07.013
57. Wu YE, Pan L, Zuo Y, Li X, Hong W (2017) Detecting activated cell populations using single-cell RNA-seq. Neuron 96:1–27.https://doi.org/10. 1016/j.neuron.2017.09.026