R E S E A R C H
Open Access
Distinct white matter microstructural
abnormalities and extracellular water
increases relate to cognitive impairment in
Alzheimer
’
s disease with and without
cerebrovascular disease
Fang Ji
1, Ofer Pasternak
2,3, Siwei Liu
1, Yng Miin Loke
1, Boon Linn Choo
1, Saima Hilal
4,5, Xin Xu
4,5,
Mohammad Kamran Ikram
4,5, Narayanaswamy Venketasubramanian
6, Christopher Li-Hsian Chen
4,5and Juan Zhou
1,7*Abstract
Background:Mixed vascular and neurodegenerative dementia, such as Alzheimer’s disease (AD) with concomitant cerebrovascular disease, has emerged as the leading cause of age-related cognitive impairment. The brain white matter (WM) microstructural changes in neurodegeneration well-documented by diffusion tensor imaging (DTI) can originate from brain tissue or extracellular free water changes. The differential microstructural and free water changes in AD with and without cerebrovascular disease, especially in normal-appearing WM, remain largely unknown. To cover these gaps, we aimed to characterize the WM free water and tissue microstructural changes in AD and mixed dementia as well as their associations with cognition using a novel free water imaging method.
Methods:We compared WM free water and free water-corrected DTI measures as well as white matter hyperintensity (WMH) in patients with AD with and without cerebrovascular disease, patients with vascular dementia, and age-matched healthy control subjects.
Results:The cerebrovascular disease groups had higher free water than the non-cerebrovascular disease groups. Importantly, besides the cerebrovascular disease groups, patients with AD without cerebrovascular disease also had increased free water in normal-appearing WM compared with healthy control subjects, reflecting mild vascular damage. Such free water increases in WM or normal-appearing WM (but not WMH) contributed to dementia severity. Whole-brain voxel-wise analysis revealed a close association between widespread free water increases and poorer attention, executive functioning, visual construction, and motor performance, whereas only left hemispheric free water increases were related to language deficits. Moreover, compared with the original DTI metrics, the free water-corrected DTI metric revealed tissue damage-specific (frontal and occipital) microstructural differences between the cerebrovascular disease and non-cerebrovascular disease groups. In contrast to both lobar and subcortical/brainstem free water increases, only focal lobar microstructural damage was associated with poorer cognitive performance.
(Continued on next page)
* Correspondence:[email protected]
1Center for Cognitive Neuroscience, Neuroscience and Behavioral Disorders
Program, Duke-NUS Medical School, 8 College Road, 06-15, Singapore 169857, Singapore
7Clinical Imaging Research Centre, Agency for Science, Technology and
Research, Singapore, Singapore
Full list of author information is available at the end of the article
(Continued from previous page)
Conclusions:Our findings suggest that free water analysis isolates probable mild vascular damage from WM microstructural alterations and underscore the importance of normal-appearing WM changes underlying cognitive and functional impairment in AD with and without cerebrovascular disease. Further developed, the combined free water and tissue neuroimaging assays could help in differential diagnosis, treatment planning, and disease monitoring of patients with mixed dementia.
Keywords:Alzheimer’s disease, Cerebrovascular disease, Diffusion tensor imaging, Free water imaging, Extracellular water, Vascular damage, Cognitive impairment
Background
Mixed vascular and neurodegenerative dementia such as patients with Alzheimer’s disease (AD) with concomitant cerebrovascular disease (CeVD) has emerged as the lead-ing cause of age-related cognitive impairment [1]. Accu-mulating evidence suggests that AD and CeVD share multiple risk factors and overlap neuropathologically, leading to additive or synergistic effects on cognitive de-cline [2]. White matter hyperintensity (WMH), which is associated with increased water content and vascular changes [3], serves as an important clinical diagnostic criterion by which to identify CeVD status [4]. WMH may be due to vessel disease causing infarction or a failure in the clearance of interstitial fluid from white matter (WM), which is associated with blood-brain barrier (BBB) permeability modulation [5]. However, WMH visual rating suffers from interrater variability. More importantly, WMH usually reflects a severe water increase such as edema. It is not sensitive to detection of changes, owing to small vessel damage and inflammation, particularly in normal-appearing WM [6, 7], which might exacerbate neurological dysfunction and brain damage in dementia.
It is thus important to isolate WM degeneration and vascular changes in mixed vascular and neurodegenera-tive dementia. Diffusion-weighted magnetic resonance imaging (MRI) has been used to examine WM micro-structural alterations in dementia [8]. However, the con-ventional diffusion tensor imaging (DTI) indices, such as fractional anisotropy (FA) or axonal diffusivity (DA), provide inconsistent findings [7, 8], partly because changes in these indices stem from both tissue degeneration (i.e., axonal damage and demyelination) [9] and excessive extracellular fluid [10, 11]. Recently, the free water (FW) imaging method for obtaining diffusion-weighted MRI data has been proposed to correct each voxel for contam-ination from freely diffusing extracellular water molecules [12]. The resulting fractional volume of the FW compart-ment estimates the extracellular water content, and the FW-corrected DTI metrics represent microstructural tis-sue changes [13]. Compared with WMH, voxel-based FW increases may be more sensitive to mild vascular problems in normal-appearing tissue, including neuroinflammation and BBB permeability modulation [6].
In the context of mixed vascular and neurodegenera-tive dementia, it is difficult to define which neuropatho-logical changes contribute to cognitive decline, as well as the degree to which these changes contribute to cogni-tive decline, because of the heterogeneous localization of lesions and the coexistence of multiple pathologies [14]. Although the FW imaging method has revealed whole-brain FW increases in AD and mild cognitive impair-ment (MCI) [15–17], there is a lack of understanding of the differential patterns of FW increases, especially in the normal-appearing WM, as well as microstructural changes in AD with and without CeVD. In the present study, we examined extracellular and tissue-related WM abnormalities separately in a cohort of patients with AD without CeVD (AD), AD with CeVD (AD + CeVD), and vascular dementia (VaD) using the FW imaging method. We hypothesized that patients with AD + CeVD would have higher FW values and more tissue disruption (par-ticularly in the frontal lobe) than patients with AD because of synergistic effects. Patients with AD would have greater FW in the normal-appearing WM than age-matched healthy control subjects (HC), even though their WMH burden is comparable. Last, we assessed whether and how FW increases and tissue compartment alterations contrib-ute to symptom severity and cognitive impairment.
Methods
Participants
All patients were recruited from the National University Hospital of Singapore as described in our previous work [18]. The HC group was recruited from the community. The detailed diagnostic criteria for AD, AD + CeVD, and VaD, as well as the inclusion/exclusion criteria for the HC group, are provided in Additional file 1. Psychologists evaluated each participant with extensive clinical and neuropsychological evaluation (seeour previous work [19] and Additional file 1: Supplementary Methods).
and 30 HC without CeVD) was included for analyses (Table 1) (Additional file 1: Figure S7). Patients who completed cognitive assessments were included in brain-cognition association analyses (Table 1).
Image acquisition
Each subject underwent MRI scanning at the Clinical Im-aging Research Centre, National University of Singapore (3-T MAGNETOM Trio™, A Tim® System; Siemens, Germany). High-resolution T1-weighted structural MRI scans were acquired using a magnetization-prepared rapid gradient-echo sequence (192 continuous sagittal slices, repetition time [TR]/echo time [TE]/inversion time [TI] 2300/1.9/900 milliseconds, flip angle 9 degrees, field of view [FOV] 256 × 256 mm2, matrix 256 × 256, isotropic voxel size 1.0 × 1.0 × 1.0 mm3, bandwidth 240 Hz/pixel). FLAIR images were also acquired (TR 11,000 milliseconds, TE 125 milliseconds, TI 2800 milli-seconds, sensitivity encoding factor 1.5, voxel size 1.02 × 1.02 mm2, 60 slices, slice thickness 2.5 mm).
Diffusion-weighted MRI was performed using a single-shot fast-spin echo planar imaging sequence (TR 6800 millisec-onds, slices 48, thickness 3.0 mm, FOV 256 × 256 mm2, voxel size 3 mm3, bvalue 1150 seconds/mm2, 61 diffu-sion directions, 7 b0).
DTI image processing
The DTI data were preprocessed following our previ-ously described methods [20, 21] using the FSL tool li-brary (http://www.fmrib.ox.ac.uk/fsl) (Additional file 1: Figure S1, step 1a). Head movements and eddy current distortions were corrected via affine registration of the DTI image to the firstb= 0 volume. Data were discarded when the maximum displacement was greater than 3 mm. The diffusion gradients were rotated to compen-sate for the registration. Individual maps were visually inspected for signal dropout and artifacts. DTI index im-ages, including FA, radial diffusivity (DR), and DA, were created by fitting the diffusion tensor model to each voxel. We subsequently used tract-based spatial statistics
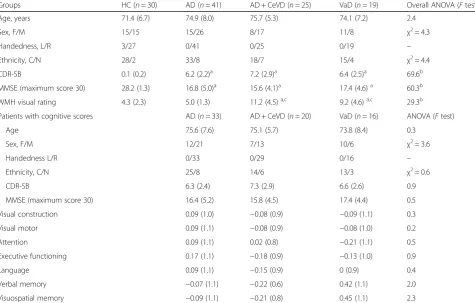
Table 1Subjects’clinical and demographic features
Groups HC (n= 30) AD (n= 41) AD + CeVD (n= 25) VaD (n= 19) Overall ANOVA (Ftest)
Age, years 71.4 (6.7) 74.9 (8.0) 75.7 (5.3) 74.1 (7.2) 2.4
Sex, F/M 15/15 15/26 8/17 11/8 χ2= 4.3
Handedness, L/R 3/27 0/41 0/25 0/19 –
Ethnicity, C/N 28/2 33/8 18/7 15/4 χ2= 4.4
CDR-SB 0.1 (0.2) 6.2 (2.2)a 7.2 (2.9)a 6.4 (2.5)a 69.6b
MMSE (maximum score 30) 28.2 (1.3) 16.8 (5.0)a 15.6 (4.1)a 17.4 (4.6)a 60.3b
WMH visual rating 4.3 (2.3) 5.0 (1.3) 11.2 (4.5)a,c 9.2 (4.6)a,c 29.3b
Patients with cognitive scores AD (n= 33) AD + CeVD (n= 20) VaD (n= 16) ANOVA (Ftest)
Age 75.6 (7.6) 75.1 (5.7) 73.8 (8.4) 0.3
Sex, F/M 12/21 7/13 10/6 χ2= 3.6
Handedness L/R 0/33 0/29 0/16 –
Ethnicity, C/N 25/8 14/6 13/3 χ2= 0.6
CDR-SB 6.3 (2.4) 7.3 (2.9) 6.6 (2.6) 0.9
MMSE (maximum score 30) 16.4 (5.2) 15.8 (4.5) 17.4 (4.4) 0.5
Visual construction 0.09 (1.0) −0.08 (0.9) −0.09 (1.1) 0.3
Visual motor 0.09 (1.1) −0.08 (0.9) −0.08 (1.0) 0.2
Attention 0.09 (1.1) 0.02 (0.8) −0.21 (1.1) 0.5
Executive functioning 0.17 (1.1) −0.18 (0.9) −0.13 (1.0) 0.9
Language 0.09 (1.1) −0.15 (0.9) 0 (0.9) 0.4
Verbal memory −0.07 (1.1) −0.22 (0.6) 0.42 (1.1) 2.0
Visuospatial memory −0.09 (1.1) −0.21 (0.8) 0.45 (1.1) 2.3
Abbreviations: ADAlzheimer’s disease,AD + CeVDAlzheimer’s disease with cerebrovascular disease,ANOVAAnalysis of variance,C/NChinese/non-Chinese,CDR-SB Clinical Dementia Rating Sum of Boxes,HCHealthy control subjects,MMSEMini Mental State Examination,VaDVascular dementia,WMHWhite
matter hyperintensity
Values represent mean (SD). The WMH visual rating was measured by the age-related WM change scale score. A subset of patients with complete cognitive scores was used for brain-cognition association analyses
a
Group mean was different from HC on the basis of post hoc pairwise comparisons (p< 0.05)
b
Group differences atp< 0.05 significance level
c
[22] to carry out a whole-brain voxel-wise analysis within the major WM pathways. The FA images were first nonlinearly registered to the high-resolution FMRIB58_FA image and subsequently skeletonized. The subject-level skeletonized DA and DR images were derived by projecting onto the same skeleton [21] (Additional file 1: Supplementary Methods, Figure S1, step 1a).
WMH quantification
We performed WMH segmentation on FLAIR images using an automated procedure [23] (Additional file 1: Supplementary Methods, Figure S1, step 1c). We defined the WMH ratio as the total number of identified WMH voxels divided by the total white matter volume (WMV).
FW imaging method
We employed the FW imaging method, which fits the eddy current-corrected DTI in each voxel to a two-compartment model (i.e., separating an FW compart-ment from the FW-corrected DTI tissue compartcompart-ment) [12] (Additional file 1: Figure S1, step 1b). Briefly, the FW compartment models water molecules that are free to diffuse and are not restricted or hindered during the diffusion experiment. Because of the fast diffusivity and short diffusion time, FW molecules are expected only at large-enough extracellular spaces. This FW compart-ment has a fixed diffusivity of 3 × 10⁻³mm2/second (the diffusion coefficient of the FW at body temperature). The fractional volume of this compartment in each voxel forms the FW map. The FW-corrected DTI compart-ment models water molecules in the proximity of the cellular membranes of brain tissues using a diffusion tensor, which is corrected for contamination by freely diffusing extracellular water, and it is thus expected to be more sensitive and more specific to axonal and mye-lination changes than the original DTI measures [24]. In-house MATLAB (MathWorks, Natick, MA, USA) scripts were developed for the FW analysis following our previous approaches [13, 25].
Individual voxel-wise FW and FW-corrected tissue compartment DTI maps (free water-corrected frac-tional anisotropy [FAT], free water-corrected axial
diffu-sivity [DAT], and free water-corrected radial diffusivity
[DRT]) were aligned to a standard template and
pro-jected onto the standardized FA skeleton, resulting in subject-level skeletonized images [12]. Boundary-based registration [22] was used to register individual FLAIR maps onto the DTI space. Then, both FLAIR-based WMH lesion masks and FW maps were normalized to the Montreal Neurological Institute standard space on the basis of transformations derived from FA maps. Mean FW values in the whole WM skeleton and the normal-appearing WM regions were derived (Additional file 1: Figure S1, step 3).
Statistical analyses
Group comparisons of WM abnormalities
To assess group differences in WMH ratios and mean WM FW values (Additional file 1: Figure S1, step 2), we performed analysis of variance followed by post hoc pairwise group comparisons using Tukey’s test. To assess region-specific group differences in the WM indices (including FW values, original DTI indices, and FW-corrected DTI indices), following tract-based spatial statistics, we constructed voxel-wise generalized linear models (GLMs) with skeletonized WM index maps as the dependent variable; group as the independent variable; and age, sex, handedness, and ethnicity as covariates. Group differences were identified through permutation-based nonparametric testing (FSL randomise) (thre-sholded atp< 0.01, threshold-free cluster enhancement [TFCE], and family-wise error [FWE] correction [26]). Anatomical localization was determined with reference to the Johns Hopkins University WM atlas [27].
Associations between WM measures and dementia severity
We calculated the associations of Clinical Dementia Rat-ing Sum of Boxes (CDR-SB) scores with mean FW values in WM or normal-appearing WM as well as DTI metrics across all patients using Pearson’s correlations (Additional file 1: Figures S1, step 4). Spearman’s correla-tions were used to test if WMH ratio was related to demen-tia severity (Additional file 1: Supplementary Methods).
Associations between WM measures and cognitive impairment
Pearson’s correlations were calculated between general cognitive performance (Mini Mental State Examination scores) and mean FW in WM or normal-appearing WM across all patients (Additional file 1: Figure S1, step 6). To assess region-specific WM changes underlying cogni-tive impairment across all patients, we built GLMs (FSL randomise) with the skeletonized FW and FATimages as
the dependent variables and domain-specific cognitive z-scores as the independent variables (p< 0.01 with TFCE and FWE correction). In all brain-behavior association analyses, age, sex, and ethnicity were included as nuisance variables (handedness was excluded because all patients were right-handed).
Results
Group differences in FW
and Additional file 1: Figure S3, Table S1). As expected, the patients with AD had higher FW than the HC in most WM regions, except in the occipital fibers (Fig. 1c and Additional file 1: Figure S2, Table S1), in contrast to the similar WMH ratios between the patients with AD and HC.
More important, patients with AD + CeVD and pa-tients with VaD had greater mean FW in the normal-appearing WM than patients with AD and HC. Patients with AD had higher FW in the normal-appearing WM than HC (Fig. 1b). Patients with AD + CeVD and patients with VaD did not differ in their WMH ratios or FW values. To minimize the concern that FW can be affected by brain volume changes, we repeated the analyses, con-trolling for the total WMV. Most of the group differences remained (Additional file 1: Table S1).
FW increases correlated with symptom severity
We identified a strong correlation between the mean FW values (averaged across WM skeleton) and dementia severity across all patients; that is, increased FW was related to higher CDR-SB scores (r= 0.38, p< 0.001) (Fig. 2b). The association remained after controlling for WMV (r= 0.34, p= 0.012). Similar associations were found within the AD (r= 0.41, p= 0.008) and AD +
CeVD (r= 0.47,p= 0.017) groups, but not for the VaD group (r= 0.31,p= 0.18).
Further, the increased FW in normal-appearing WM was related to higher CDR-SB scores across all patients (r= 0.34, p= 0.017) (Fig. 2c). The association remained after controlling for WMV (r= 0.29, p= 0.018). The associations were found within the AD group (r= 0.39, p= 0.011), but not for the AD + CeVD (r= 0.26,p= 0.21) or VaD groups (r= 0.34, p= 0.16). In contrast, the WMH ratio was not associated with dementia severity (Fig. 2a).
Abnormalities in original and FW-corrected DTI metrics
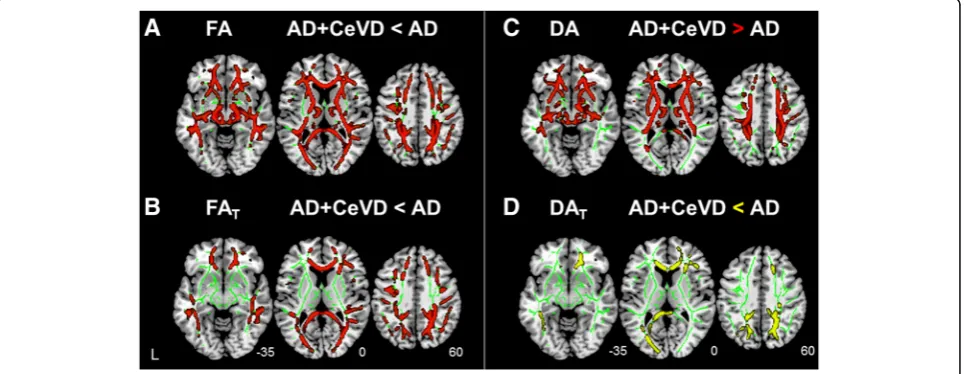
On the basis of conventional DTI metrics, patients with AD + CeVD and patients with VaD had widespread WM FA reductions in both lobar and subcortical regions com-pared with patients with AD (Fig. 3a and Additional file 1: Figure S4A and Table S2). Nevertheless, the FW-corrected tissue compartment analyses showed that patients with AD + CeVD and patients with VaD had only lobar FAT
re-ductions, in contrast to patients with AD (less extensive than the original metrics), sparing the subcortical and brainstem regions (Fig. 3b and Additional file 1: Figure S4B and Table S2). There was no difference in FA or FAT
between the AD + CeVD and VaD groups.
Fig. 1Increased free water (FW) in normal-appearing white matter (WM) regions in patients with Alzheimer’s disease (AD) compared with healthy
control subjects (HC).aOnly patients AD and cerebrovascular disease (AD + CeVD) and patients with vascular dementia (VaD) had higher white matter hyperintensity (WMH) ratios than the patients with AD (##) and HC (**), but patients with AD without CeVD did not differ from HC.b
Compared with HC, all three dementia subtypes had re-duced FA (Additional file 1: Figure S5A,red, and Table S2). None of the areas had increased FA in patients compared with HC. A further analysis of the FW-corrected tissue compartments showed that the FATchanges in the three
dementia subgroups became less extensive than the original DTI results compared with the HC. Specifically, several subcortical and brainstem fibers no longer exhibited WM microstructural damage in patients compared with HC (Additional file 1: Figure S5A,yellow, and Table S2).
Interestingly, on the basis of conventional DTI met-rics, patients with AD + CeVD and patients with VaD
had higher DA values than patients with AD, particularly in the frontal-subcortical and brainstem regions (Fig. 3c and Additional file 1: Figure S4C and Table S3). In con-trast, after FW correction, patients with AD + CeVD and patients with VaD had lower DAT values than patients
with AD in the frontal and occipital regions; the subcor-tical and brainstem fibers no longer exhibited any DAT
group differences (Fig. 3d and Additional file 1: Figure S4D and Table S3). Again, there was no difference in DA/DATbetween the AD + CeVD and VaD groups.
All three dementia subtypes had increased DA com-pared with HC in the temporal and subcortical regions
Fig. 2Free water (FW) increases are associated with dementia severity.aThere was no association between white matter hyperintensity (WMH)
and Clinical Dementia Rating Sum of Boxes (CDR-SB) score.bIncreased FW values across all white matter (WM) regions was related to increased CDR-SB scores across all patients.cIncreased FW values in the normal-appearing WM were related to increased CDR-SB scores across all patients.
CeVDCerebrovascular disease,VaDVascular dementia
Fig. 3Free water (FW)-corrected measures revealed more lobar white matter (WM) tissue-related microstructural damage in patients with Alzheimer’s
and parts of the frontal and parietal lobes (Additional file 1: Figure S5B,red, and Table S3). None of the areas had reduced DA in patients compared with HC. In con-trast, after FW correction, DAT in the frontal, parietal,
and occipital lobes was decreased for all three patient groups compared with HC (Additional file 1: Figure S5B, green, and Table S3). None of the areas had increased DAT in the patients. The differences between the DR
and DRT patterns are described in Additional file 1:
Supplementary Results.
Correlations between WM abnormalities and cognitive performance
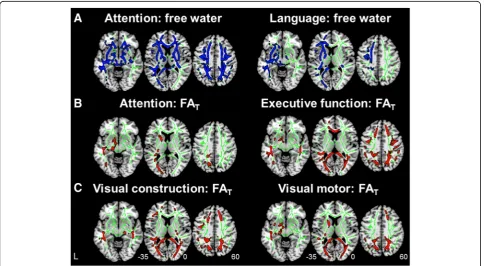
The whole-brain voxel-wise GLM analyses revealed that higher FW values in nearly all WM regions were associated with poorer executive functioning, visual construction, and visuomotor performance (Additional file 1: Table S5). Attention was negatively correlated with the FW values in most WM fibers, except the right occipital and tem-poral regions, whereas lower language performance was associated with higher FW values in the left hemisphere (Fig. 4a). Similar findings were observed after controlling for WMV (Additional file 1: Table S5).
In contrast to the widespread patterns in FW-cognition associations, the FW-corrected tissue compartment had region-selective associations with cognitive performance. Specifically, attention decline was associated with reduced FATin the left hemisphere only (including the middle
par-ietal, occipital, callosal, and subcortical fibers) (Fig. 4b and Additional file 1: Table S5). Executive dysfunction was related to lower FAT in the bilateral frontal, parietal, and
occipital fibers (Fig. 4b and Additional file 1: Table S5). Visual construction impairment was related to lower FAT
in the frontal, parietal, and occipital regions, whereas visuomotor deficits were related to lower FAT mostly
in the occipital and subcortical regions (Fig. 4c and Additional file 1: Table S5).
Interestingly, increased FW in brainstem fibers was as-sociated with all domains of cognitive dysfunction, but decreased FAT in the brainstem regions was not. There
were no associations of FW/FAT with memory
perform-ance due to the flooring effect, because most patients with dementia had severe memory deficits. The associa-tions between the FW and DTI metrics and the general cognitive measures are described in Additional file 1: Supplementary Results.
Fig. 4Free water (FW) increases and FW-corrected tissue compartment deterioration correlated with cognitive deficits.aWhole-brain voxel-wise
Discussion
Our findings provide new insights into differential WM microstructural and FW alterations in normal-appearing tissue in mixed vascular and neurodegenerative demen-tia. All patients, including patients with AD without CeVD, had increased FW compared with HC. Import-antly, increased FW was detected in normal-appearing WM regions in patients with AD, reflecting mild vascu-lar changes. Widespread FW increases in the whole WM and normal-appearing WM (but not the WMH ratio) were associated with symptom severity. Both lobar and subcortical FW increases were associated with poorer cognitive performance, such as in attention and executive functioning, whereas only left hemi-spheric FW increases were related to language deficits. In parallel, compared with the original DTI metrics, which might overestimate axonal damage or demyelin-ation, the FW-corrected tissue compartment had better clinical specificity because it showed tissue-specific microstructural differences between the CeVD and non-CeVD groups. In addition, these region-specific tissue changes were associated with poorer cognitive performance. Our findings underscore the value of FW corrections in isolating vascular damage from WM microstructural alterations and help connect both extracellular FW and microstructural abnormalities with cognitive impairment in mixed vascular and neu-rodegenerative dementia.
As far as we know, this is the first study demonstrating that the FW measure is sensitive to vascular changes be-cause it successfully distinguished the non-CeVD from the CeVD groups, corresponding well with their WMH ratio differences. Moreover, we further demonstrate that patients with AD had widespread FW increases com-pared with HC, particularly in the normal-appearing WM. Previous studies showed similar FW increases in AD [15], but they did not reveal whether the FW in-crease is due to WM lesions or to changes in the normal-appearing WM. Our findings of increased FW in normal-appearing WM in the AD without CeVD group suggest mild vascular damage that may be due to micro-vascular degeneration [28] and neuroinflammation-related BBB permeability modulation [29] in normal-looking WM tissue in AD. Both imaging and postmor-tem studies have indicated that vascular pathology exists in AD [2, 29]. Deposition of amyloid-β(Aβ) might lead to vascular problems such as BBB breakdown and neu-rovascular regulation impairment. The pathogenic chain of these vascular effects, in a vicious cycle, produces fur-ther Aβdeposition and neurofibrillary tangle formation. Together, these pathological factors may contribute to the later development of neurodegeneration and cogni-tive decline in AD [30]. Other possible causes of FW increases might include abnormally low cell density, low
dendrite number and volume, and WM degeneration [25, 31–34]. However, group differences in FW remained after controlling for the total WMV.
Critically, the mean FW value, both across the whole WM and in the normal-appearing WM, was associated with symptom severity, whereas the WMH ratio was not. Although both WMH and FW reflect accumulating water within the WM [5, 12], WMH reflects only severe water increases such as edema [6]. Mild increases in FLAIR image contrast may be hard to identify. Further, the segmented WMH is often surrounded by a penum-bra of subtly injured tissue with mild water content in-creases. These changes cannot be accurately quantified by the WMH volume [35]. In contrast, our findings sug-gest that the FW metric can detect these mild water content increases in a voxel-based manner, which might contribute to the etiology of AD [36]. Therefore, the FW compartment provides a more sensitive way of detecting mild vascular changes in normal-appearing WM regions in dementia, which could potentially help in differential diagnosis and neuropathological understanding of mixed vascular and neurodegenerative dementia.
The second important finding is that the FW-corrected DTI metrics revealed region-specific WM microstructural differences between the CeVD and non-CeVD dementia groups. CeVD-related axonal damage and demyelination have been reported in postmortem studies [37]. However, recent data suggest that DTI-based metrics may not correspond well with the axonal pathology measured in patients with CeVD [38]. This is in line with our observations that the original DTI metrics identified nonspecific and global WM microstructural differences between the CeVD and non-CeVD groups. Increases in the FW compartment could mask the true alterations in WM fibers [16] (i.e., loss of oligodendrocytes, myelin sheaths, axons, and neurons) and could even overesti-mate tissue damage, particularly in the subcortical and brainstem regions [24]. Therefore, on the basis of FW-corrected DTI metrics, the patients with AD + CeVD had more focal lobar damage (FAT decrease and DRT
increase) in the occipital and frontal lobes than the patients with AD. Moreover, in previous DTI studies, researchers reported inconsistent DA changes (both in-creases and dein-creases) in patients with AD and patients with MCI compared with control subjects [8, 9]. This inconsistency is partly due to the fact that increased extracellular fluid may lead to increased DA [10, 11]. Using the FW correction method, we confirmed lower DAT in patients with dementia than in HC as well as
lower DAT in the frontal and occipital regions in the
The next question is whether and how FW and tissue compartment changes contribute to cognitive impair-ment. A recent study illustrated that FW was associated with cognitive performance in Parkinson’s disease [39]. Only two studies showed associations between tissue compartment changes and cognition in predefined re-gions in MCI: Tissue fraction in the parahippocampal cingulum was associated with memory decline [17], and tissue compartment measures in the anterior cingulum were associated with cognitive control [40]. We found a region-specific influence of extracellular and micro-structural changes on cognitive decline across patients with AD with and without CeVD using a whole-brain search. Widespread FW increases (both lobar and subcortical/brainstem) appear to be related to poor cognitive performance, particularly executive function-ing, attention, visuomotor performance, and visual con-struction. Moreover, consistent with the literature regarding a dominant role of the left hemisphere in lan-guage [41], only left hemispheric FW increases (but not tissue damage) were related to language deficits. In contrast, only focal lobar FW-corrected WM micro-structural damage was associated with each cognitive domain, suggesting distinct default mode and executive control network disruptions in non-CeVD [42, 43] and CeVD groups [44]. Such differential associations of vas-cular and WM microstructure with cognition reveal the possible neural mechanism in patients with mixed vas-cular and neural degeneration.
Some limitations of the study should be noted. The possible influence of WM degeneration on FW increases could not be completely excluded [34]. However, to mitigate this concern, we controlled for total WMV in the FW analyses, and the results remained. In addition, we did not examine amyloid deposition in our patients. Diagnoses of AD and VaD based on conventional clinical criteria may lead to heterogeneous groups with overlap-ping pathologies.
Conclusions
We have demonstrated the importance of FW analysis in separating vascular-related extracellular FW in-creases and WM microstructural disruptions in mixed vascular and neurodegenerative dementia. Import-antly, these FW increases in normal-appearing WM contribute to dementia severity and cognitive deficits. Future longitudinal studies on preclinical AD with and without CeVD are needed to examine the early changes, temporal trajectories, and possible interplay between vascular and tissue abnormalities. Further developed, the combined FW and tissue assays could help in the differential diagnosis, individual treatment planning, and disease monitoring for patients with mixed dementia.
Additional file
Additional file 1:Supplementary methods, results, tables, and figures.
(DOCX 4194 kb)
Abbreviations
Aβ:Amyloid-β; AD: Alzheimer’s disease; AD + CeVD: Alzheimer’s disease with cerebrovascular disease; ANOVA: Analysis of variance; BBB: Blood-brain barrier; CDR-SB: Clinical Dementia Rating Sum of Boxes; CeVD: Cerebrovascular disease; C/N: Chinese/non-Chinese; DA: Axial diffusivity; DAT: Free water-corrected axial
diffusivity; DR: Radial diffusivity; DRT: Free water-corrected radial diffusivity;
DTI: Diffusion tensor imaging; FA: Fractional anisotropy; FAT: Free
water-corrected fractional anisotropy; FLAIR: Fluid-attenuated inversion recovery; FOV: Field of view; FW: Free water; FWE: Family-wise error; GLM: Generalized linear model; HC: Healthy control subjects; MCI: Mild cognitive impairment; MMSE: Mini Mental State Examination; MRI: Magnetic resonance imaging; TE: Echo time; TFCE: Threshold-free cluster enhancement; TI: Inversion time; TR: Repetition time; VaD: Vascular dementia; WM: White matter; WMH: White matter hyperintensity; WMV: White matter volume
Acknowledgements
None.
Funding
This work was funded by the National Medical Research Council (NMRC/CG/ 013/2013, NMRC/CG/NUHS/2010, NMRC/CBRG/0088/2015); the Biomedical Research Council (BMRC04/1/36/372); Duke-NUS Medical School, Singapore; and the National Institutes of Health (01MH108574, R01 AG042512, P41EB015902).
Availability of data and materials
The datasets used and/or analyzed during the present study are available from the corresponding author on reasonable request.
Authors’contributions
FJ and JZ designed the study. CLHC, SH, XX, MKI, and NV contributed to the data collection. FJ, JZ, YML, BLC, and SL performed the data analysis. FJ, JZ, OP, SH, SL, and CLHC interpreted the data and wrote the manuscript. All authors read and approved the final manuscript.
Ethics approval and consent to participate
This study was conducted in accordance with the Declaration of Helsinki, and written informed consent was obtained from both the patients and the patients’caregivers. Ethics approval was granted by the National Healthcare Group Review Board of Singapore (NUHS1288/2010).
Consent for publication
Not applicable.
Competing interests
The authors declare that they have no competing interests.
Publisher’s Note
Springer Nature remains neutral with regard to jurisdictional claims in published maps and institutional affiliations.
Author details
1
Center for Cognitive Neuroscience, Neuroscience and Behavioral Disorders Program, Duke-NUS Medical School, 8 College Road, 06-15, Singapore 169857, Singapore.2Department of Psychiatry, Brigham and Women’s
Hospital, Harvard Medical School, Boston, MA, USA.3Department of
Radiology, Brigham and Women’s Hospital, Harvard Medical School, Boston, MA, USA.4Department of Pharmacology, Clinical Research Centre, National
University Health System, National University of Singapore, Singapore 117600, Singapore.5Memory Aging & Cognition Centre, National University
Health System, National University of Singapore, Singapore, Singapore.
6Raffles Neuroscience Centre, Raffles Hospital, Singapore, Singapore.7Clinical
Received: 24 March 2017 Accepted: 24 July 2017
References
1. Chen C, Homma A, Mok VC, Krishnamoorthy E, Alladi S, Meguro K, et al. Alzheimer’s disease with cerebrovascular disease: current status in the Asia-Pacific region. J Intern Med. 2016;280:359–74.
2. Iadecola C. The overlap between neurodegenerative and vascular factors in the pathogenesis of dementia. Acta Neuropathol. 2010;120:287–96. 3. Wardlaw JM, Allerhand M, Doubal FN, Valdes Hernandez M, Morris Z, Gow
AJ, et al. Vascular risk factors, large-artery atheroma, and brain white matter hyperintensities. Neurology. 2014;82:1331–8.
4. Attems J, Jellinger KA. The overlap between vascular disease and Alzheimer’s disease–lessons from pathology. BMC Med. 2014;12:206. 5. Weller RO, Hawkes CA, Kalaria RN, Werring DJ, Carare RO. White matter
changes in dementia: role of impaired drainage of interstitial fluid. Brain Pathol. 2015;25:63–78.
6. Pasternak O, Kubicki M, Shenton ME. In vivo imaging of neuroinflammation in schizophrenia. Schizophr Res. 2016;173:200–12.
7. Huang J, Friedland RP, Auchus AP. Diffusion tensor imaging of normal-appearing white matter in mild cognitive impairment and early Alzheimer disease: preliminary evidence of axonal degeneration in the temporal lobe. AJNR Am J Neuroradiol. 2007;28:1943–8.
8. Acosta-Cabronero J, Williams GB, Pengas G, Nestor PJ. Absolute diffusivities define the landscape of white matter degeneration in Alzheimer’s disease. Brain. 2010;133:529–39.
9. Bosch B, Arenaza-Urquijo EM, Rami L, Sala-Llonch R, Junque C, Sole-Padulles C, et al. Multiple DTI index analysis in normal aging, amnestic MCI and AD: relationship with neuropsychological performance. Neurobiol Aging. 2012;33:61–74.
10. Hui ES, Russell Glenn G, Helpern JA, Jensen JH. Kurtosis analysis of neural diffusion organization. Neuroimage. 2015;106:391–403.
11. O’Dwyer L, Lamberton F, Bokde ALW, Ewers M, Faluyi YO, Tanner C, et al. Multiple indices of diffusion identifies white matter damage in mild cognitive impairment and Alzheimer’s disease. PLoS One. 2011;6:e21745.
12. Pasternak O, Sochen N, Gur Y, Intrator N, Assaf Y. Free water elimination and mapping from diffusion MRI. Magn Reson Med. 2009;62:717–30.
13. Pasternak O, Westin CF, Dahlben B, Bouix S, Kubicki M. The extent of diffusion MRI markers of neuroinflammation and white matter deterioration in chronic schizophrenia. Schizophr Res. 2015;161:113–8.
14. Kalaria RN. Neuropathological diagnosis of vascular cognitive impairment and vascular dementia with implications for Alzheimer’s disease. Acta Neuropathol. 2016;131:659–85.
15. Maier-Hein KH, Westin CF, Shenton ME, Weiner MW, Raj A, Thomann P, et al. Widespread white matter degeneration preceding the onset of dementia. Alzheimers Dement. 2015;11:485–93. e2.
16. Berlot R, Metzler-Baddeley C, Jones DK, O’Sullivan MJ. CSF contamination contributes to apparent microstructural alterations in mild cognitive impairment. Neuroimage. 2014;92:27–35.
17. Metzler-Baddeley C, Hunt S, Jones DK, Leemans A, Aggleton JP, O’Sullivan MJ. Temporal association tracts and the breakdown of episodic memory in mild cognitive impairment. Neurology. 2012;79:2233–40.
18. Qiu Y, Liu S, Hilal S, Loke YM, Ikram MK, Xu X, et al. Inter-hemispheric functional dysconnectivity mediates the association of corpus callosum degeneration with memory impairment in AD and amnestic MCI. Sci Rep. 2016;6:32573.
19. Hilal S, Tan CS, Xin X, Amin SM, Wong TY, Chen C, et al. Prevalence of cognitive impairment and dementia in Malays–Epidemiology of Dementia in Singapore Study. Curr Alzheimer Res. 2017;14:620–7.
20. Hong Z, Ng KK, Sim SK, Ngeow MY, Zheng H, Lo JC, et al. Differential age-dependent associations of gray matter volume and white matter integrity with processing speed in healthy older adults. Neuroimage. 2015;123:42–50. 21. Liu S, Ong YT, Hilal S, Loke YM, Wong TY, Chen CL, et al. The association
between retinal neuronal layer and brain structure is disrupted in patients with cognitive impairment and Alzheimer’s disease. J Alzheimers Dis. 2016;54:585–95.
22. Greve DN, Fischl B. Accurate and robust brain image alignment using boundary-based registration. Neuroimage. 2009;48:63–72.
23. Smart SD, Firbank MJ, O’Brien JT. Validation of automated white matter hyperintensity segmentation. J Aging Res. 2011;2011:391783.
24. Metzler-Baddeley C, O’Sullivan MJ, Bells S, Pasternak O, Jones DK. How and how not to correct for CSF-contamination in diffusion MRI. Neuroimage. 2012;59:1394–403.
25. Pasternak O, Westin CF, Bouix S, Seidman LJ, Goldstein JM, Woo TU, et al. Excessive extracellular volume reveals a neurodegenerative pattern in schizophrenia onset. J Neurosci. 2012;32:17365–72.
26. Smith SM, Nichols TE. Threshold-free cluster enhancement: addressing problems of smoothing, threshold dependence and localisation in cluster inference. Neuroimage. 2009;44:83–98.
27. Hua K, Zhang J, Wakana S, Jiang H, Li X, Reich DS, et al. Tract probability maps in stereotaxic spaces: analyses of white matter anatomy and tract-specific quantification. Neuroimage. 2008;39:336–47.
28. Sachdev PS, Zhuang L, Braidy N, Wen W. Is Alzheimer’s a disease of the white matter? Curr Opin Psychiatry. 2013;26:244–51.
29. Calsolaro V, Edison P. Neuroinflammation in Alzheimer’s disease: current evidence and future directions. Alzheimers Dement. 2016;12:719–32. 30. Love S, Miners JS. Cerebrovascular disease in ageing and Alzheimer’s
disease. Acta Neuropathol. 2016;131:645–58.
31. Lyall AE, Pasternak O, Robinson DG, Newell D, Trampush JW, Gallego JA, et al. Greater extracellular free-water in first-episode psychosis predicts better neurocognitive functioning. Mol Psychiatry. 2017. doi:10. 1038/mp.2017.43.
32. Selemon LD, Kleinman JE, Herman MM, Goldman-Rakic PS. Smaller frontal gray matter volume in postmortem schizophrenic brains. Am J Psychiatry. 2002;159:1983–91.
33. Segal D, Schmitz C, Hof PR. Spatial distribution and density of
oligodendrocytes in the cingulum bundle are unaltered in schizophrenia. Acta Neuropathol. 2009;117:385–94.
34. Maillard P, Mitchell GF, Himali JJ, Beiser A, Fletcher E, Tsao CW, et al. Aortic stiffness, increased white matter free water, and altered microstructural integrity: a continuum of injury. Stroke. 2017;48:1567–73.
35. Maillard P, Fletcher E, Harvey D, Carmichael O, Reed B, Mungas D, et al. White matter hyperintensity penumbra. Stroke. 2011;42:1917–22. 36. Huang J, Auchus AP. Diffusion tensor imaging of normal appearing white
matter and its correlation with cognitive functioning in mild cognitive impairment and Alzheimer’s disease. Ann N Y Acad Sci. 2007;1097:259–64. 37. Hinman JD, Lee MD, Tung S, Vinters HV, Carmichael ST. Molecular
disorganization of axons adjacent to human lacunar infarcts. Brain. 2015;138:736–45.
38. Zollinger LV, Kim TH, Hill K, Jeong EK, Rose JW. Using diffusion tensor imaging and immunofluorescent assay to evaluate the pathology of multiple sclerosis. J Magn Reson Imaging. 2011;33:557–64.
39. Planetta PJ, Ofori E, Pasternak O, Burciu RG, Shukla P, DeSimone JC, et al. Free-water imaging in Parkinson’s disease and atypical parkinsonism. Brain. 2016;139:495–508.
40. Metzler-Baddeley C, Jones DK, Steventon J, Westacott L, Aggleton JP, O’Sullivan MJ. Cingulum microstructure predicts cognitive control in older age and mild cognitive impairment. J Neurosci. 2012;32:17612–9. 41. Price CJ. A review and synthesis of the first 20 years of PET and fMRI studies
of heard speech, spoken language and reading. Neuroimage. 2012;62:816–47. 42. Greicius MD, Srivastava G, Reiss AL, Menon V. Default-mode network activity
distinguishes Alzheimer’s disease from healthy aging: evidence from functional MRI. Proc Natl Acad Sci U S A. 2004;101:4637–42.
43. Zhou J, Greicius MD, Gennatas ED, Growdon ME, Jang JY, Rabinovici GD, et al. Divergent network connectivity changes in behavioural variant frontotemporal dementia and Alzheimer’s disease. Brain. 2010;133:1352–67.