DEMOGRAPHIC RESEARCH
VOLUME 33, ARTICLE 47, PAGES 1281–1296
PUBLISHED 16 DECEMBER 2015
http://www.demographic-research.org/Volumes/Vol33/47/ DOI: 10.4054/DemRes.2015.33.47
Descriptive Finding
Education stalls and subsequent stalls in African
fertility: A descriptive overview
Anne Goujon
Wolfgang Lutz
Samir KC
©2015Anne Goujon, Wolfgang Lutz & Samir KC.
This open-access work is published under the terms of the Creative Commons Attribution NonCommercial License 2.0 Germany, which permits use, reproduction & distribution in any medium for non-commercial purposes, provided the original author(s) and source are given credit.
1 Introduction 1282
2 Surprising discontinuities in the progress of young women’s educational attainment in certain African countries
1283
3 A legacy of the SAP of the 1980s? 1289
4 Conclusions 1290
Education stalls and subsequent stalls in African fertility:
A descriptive overview
Anne Goujon1
Wolfgang Lutz2
Samir KC3
Abstract
BACKGROUND
Recent stalls in fertility decline have been observed in a few countries in sub-Saharan Africa, and so far no plausible common reason has been identified in the literature. This paper develops the hypothesis that these fertility stalls could be associated with stalls in the progress of education among the women of the relevant cohorts, possibly resulting partly from the Structural Adjustment Programs (SAPs) of the 1980s.
METHODS
We descriptively link the change in the education composition of successive cohorts of young women in sub-Saharan Africa and the recent fertility stalls. We use reconstructed data on population by age, gender, and level of education from www.wittgenstein centre.org/dataexplorer, and fertility rates from the United Nations.
RESULTS
In most sub-Saharan African countries, we observe that the same countries that had fertility stalls had a stall in the progress of education, particularly for young women who were of primary school age during the 1980s, when most of the countries were under structural adjustment. Conversely, stalls in fertility are less common in countries that did not have an education stall, possibly in relation to SAPs.
CONCLUSION
The results point to the possibility of a link between the recent fertility stalls and discontinuities in the improvement of the education of the relevant cohorts, which in
1 Wittgenstein Centre (IIASA, VID/ÖAW, WU), Vienna Institute of Demography, Austria.
E-Mail: [email protected].
2 Wittgenstein Centre (IIASA, VID/ÖAW, WU), International Institute for Applied Systems Analysis,
Austria. E-Mail: [email protected].
3 Wittgenstein Centre (IIASA, VID/ÖAW, WU), International Institute for Applied Systems Analysis,
turn could be related to the SAPs in the 1980s. This descriptive finding now needs to be corroborated through more detailed cohort-specific fertility analysis. If the education-fertility link can be further established, it will have important implications for the projections of population growth in affected countries.
1. Introduction
This research note studies the timing and magnitude of possible effects of the Structural Adjustment Programs (SAP), which were enforced in the early 1980s by the International Monetary Fund (IMF) and the World Bank in many developing countries, on the recent stall in fertility declines in several African countries, as mediated by discontinuities in the educational attainment of subsequent cohorts of young women in the affected countries.
2. Surprising discontinuities in the progress of young women’s
educational attainment in certain African countries
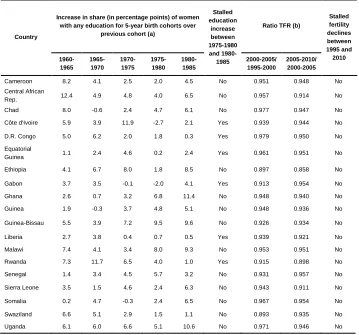
In a first step, we look at inter-cohort changes in the educational attainment of young women in sub-Saharan Africa using the recent reconstruction by gender and five-year age groups for 171 countries back to 1970 (WIC 2015; Speringer et al. 2015). The WIC dataset (2015) was chosen over other datasets (Barro and Lee 2013; Cohen and Leker 2014) as it is more recent and includes a larger number of countries than the two preceding sources. A first comparative inspection of the reconstruction results for different African countries showed discontinuities in the trend of improving education levels for successive cohorts of young women in many African countries. Table 1 shows the education level (defined as having an education vs. having none) of successive cohorts of women born between 1960 and 1985. If we take as the criterion for stalled education an increase of 1% or less between successive cohorts of women, many countries in sub-Saharan Africa exhibit such a pattern – about 66% of the 32 countries in our sample for women born between 1960 and 1985. SAP affected children’s education negatively and girls suffered more as a result of the choices of families faced with financial burdens (Stromquist 1999). To our knowledge, the literature does not specify a global criterion for stalls in education. The 1% increase mark was implemented based on our best judgement. Sensitivity analysis has shown that choosing a different mark (e.g., an increase of 0.5% or no increase at all) would yield different results in terms of the scale but not alter the message described below.
criterion for a stall; for example Bongaarts (2008) classifies stalls as non-significant declines in fertility (p<0.05), whereas Shapiro and Gebreselassie (2008) only consider the absence of a decline between two measurements, and Garenne’s (2008) criterion is that the fertility slope should have changed significantly from negative to nil or positive. Other studies consider yet other criteria, resulting in different sets of stalling countries. However, the concept is basically the same. There is also no clear consensus on the factors behind the lack of a significant decline in fertility that exists in some countries (Moultrie et al. 2008): poor socioeconomic development and family planning (Bongaarts 2008), slow increase in women’s education and decline in infant and child mortality (Shapiro et al. 2010), or no common factors (Garenne 2008). Other researchers doubt the existence of all or some stalls and blame the data on which the calculations are based (mostly from demographic and health surveys) as lacking validity (e.g., Schoumaker 2009; Machiyama 2010).
Table 1: Change in education for women born between 1960–1965 & 1980– 1985, and in fertility in period 1995–2010 in sub-Saharan Africa
Country
Increase in share (in percentage points) of women with any education for 5-year birth
cohorts over previous cohort (a)
Stalled education increase between 1975-1980 and 1980-1985
Ratio TFR (b) Stalled fertility declines between 1995 and 2010 1960-1965 1965-1970 1970-1975 1975-1980 1980-1985 2000-2005/ 1995-2000 2005-2010/ 2000-2005
Congo 11.2 5.9 2.6 -0.8 0.1 Yes 0.995 0.990 Yes
Gambia -4.6 8.0 5.8 6.7 11.8 No 0.978 0.989 Yes
Kenya 13.5 6.5 5.0 3.0 -0.3 Yes 0.986 0.960 Yes
Mali 2.0 1.0 0.9 1.5 0.8 Yes 0.986 0.978 Yes
Mozambique 5.2 1.4 3.8 3.3 7.3 No 0.991 0.974 Yes
Niger 1.7 2.9 4.2 -0.4 3.5 Yes 0.997 0.995 Yes
Nigeria 8.9 8.6 9.0 0.1 4.9 Yes 0.981 0.977 Yes
Tanzania 16.5 7.1 0.7 1.2 -0.5 Yes 0.984 0.986 Yes
Zambia 2.9 4.1 1.1 -0.9 2.6 Yes 0.984 0.975 Yes
Zimbabwe 2.2 13.5 1.1 2.3 0.1 Yes 0.957 1.000 Yes
Benin 5.2 1.0 3.9 0.7 10.8 Yes 0.939 0.919 No
Burkina Faso 1.5 1.5 3.9 2.5 5.8 No 0.956 0.945 No
Table 1: (Continued)
Country
Increase in share (in percentage points) of women with any education for 5-year birth cohorts over
previous cohort (a)
Stalled education increase between 1975-1980 and 1980-1985
Ratio TFR (b)
Stalled fertility declines between 1995 and 2010 1960-1965 1965-1970 1970-1975 1975-1980 1980-1985 2000-2005/ 1995-2000 2005-2010/ 2000-2005
Cameroon 8.2 4.1 2.5 2.0 4.5 No 0.951 0.948 No
Central African
Rep. 12.4 4.9 4.8 4.0 6.5 No 0.957 0.914 No
Chad 8.0 -0.6 2.4 4.7 6.1 No 0.977 0.947 No
Côte d'Ivoire 5.9 3.9 11.9 -2.7 2.1 Yes 0.939 0.944 No
D.R. Congo 5.0 6.2 2.0 1.8 0.3 Yes 0.979 0.950 No
Equatorial
Guinea 1.1 2.4 4.6 0.2 2.4 Yes 0.961 0.951 No
Ethiopia 4.1 6.7 8.0 1.8 8.5 No 0.897 0.858 No
Gabon 3.7 3.5 -0.1 -2.0 4.1 Yes 0.913 0.954 No
Ghana 2.6 0.7 3.2 6.8 11.4 No 0.948 0.940 No
Guinea 1.9 -0.3 3.7 4.8 5.1 No 0.948 0.936 No
Guinea-Bissau 5.5 3.9 7.2 9.5 9.6 No 0.926 0.934 No
Liberia 2.7 3.8 0.4 0.7 0.5 Yes 0.939 0.921 No
Malawi 7.4 4.1 3.4 8.0 9.3 No 0.953 0.951 No
Rwanda 7.3 11.7 6.5 4.0 1.0 Yes 0.915 0.898 No
Senegal 1.4 3.4 4.5 5.7 3.2 No 0.931 0.957 No
Sierra Leone 3.5 1.5 4.6 2.4 6.3 No 0.943 0.911 No
Somalia 0.2 4.7 -0.3 2.4 6.5 No 0.967 0.954 No
Swaziland 6.6 5.1 2.9 1.5 1.1 No 0.893 0.935 No
Uganda 6.1 6.0 6.6 5.1 10.6 No 0.971 0.946 No
Sources: (a) Wittgenstein Centre (WIC) Data Explorer, version 1.2; (b) United Nations 2015; and authors’ calculations.
As shown in Table 1, there is a higher share of countries with fertility stalls among countries with education stalls. It is striking that 8 out of 10 countries that are classified as having stalled fertility around and after 2000 were showing stalls in the improvement of female education for women born between 1975 and 1985, who then suffered most in terms of school intake from the intensive SAPs of the 1980s. By contrast, only 8 out the 22 countries that have not recently experienced a fertility stall had an education stall earlier (36%) during the intensive adjustment period of the 1980s.
The link between the education stalls and the implementation of SAPs is less clear. First, there is no consistent reliable information about the degree to which SAPs affected the education sector, and, secondly, adjustment policies were often implemented in countries already affected by crises and the education stall may have been triggered by the crisis itself (Klasen 2003; Heidhues et al. 2004).
Figure 1: Trends in the proportion of women cohorts born between 1950 and 1995 who have received at least some schooling for (a) Nigeria, (b) Kenya, (c) Zambia, and (d) Niger
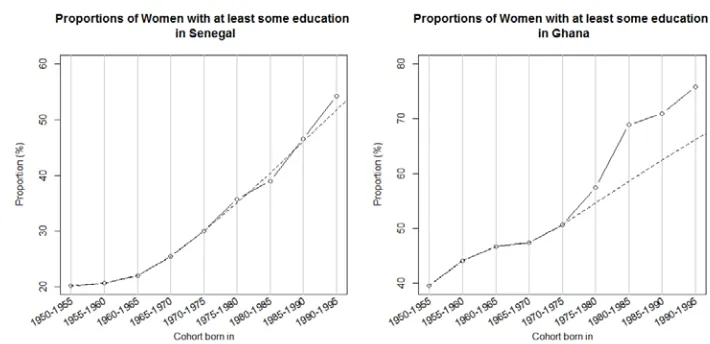
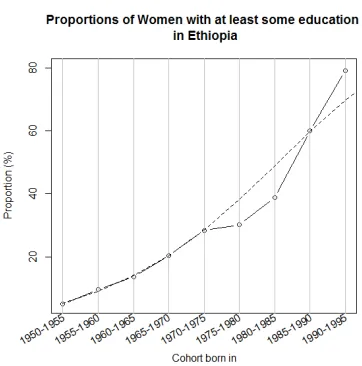
But there are also other large African countries that do not show such discontinuities, or even experienced accelerated educational improvement for these cohorts. Figure 2a shows the trends for successive cohorts in Senegal, where the improvement in the proportion of women who had ever attended school shows almost a straight line for women born after 1965 with only a very minor dent for those born between 1980 and 1985. In Ghana, after a period of little improvement for women born between 1965 and 1970, the rate of improvement even accelerated up until the year 1985, after which it slowed again. A particularly interesting case is Ethiopia, where a slowing of the improving trend between 1975 and 1980 was followed by an acceleration that was even faster than the original increase, and the proportion of women born 1990-1995 who had some schooling was brought to a level which, at close to 80%, is even higher than the trend line based on the cohorts born between 1950 and 1975.
Figure 2: (Continued)
Notes: The dotted lines show the extrapolation of the trend from cohorts born between 1950 and 1975 based on cubic spline.
3. A legacy of the SAP of the 1980s?
For many countries, particularly in Latin America and sub-Saharan Africa, the 1980s saw a contradictory international discourse on education and economic reform. On the one hand, UNESCO highlighted the overriding importance of education for national development and organized a series of regional conferences that finally culminated in the World Conference on Education for All in Jomtien (Thailand) in 1990. On the other hand, the World Bank and the IMF emphasized the need to restructure economies, reduce the role and the size of government spending, and enforce fiscal discipline. In particular, the Mexican government’s 1982 announcement that it could no longer service its debt obligations was widely seen as a wake up call, reminding the global community that a restructuring and stabilization of public finances was a prerequisite for subsequent sustainable economic growth. And since many countries in Africa and Latin America were dependent on the World Bank and IMF for credit, these institutions were able to impose the structural adjustment policies on these countries that they considered necessary and appropriate.
as a percentage of GDP. For the countries with strong discontinuities, listed in Figure 1, the following information on education spending was found: In Nigeria the total educational spending by the Federal Government dropped from 16.2% of the budget in 1979 to only 10% of the budget in 1986-1989 (Fadayomi 1993). Kenya was an intensive adjustment country and the funding for education as a percentage of GDP declined strongly, from 5.9% in 1981 to 4.6% in 1984, after which it recovered again (UNESCO 2015). For Niger we could not find information about changes in the education budget before 1990, but it is clear that it was among the adjustment lending countries. Zambia, which also was an intensive adjustment lending country, decreased education spending massively, from 6.3% of GDP in 1976 and 5.4% in 1983 down to a low of 2.7% in 1987 and even below 2.0% in the early 1990s (UNESCO 2015).
While Ethiopia was not among the structural adjustment countries (in the 1980s), both Ghana and Senegal were. But Ghana, despite being in this category, after an initial decline from 2.7% in 1980 to 1.8% in 1981, managed to increase its education spending as a proportion of GDP to above 3.0% in the mid- and late 1980s (UNESCO 2015), while Senegal saw a slight decline in 1990 (Reimers 1997). On average, for all the bigger African countries for which we could find data on their exposure to SAPs and the resulting changes in education spending, the pattern is clear: Those countries that were heavily exposed to SAP saw significant declines in their education spending as a proportion of GDP, which under conditions of rapid population growth resulted in declines in school enrolment rates, and most likely also in the quality of education. Countries that were not affected by SAP policies or that managed to maintain or even increase their education spending despite SAP (such as Ghana) had no discontinuities in the improving education of subsequent cohorts during the 1980s.
4. Conclusions
Given the strong differentials of fertility by level of female education in all African countries and the huge body of literature that explains the causal mechanisms behind the pervasive negative association between the two (Bongaarts 2010; Cochrane 1979; Castro Martin 1995; Fuchs and Goujon 2014; Lutz and Skirbekk 2014), it seems plausible to prima facie assume the possibility of a direct causal relationship between the stalled trend in female education and the subsequent stall in fertility decline in the countries affected by the former.
and education of cohorts of women born around the time of SAP, differentiating between more- and less-intensive SAP. This would be a logical next step after this first descriptive paper. Our analysis only shows that the stalls in education for women born between 1975 and 1985 that are observed in 8 out of 10 African countries that experienced SAP might have resulted in the observed fertility stalls in 1995–2010. Conversely, other countries in sub-Saharan Africa that did not show such education discontinuities also experienced smooth and continuous fertility declines, in clear contrast to those experiencing fertility stalls. Hence, this could potentially point to the long-sought-after common cause of stalled fertility in the countries affected.
References
Barro, R.J. and Lee, J.W. (2013). A new data set of educational attainment in the world, 1950–2010. Journal of Development Economics 104: 184–198. doi:10.1016/ j.jdeveco.2012.10.001.
Bongaarts, J. (2006). The causes of stalling transitions. Studies in Family Planning
37(1): 1–16. doi:10.1111/j.1728-4465.2006.00079.x.
Bongaarts, J. (2008). Fertility transitions in developing countries: progress or stagnation? Studies in Family Planning 39: 105–110. doi:10.1111/j.1728-4465.2008.00157.x.
Bongaarts, J. (2010). The causes of educational differences in fertility in sub-Saharan Africa. Vienna Yearbook of Population Research 8: 31–50. doi:10.1553/ populationyearbook2010s31.
Castro Martin, T. (1995). Women’s education and fertility: Results from 26 demographic and health surveys. Studies in Family Planning 26: 187–202.
doi:10.2307/2137845.
Cochrane, S.H. (1979). Fertility and education. What do we really know? Baltimore: Johns Hopkins University Press.
Cohen, D. and Leker, L. (2014). Health and education: Another look with the proper data. London: Centre for Economic Policy Research (CEPR) (CEPR Discussion Paper No. DP9940).
Cornia, G.A., Van der Hoeven, R., and Mkandawire, T. (1993). Africa's recovery in the 1990s: From stagnation and adjustment to human development. London: Palgrave Macmillan.
Eloundou-Enyegue, P.M., Stokes, C.S., and Cornwell, G.T. (2000). Are there crisis-led fertility declines? Evidence from Central Cameroon. Population Research and Policy Review 19: 47–92. doi:10.1023/A:1006423527473.
Fadayomi, T.O. (1993). Nigeria: Consequences for education. In: Adepoju, A. (ed.).
The impact of structural adjustment on the population of Africa: The implications for education, health, & employment. London: Heinemann: 98–101. Foster, A. (1993). The effects of economic fluctuations on marriage and fertility in
Fuchs, R. and Goujon, A. (2014). Future fertility in high fertility countries. In: Lutz, W., Butz, W.P., KC, S. (eds.). World population and human capital in the 21st century. Oxford: Oxford University Press: 147–225. doi:10.1093/acprof: oso/9780198703167.003.0004.
Garenne, M. (2008). Situations of fertility stall in sub-Saharan Africa. African Population Studies 23(2): 173–188.
Gendell, M. (1985). Stalls in the fertility decline in Costa Rica, Korea, and Sri Lanka. Washington, DC: The World Bank (World Bank Staff Working Paper Report No. SWP693).
Heidhues, F., Atsain, A., Nyangito, H., Padilla, M., Ghersi, G., and Le Vallée J.C. (2004). Development strategies and food and nutrition security in Africa: An assessment. Washington, DC: IFPRI (2020 Discussion Paper No. 38).
Klasen, S. (2003). What can Africa Learn from Asian Development Successes and Failures? Review of Income and Wealth 49 (3): 441–451. doi:10.1111/1475-4991.00098.
Lesthaeghe, R. and Jolly, C. (1994). The Start of the sub-Saharan fertility transitions: Some answers and many questions. Issue Annals of the New York Academy of Sciences Volume 709, Human Reproductive Ecology: Interactions of Environment, Fertility, and Behavior: 379–395.
Lutz, W. and Skirbekk, V. (2014). How education drives demography and knowledge informs projections. In: Lutz, W., Butz, W.P., KC, S. (eds.). World population and human capital in the 21st Century. Oxford: Oxford University Press: 14–38.
doi:10.1093/acprof:oso/9780198703167.003.0002.
Machiyama, K. (2010). A re-examination of recent fertility declines in sub-Saharan Africa. Calverton, Maryland: ICF Macro (DHS Working Papers No. 68). Moultrie T., Hosegood, V., McGrath, N., Hill, C., Herbst, K., and Newell, M.-L.
(2008). Refining the criteria for stalled fertility declines: An application to rural KwaZulu-Natal, South Africa, 1990-2005. Studies in Family Planning 39(1): 39–48. doi:10.1111/j.1728-4465.2008.00149.x.
National Research Council. (1993). Demographic change in sub-Saharan Africa. Washington, DC: The National Academies Press.
Reimers, F. and Tiburcio, L. (1993). Education, adjustment and reconstruction: Options for change. Paris: UNESCO.
Rose, P. (1995). Female education and adjustment programs: A cross-country statistical analysis. World Development Review 23 (11): 1931–1949. doi:10.1016/0305-750X(95)00091-P.
Shapiro, D. and Gebreselassie, T. (2008). Fertility transition in sub-Saharan Africa: Falling and stalling. African Population Studies 23(1): 3–23.
Shapiro, D. and Tambashe, B.O. (2003). Kinshasa in transition: Women's education, employment, and fertility. Chicago: University of Chicago Press.
Shapiro, D., Kreider, A., Varner, C., and Sinha, M. (2010). Stalling of fertility transitions and socioeconomic change in the developing world: Evidence from the Demographic and Health Surveys. Paper presented at the 2010 Chaire Quetelet Seminar, Louvain-la-Neuve, Belgium, November 24–26 2010.
Schoumaker, B. (2009). Stalls and reversals in fertility transition in sub-Saharan Africa. Real or spurious? Louvain-la-Neuve: Université Catholique de Louvain, Département des Sciences de la Population (Document de Travail du SPED No. 30).
Speringer, M., Goujon, A., Eder, J., KC, S., Bauer, R., and Potančoková, M. (2015). Validation of the Wittgenstein Centre back-projections for populations by age, sex, and level of education from 1970 to 2010. Laxenburg, Austria: International Institute for Applied Systems Analysis (IIASA Interim Report; IR-15–008). Stromquist, N.P. (1999). The impact of structural adjustment programmes in Africa and
Latin America. In: Heward, C., Bunwaree, S. (eds.). Gender, education and development: Beyond access to empowerment. London and New York: Zed Books Ltd: 17–32.
Tapinos, G., Mason, A., and Bravo, J. (1997). Demographic responses to economic adjustment in Latin America. Oxford: Clarendon Press.
UNESCO. (2015). UNESCO Institute for Statistics Data Base [electronic resource]. Montreal: UNESCO Institute for Statistics. http://data.un.org/Data.aspx?d= UNESCO&f=series%3AXGDP_FSGOV.