Copyright © 2015 IJECCE, All right reserved 565
International Journal of Electronics Communication and Computer Engineering Volume 6, Issue 5, ISSN (Online): 2249–071X, ISSN (Print): 2278–4209
LED Array Design with Image Based Planar
Verification
Aparna Murthy
McMaster University, School of Bio- Medical Engineering, 1280 Main Street W, Hamilton, ON, L8S 4L7, Canada
Abstract – Goal of this work is to design an illumination array that ensures uniformity of light field. The array design is simulated using a non-sequential ray trace tool. This tool provides illumination measurements using charts of intensity variation that is quantified in a hemispherical or a spherical volume. The sphere acts as a receiver surface to compute the spread of light field and to determine the corresponding radiometric value. The spherical radius of this receiver can be varied to obtain collection efficiency at certain distances. Prototype of the array is optimized considering the electro-optical and physical constraints of the light emitting diodes. A planar uniformity is verified from captured images. The illumination of chess board pattern provides a statistically measure for comparison. The intensity gradients are extracted using edge processing operators. The binary map of edges provides a numerical value of intensity transitions for a given arrangement of sources. Using near infrared sources organic samples is imaged to make inferences under low light conditions.
Keywords – Cylindrical coordinates, Diffusive, Edge Statistics, Radiometry.
I.
I
NTRODUCTIONIn the era of green energy light emitting diode (LED) is used in variety of applications. This is an experimental study comprising of illumination array design for medical instrumentation. LightToolsTM a non-sequential ray tracing tool is used for array design staring from selection of sources to optimization. The design process comprises of simulation, prototyping and light field verification using image processing algorithms. Various topologies are realized based on electro-optical parameters and power consumption. White light source with different photometric measure in terms of brightness is used to demonstrate irradiance on a surface. Array design with an optimal count of LED to achieve uniformity of field without extra optics is discussed [1],[2],[3]. The geometry of such an arrangement is important in terms of packing density in a given plane. The lattice configuration that defines angular spacing in 3D is used for improving the sampling efficiency [2].
II.
P
RINCIPLE OFL
IGHTM
EASUREMENTRadiometry is a study of total energy content delivered from a source. Analytically, radiometric measuring technique is by encapsulating the source within a receiver sphere. The surface of this receiver sphere is divided into a finite number of zones. The total flux is the sum of product of the zonal area and average intensity collected [4].
Extended area source unlike point sources are not isotropic. The calculation of the throughput for such sources can be done based on the following assumptions: Firstly, if the separation between source and entrance aperture of the sensor’s field- of- view is large then the solid angle and radiance is independent of the source area. Secondly, the path loss for such sources is considered to be negligible [5]
The photometry measurement is based on the visual sensation of the eye. Spectral energy distribution for photopic vision is in the wavelength range of 380-780 nm. When an object is illuminated, the reflected intensity is given as (1)
I λ =ρ λ L(λ) (1) Where ρ() is reflectivity or transmissivity characteristic of the object and L() is incident energy distribution. For white light sources, the conversion between the two that is radiometric to photometric is given as (2),
Qv = 683 V λ Qλ
780
380 dλ (2)
By definition, lumen (lm) is 1W of radiant energy at a given wavelength of maximum visual sensitivity (around 0.55 m) which is equal to 683. Qv and Qare luminous
energy measure in photometry and radiometry respectively. V () is the efficiency function at a particular wavelength for spectral luminosity[8].
III.
R
ADIOMETRICS
IMULATIONA. Array geometry
Source arrangement in a global coordinate system is done using LightToolsTM. It allows modeling, characterizing of sources and array design. This technique is useful to model interferometry, diffraction and wave-optics phenomena [6]. It can be used with sources that are of various shapes, viewing angle and optical power [6]. LightToolsTM illumination module provides Monte Carlo ray tracing for precise predictions of intensity and luminance. It also has the capabilities for illumination analysis and visualization of spread of light based on point-and shoot ray [6].
Copyright © 2015 IJECCE, All right reserved 566
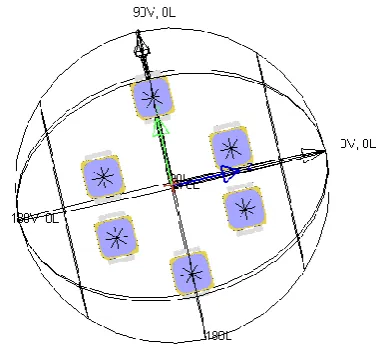
represented using the vertical and lateral axis (V, L).The coordinate system has vertical angle or nadir (0V, 0L) and it ranges from (0,180 ) while the zenith (180V, 0L) ranging from (0, 360)[6]. Each area/bin/zone on the globe collects light for calculating the net radiometric measure.
Fig.1. Topological arrangement of the LEDs, a hexagonal placement shown in global coordinate system
Simulation scenario considers factors that are tailored to fit the environment and hence are not to actual scale. The array shown in Fig.1is rotationally symmetrical and is devised to emit the light field covering a 360◦ field of view.
This arrangement has distinctive advantage:
1. The field illuminates the walls of the cylindrical tube which is the primary condition.
2. The light field range is directly proportional to the number and spacing of the LED.
3. Reduced effects of hot-spot in the near field because of the orientation of the sources as seen in Fig. 2
Fig.2. 3D chart gives a measure of intensity distribution as seen on the receiver sphere. The intensity spread is as
per the colors, red being high intensity to blue being the least
B. Constraint considerations
The layout and placement of the sources is simulated using the tool while source selection is done on three main parameters namely, electrical, optical and physical. For
example the brightness can be chosen based the current rating of the LEDs. When operating between 3-3.5V and driven by constant current of 20mA, LED has a photometric value of 68 lm/mW for 100% luminous intensity [11]. Similarly for getting higher luminous intensity a high brightness LED maybe used when driven at a constant current of 300mA for obtaining 100% luminance [10].
Another parameter is optical that characterizes a source’s emitting surface. This is radiating energy in space that is angular dependent also called as viewing angle of the source. Typically the viewing angle can vary from 120 (Lambertian) to 20 (narrow or collimated).White light source are characterized by color rendering index (CRI) while narrow spectral sources are characterized as full width half maximum (FWHM). CRI is related to the temperature dependency of the source. The physical parameter is the dimension of the foot prints that defines the packaging density in a given plane.
C. Prototype design
Placement information for the sources is dependent on the physical dimension of the source and viewing angle.The empirical calculation in terms of number of sources and corresponding edge length that are realized for given physical dimensions are based on geometrical placements. Given, r the radius of reference plane and R physical radius of the source, we can calculate the upper bound for a closely packed set of circular ring design.
ub = r
R (3)
If the angular separation between the sources is provided, then calculating the arc length using sector equations would translate to the spacing between the sources.
These parameters give the count for number of sources that are placed on a PCB plane. With equally spaced sources in a group of 3,4,6,8 are realized. The PCB plane is considered for low power and high power LEDs. The set of sources are namely 3, 4 for high brightness (HB) and 6,8 for low power (LP) collimated sources. The design implementation is for the topologies as shown in table I. With the HBLEDs, Cree® XLamp MX-6 LEDs that are surface emitters having wide viewing angle and no extra optics used is devised [10].
Table I: LED characteristics that were used in the current application
Characteristics of source
Lower power rad= 5 mm
High brightness dim = 5x5 mm
Number of source 6,8 3,4
Power consumption < 0.7 W ≅ 8 W
Photometric flux 68 lm/mW 114 lm/mW
Copyright © 2015 IJECCE, All right reserved 567
International Journal of Electronics Communication and Computer Engineering Volume 6, Issue 5, ISSN (Online): 2249–071X, ISSN (Print): 2278–4209
IV.
I
MAGEV
ERIFICATIONA. Experimental set up
Verification of the light field spread over a volume is an important measure of light system design. An image based approach provides a measure of uniformity at varying distances on the detector plane. The images are captured at distances ranging from 2-15cms, is tested for uniformity over an area. Image based lighting are commonly being used in photorealistic rendering and to fix non-uniformity in illumination [13].
For this work, images of same view are acquired with variation in exposure time within the saturation limit of the camera. The set up comprises of the following steps: 1. VI characteristics of the LEDs set to stable region of operation based on de-rating current [8],[9].
2. Based on step-1, constant current setting of the array are If= 20mA, 300mA for LP and HB LEDs respectively.
3. Step -2 ensures luminance value of the white LED set to 100% [8],[9].
4. CCD has a wide spectral response (400- 1100nm)and software setting for gain and exposure time that are changed for measurement comparison.
(default: (gain, exposure time)= (200, 1ms))
5. Ambient lighting conditions: Camera calibration set to default gain and exposure time that form the base-line setting to eliminate any stray light.
6.The variable distance is done by moving the screen with respect to the array. The camera parameters are not changed to retain consistency in the measurements.
The on-axis measurement set-up is as shown in Fig.3. Light field at different distances (z-direction) is shown by varying CCD plane and screen approximately 2-15cms.
Fig.3. Experimental set-up-1 for on- axis measurement representation of the 3 planes namely the screen, CCD and
light array; with screen moving in the z-direction shown by the arrow (Cylindrical Coordinate system – (r,,z))
B. Measurements
The end application is to verify for a cylindrical volume. With the simulated layouts providing an optimal placement of the sources and maximizing spread of light in a circular cross-section a necessity. The on-axis light collection is done for validating the continuity measure of light field for this cross-section. To differentiate highlight
and low light regions Mach band effect which is an empirical technique is used [15].Intensity measurements at distances ≅ 2 -10 cms were captured. Fig. 4 and Fig. 5 show the spread of light at 2 cms distance between the screen and the array. The luminance of each source is set to 100% (read from the datasheet). Gain and exposure time is provided for tuning the visibility conditions under a low light situation. A histogram for the spread of the field over the region of interest is shown in figure 4(b) (within the yellow circle using ImageJ [30]) for providing the gray-level gradients.
The viewing angle and physical dimension of the source are critical factor for designing the array. The figures 5(a) and(b) is image of low power collimated source array and the corresponding histogram.
(a)
(b)
Fig.4. (a) Image captured using array of three wide viewing angle HBLEDs with default camera setting (b) The histogram for the statistics of the gray levels in the
enclosed region
(a)
(a)
(b) (a)
(b)
(a)
Copyright © 2015 IJECCE, All right reserved 568
International Journal of Electronics Communication and Computer Engineering Volume 6, Issue 5, ISSN (Online): 2249–071X, ISSN (Print): 2278–4209
(b)
Fig.5. (a) Six low power LED light field spread for on-axis measurement (b) The histogram of the gray levels as
enclosed by the red circle
The low power LED arrays are of particular interest as the power consumed is low. The area of the histogram can be increased by populating the array with more number of LEDs. With the default camera setting and luminance of the source set to 100% operating, images were captured with varying distance to visually verify. Parameters such as exposure time, gain and luminance of the sources(in terms of constant current setting)was varied and images captured to verify the photometric measurements.
C. Edge Statistics
In vision and psychological perception, foveal images of varying contrast patterns are generally used [16]. Chess board for example has blocks of contrast pattern. The borders and corners form a montone slope [16]. Using these known patterns the field continuity can be estimated at the corners or edges by illuminating them. Intensity transitions are viewed as key components for object identification when contrast maps are used. Gray scale images are characterized by the gradients of contrasts and one of the obvious techniques of looking at irregularity is identifying the sharp intensity transitions. These sharp variations are obtained by “Edge detection” operators.
(a)
(b)
Fig.6. (a)The binary map using 3 LED array, first derivative (A,B) operators and second derivative (C,D) operators(b)The binary image for 6 LED array (template
-3, appendix-D) using first derivative (A,B) operators and second derivative (C,D) operators
The four operators used to compare the first order and second order statistics. The commonly used edge detection operators that comprise of simple operations are Sobel, Perwitt, Canny and Laplacian of Gaussian (log) [14]. The patterns when illuminated using three HBLEDs and six LP LEDs are shown in the Appendix A-1(a) and (b) respectively. The image is a gray scale (8-bit), bmp format with a pixel size of 204 x 153. Upon usage of edge operators, a binary map is obtained. The representation of this binary map in the image format is as shown in Fig. 6(a) and (b). The binary map is of 204x153 size. A script in matlab that count the ones in the binary map isused which returns the integer value. This count is the edge statistics; it isscaled for every 1000 pixel group.Fig.7 gives a statistical comparison for such 1000-pixel grouping. It compares the edge statistics for both the illuminations as shown in appendix A-1(a) and (b).
Fig.7. Statistical comparison for binary map in Fig 6(a) and (b), dark orange is representation for high brightness
and light orange is statistics for low power LED array.
There is almost 50%reduction in statistics between LP and HB arrays. If bench marking is done with Canny operator difference in efficiency is about 20 %.
(a)
(b)
(a)
(b)
A.sobel B.prewitt
C.canny D.log
A.sobel B.prewitt
C.canny D.log
(a)
(b)
C.canny D.log
A.sobel B.prewitt
Copyright © 2015 IJECCE, All right reserved 569
International Journal of Electronics Communication and Computer Engineering Volume 6, Issue 5, ISSN (Online): 2249–071X, ISSN (Print): 2278–4209
V.
A
PPLICATIONNarrow spectral band near infra-red (NIR) sources are populated to form the array. This is used to illuminate organic samples such as paints (water based) and fruits. The uniformity of field is in compliance with the white light array of smaller viewing angle and low power. Images captured using NIR array demonstrates the need for analysis of light field’s interaction with scene that is being illuminated. The NIR sources used are of two different wavelengths, details provided in the datasheet [19],[20].
Reflectance from a scene is said to be either specular or diffuse light. Specular reflection is normally mirror like reflection while diffuse reflection is as light travels in the media and is then re-emitted. The specular reflection is highly directional while diffuse is dependent on the micro-facets of the surface [22]. Diffused light is scattered in all directions making the surface a uniform scatterer or Lambertian surface [21]. Primarily as light impinges on a material’s surface it gets reflected, transmitted or absorbed. With NIR band, certain materials become transparent. This aspect is useful for identification of absorbing and non-absorbing characteristics of the material. Wavelet transformation provides a frequency domain analysis. This filtering technique results in coefficients that can differentiate the intensity gradients.
As a case study some fruits are considered for imaging using the 750 and 840 nm sources. As an example fruits are used, properties of in homogeneity in fruits make it close to turbid media samples. Spatially resolved diffuse reflectance profiles are commonly used for fruit inspections and the diffusion theory model is used to fit the data [23]. The physical state of the fruits can be processed for visualization of certain parameters such as damage [24]. The sample with high water content is used to demonstrate the aspects of scattering and absorption disparities as the source wavelength changes. The choice of the samples is only to test the optical transparency levels at the 750 and 840 nm wavelengths and not to characterize the molecular contents in the bulk material. The reflectance that is measured at a gain and exposure time of the bulk sample is as shown in Fig 8(a) and (b). It should be noted that the increase of gain results an increase in the noise levels of the captured image. Hence an optimal (gain, exposure time) has to be fixed for minimizing unwanted noise and ringing in the images.
(a) (b)
Fig.8. (a) Plum with skin, illuminated with 750; exposure
time=1ms and gain =200 (b) Plum with skin, illuminated with 840; exposure time=1ms and gain =200
To extract edge information from images Haarwavelets are used. Using the wavelet toolbox provided in MATLAB the transformation and extraction of the statistics is accomplished. The approximations and details coefficients provide the frequency content in the images [29]. When samples with high water content are illuminated with narrow band NIR the absorption of energy by water becomes pronounced and hence reflectance changes. For example while imaging fruits that have high water content we can observe the changes in the reflectance measure as we go from visible to 840nm (since it is currently being used). Water absorption peaks as we move towards 1500 nm. Studies have determined that water absorption bands gets stronger around 1450, 1950 and 2500 nm [25].Statistical properties of such speckles can be seen in both first and second order coefficients. The filtered coefficients namely the first order defines properties of speckle fields or contrast disparities whilst the second or higher orders characterize intensity variations [27]. The image representation of the coefficients helps in locating the specific region of interest. Fig.9 shows the two level transformation or the horizontal, diagonal and vertical coefficients (in the clockwise direction) of the imaged fruit. The rot portion of the fruit has specific pattern and the surface level abnormalities. The differentiated coefficients show the scattering of light.
The use of NIR light is due to its ability of light to create optical transparency in certain materials. It is known that the interaction of light beam and tissue creates a photo-biological phenomenon [26]. It is observed that the physiological conditions are by absorption of low-intensity light resulting in a non-coherent activity [26]. Hence dependency on the light intensity operating in low power has a stimulative action on organic samples [26].
Fig.9. Haar transformed image with two- level decomposition along with the coefficients {Horizontal,
Diagonal and Vertical} in the clockwise direction
Copyright © 2015 IJECCE, All right reserved 570
VI.
C
ONCLUSIONThis work discusses simulation and prototyping of a LED array without any extra optics such as collimators or diffusers for achieving uniformity. The primary considerations are the physical dimension and viewing angle for prototyping. The light array is of dimensions suitable for the 3:1 catadioptric objective [28] for radial view that gives a panoramic surveillance. Hence structure of the array itself is designed to illuminate a cylindrical volume. The topologies realized are {3,4} with high brightness and {6,8} of low power. Furthermore the field spread can be increased by increasing the packing density. The prototyped PCB realized is a ring structure with outer radius 3.4cms. The scalability of the design is based on (3) that considers the ratio of the physical design. The count is chosen for suitability of the design of a particular geometry to achieve a rotationally symmetry that results in a uniform light field.
The NIR wavelength has to be chosen carefully and sample thickness has to be prepared for imaging. Images thus captured can be post-processed for obtaining the activities that are occurring at sub-surface levels. This makes the usage of the instrument suitable for medical applications.
A
PPENDIX(a)
(b)
Fig.A-1: Image captured after illuminating the templates using array of high brightness and low power LEDs with
default gain and exposure time.
A
CKNOWLEDGMENTI take this opportunity to thank everyone who has inspired me to take up an interdisciplinary work.
I am deeply thankful to my supervisor Dr Qiyin Fang for his continuous support in carrying out the project work. I also thank my co-supervisor Dr Jamal Deen whose motivation and guidance has led to the successful execution of the project work.
I would like to thank McMaster University for supporting me in the research work.
R
EFERENCES[1] I Moreno, M Avendaño-Alejo, and R I. Tzonchev, “Designing light-emitting diode arrays for uniform near-field irradiance”,Optical society of America– Applied Optics, Vol 45, No 10, pp. 2265-2272, 2006
[2] F Qiu, F Xu, Zhe Fan, A Kaufman, and Klaus Mueller, “Lattice-based volumetric global illumination”, IEEE transactions on Visualization and computer graphics, Vol 13, No 6, 2007 [3] Jing-tao Dong, R- S Lu, Y-Q Shi , R-X Xia et al, “Optical design
of color light-emitting diode ring light for machine vision inspection”, Optical Engineering, 50(4), 043001, 2011
[4] Barrows, “Light , photometry and illuminating Engineering” , McGraw-Hill, 1951
[5] C L Wyatt, “Radiometric system design”, Macmillan Publishing company , 1987
[6] LightTools notes /help documentation – 7.3.0 SRI, 2011 [7] http://www.agi32.com/kb/index.php?article=432(receiver-C) [8] T Bishop, “Intelligent opto sensor –Designer’s notebook
TAOS”, 2007,unpublished
[9] Cree XLampXRC datasheet , <http://www.cree.com/ >, 2012 [10] Cree XLampXRC datasheet , <http://www.cree.com/ >, 2012 [11] Everlight datasheet , <http://www.everlight.com/>, 2009 [12]
<http://www.m-shot.com/microscope-camera/microscope-camera-mc20-n.html>
[13] Claus B. Madsen and Rune E. Laursen, “Performance comparison of techniques for approximating Image-Based Lighting by Directional Light Sources”,SCIA, LNCS 4522, pp. 888–897, 2007
[14] A K Jain, “Fundamentals of digital image processing”, Prentice Hall, 1989
[15] R B Lotto, S M Williams, and D Purves, “An empirical basis for Mach bands”, Proc NAS- USA, Vol. 96, pp. 5239–5244, 1999 [16] G Westheimer, “Irradiation, border location, and the
shifted-chessboard pattern”, Perception, volume 36, pp. 483 – 494, 2007 [17] J A Richardson, “Geometric processing and enhancement: Image
domain techniques”, Remote Sensing Digital Image Analysis, Springer-Verlag Berlin Heidelberg, 2013,unpublished
[18] M Elhabiby, A Elsharkawy and N El-Sheimy “Second generation curvelet transforms Vs Wavelet transforms and Canny edge detector for edge detection from worldview-2 data “, International Journal of Computer Science & Engineering Survey (IJCSES) Vol.3, No.4, 2012
[19] Epigap Optronic product datasheet, <http://www.epigap-optronic.com/product-detail-en/items/EOLD-750-524.html> [20] Epigap Optronic product datasheet,
<http://www.epigap-optronic.com/product-detail-en/items/EOLD-840-325.html> [21] C Wyne,“Introduction to BRDF based lighting”, NIVIDIA
Corporation, 2000 , unpublished
[22] D F Rogers, “Procedural elements for computer graphics”, McGraw-Hill, 1985
[23] Jianwei Qin and Renfu Lu, “Measurement of the optical properties of fruits and vegetables using spatially resolved hyperspectral diffuse reflectance imaging technique”, Postharvest Biology and Technology,Vol 49, pp. 355-365, 2008 [24] Qiang Lü , M-J Tang, J-R Cai, J-W Zhao and S Vittayapadung,
“Vis/NIR hyperspectral Imaging for detection of hidden bruises on Kiwifruits” , Czech J. Food Sci. Vol. 29,No. 6, pp.595-602 2011
[25] Dr S. C Liew (2012). Principles of remote sensing[Online]. Available: http://www.crisp.nus.edu.sg/~research/tutorial/ optical.htm
[26] T I Karu, “Photobiology of low-power laser affects, Health Physics, Vol 56, pp. 691-704, 1989
(a)
(b) (a)
Copyright © 2015 IJECCE, All right reserved 571
International Journal of Electronics Communication and Computer Engineering Volume 6, Issue 5, ISSN (Online): 2249–071X, ISSN (Print): 2278–4209
[27] T Vo Din, “Biomedical handbook”, CRC press, pp.3-2 to 3-21, 2002.
[28] R C Chung Wang, M. Jamal Deen, David Armstrong, and Qiyin Fang, “Development of a catadioptric endoscope objective with forward and side views”, Journal of Biomedical Optics 16(6), 066015, 2011
[29] M Misiti , Y Misiti, G Oppeheim and J-M Poggi, “ Wavelet toolbox User guide” © The MathWorks, pp.1-16 to 1-26, 1997 [30] T Ferreira and W Rasband, “ImageJ user guide – 1J1.46r”, 2012