DOI
10.17219/acem/69247
Copyright
© 2018 by Wroclaw Medical University This is an article distributed under the terms of the Creative Commons Attribution Non-Commercial License (http://creativecommons.org/licenses/by-nc-nd/4.0/)
Address for correspondence
Zhanqing Zhang
E-mail: [email protected]
Funding sources
This work was supported by the “The Twelfth Five-Year” National Science and Techno logy Key Projects of China (No. 2013ZX10002005), and the key scientific research project of Shanghai Municipal Health and Family Planning Commission of China (No. 20134032).
Conflict of interest
None declared
Acknowledgements
The Lumipulse HBsAg kits were kindly provided by Fujirebio Shanghai Representative Office.
Received on October 28, 2016 Reviewed on January 29, 2017 Accepted on March 1, 2017
Abstract
Background. A novel high-sensitivity HBsAg quantification assay, Lumipulse HBsAg-HQ, was developed. However, its performance in practical application has not yet been adequately investigated.
Objectives. The aim of the study was to evaluate the agreement of serum HBsAg by Lumipulse HBsAg-HQ (HBsAg-HQ) with HBsAg by Architect HBsAg-QT (HBsAg-QT) and comparatively investigate the efficacy of serum HBsAg-HQ and HBsAg-QT in predicting the liver tissue pathological states of chronic hepatitis B (CHB) patients.
Material and methods. A total of 147 HBeAg-positive and 128 HBeAg-negative patients were enrolled. HBsAg-HQ and HBsAg-QT were measured using CLEIA Lumipulse G1200 and CMIA Abbott Architect I2000 automatic analyzer, respectively. The Scheuer standard was used for the pathological diagnosis of liver tissue samples.
Results. In both HBeAg-positive and HBeAg-negative patients, HBsAg-HQ was significantly positively correlated with HBsAg-QT (r = 0.913 and r = 0.959, respectively), the overall disagreement rates between HBsAg-HQ and HBsAg-QT were 2.72% (4/147) and 4.69% (6/128), respectively. In HBeAg-positive patients, the area under the ROC curve (AUC) of HBsAg-HQ and HBsAg-QT for predicting the grade ≥G3 (0.686 and 0.684, respectively) and stage ≥S4 (0.739 and 0.745, respectively) were the greatest compared with other pathological states; the optimal cutoffs of HBsAg-HQ and HBsAg-QT for predicting the grade ≥G3 were <2.244 × 10⁷ mIU/mL and <3.589 × 10⁷ mIU/mL, and those for predicting the stage ≥S4 were 7.328 × 10⁶ mIU/mL and <6.194 × 10⁶ mIU/mL, respectively.
Conclusions. HBsAg-HQ is highly correlated and in agreement with HBsAg-QT in both HBeAg-positive and HBeAg-negative patients; HBsAg-HQ and HBsAg-QT are very valuable in predicting the grade ≥G3 and stage ≥S4 in HBeAg-positive patients.
Key words: hepatitis B surface antigen, performance evaluation, Lumipulse HBsAg-HQ, pathology, non-invasive diagnosis
Performance evaluation of HBsAg by Lumipulse HBsAg-HQ:
The agreement with HBsAg by Architect HBsAg-QT
and the effectiveness in predicting liver tissue
pathological states of chronic hepatitis B patients
Zhanqing Zhang
1,A,C,D,F, Rongrong Ding
1,B,D, Wei Lu
1,B,E, Zhiqiang Yang
2,E,
Yanbing Wang
1,B, Xinlan Zhou
1,B, Dan Huang
1,B, Xiufen Li
1,B, Yanling Feng
1,B1 Shanghai Public Health Clinical Center, Fudan University, China
2 Fujirebio Shanghai Representative Office, China
A – research concept and design; B – collection and/or assembly of data; C – data analysis and interpretation; D – writing the article; E – critical revision of the article; F – final approval of the article
Introduction
The detection of serum hepatitis B surface antigen (HBsAg) is the leading hallmark for screening and di-agnosing hepatitis B virus (HBV) infection. In the past 10 years, serum HBsAg quantification assays have been developing rapidly. Among them, Architect HBsAg-QT (Abbott Laboratories, Chicago, USA) and Elecsys HBsAg II (Roche Diagnostics GmbH, Mannheim, Germany) have
been widely studied and preliminary applied.1−4 Several
studies have demonstrated that the levels of serum HBsAg are different during the various phases of natural history and are associated with the liver tissue pathological states
of chronic HBV infection.5−8 Furthermore, some evidence
has reinforced its value in predicting drug efficacy and evaluating the prognosis in patients with chronic hepatitis
B (CHB).9,10
Recently, a novel high-sensitivity linearized HBsAg quantification assay, Lumipulse HBsAg-HQ
(Fujire-bio Inc., Tokyo, Japan), was developed.11 The original
studies on this assay indicated that the detection of se-rum HBsAg by Lumipulse HBsAg-HQ (HBsAg-HQ) could potentially assist in diagnosing occult
hepati-tis B infection12−15 and showed consistent results with
the qualitative and quantitative detection of serum HBsAg by Architect HBsAg-QT (HBsAg-QT) and
HB-sAg by Elecsys HBHB-sAg II (HBHB-sAg-E II).16,17 However,
the correlation between the serum HBsAg-HQ levels and the natural history and the liver tissue pathologi-cal states of chronic HBV infection have not yet been
adequately investigated.18
Objectives
The objective of this study is to further evaluate the agreement of serum HBsAg-HQ with HBsAg-QT and com-paratively investigate the effectiveness of serum HBsAg-HQ and HBsAg-QT in predicting the liver tissue pathological states of CHB patients.
Material and methods
Patients
A total of 275 Chinese patients with chronic HBV infec-tion who were hospitalized in the Shanghai Public Health Clinical Center of Fudan University (Shanghai, China) between August 2012 and July 2015 were prospectively enrolled, among whom 147 and 128 patients were hepatitis B e antigen (HBeAg)-positive and HBeAg-negative, respec-tively. The diagnoses of all the patients were in accordance with the standards set forth in the Asian-Pacific clini-cal practice guidelines for the management of hepatitis B
(2015 update).19 Patients with other forms of viral hepatitis,
drug-induced liver injuries, hereditary liver diseases, schis-tosomiasis japonica infection, autoimmune diseases, en-docrine and metabolic diseases, and blood system diseases were excluded. Patients who had been treated with inter-feron alpha, nucleosi(t)des, steroids, or licorices were also excluded.
All patients provided written consent prior to a liver biopsy, and all clinical investigations were conducted according to the principles expressed in the 1995 Declaration of Helsinki.
Histological assessment
Ultrasound-assisted liver biopsies were performed us-ing a 1-second liver biopsy needle (16G). The biopsies were collected immediately after the procedure and transferred into plastic tubes for freezing. One patholo-gist, who was blinded to all biochemical, serologic and virological parameters, was assigned to review all biopsy specimens. A biopsy length of at least 10 mm was required for inclusion in this study. The pathological diagnosis of liver tissues was performed independently by 1 expe-rienced pathologist. The pathological diagnosis referred
to the Scheuer standard,20 in which a grade is used
to de-scribe the intensity of the necro-inflammatory activity, and a stage is used as a measure of fibrosis and architec-tural alteration. The grades include 5 levels, G0−G4, and the stages include 5 levels, S0−S4.
Laboratory assays
Serum samples used for measurements were taken within 1 week before and 1 week after liver biopsy and stored at –40°C. Serum HBsAg-HQ and HBsAg-QT were quantified using chemiluminescence enzyme immunoassay (CLEIA) in a Lumipulse G1200 auto-mated analyzer (Fujirebio Inc., Tokyo, Japan) and che-miluminescence microparticle immunoassay (CMIA) in an Abbott Architect I2000 automated analyzer (Ab-bott Laboratories, Chicago, USA), respectively. The HB-sAg-HQ reagents were provided by Fujirebio Inc., and the HBsAg-QT reagents were purchased from Ab-bott Laboratories. The linear detection range of the HBsAg-HQ was from 5 to 150 000 mIU/mL. If the se-rum exceeded the upper detection limit, it was diluted 1,000 times and remeasured. Similarly, the linear detec-tion range of the HBsAg-QT was 50 to 250 000 mIU/mL, and if the serum exceeded the upper detection limit, it was diluted 500 times and remeasured.
The serum HBeAg was measured using CMIA Abbott Architect I2000 automated analyzer, with a lower detec-tion limit of 1 S/CO. The serum HBV DNA was measured using Bio-Rad Icycler PCR System (Bio-Rad Laboratories, Inc., USA), and the polymerase chain reaction (PCR) kits were obtained from Qiagen Shenzhen Co. Ltd. (Shen-zhen, China). The linear detection range of HBV DNA
Statistical analysis
Statistical analyses were performed using MedCalc v. 15.1 (MedCalc Software, Broekstraat, Mariakerke, Belgium). A paired-samples t-test was used to compare the differ-ences between the serum HBsAg-HQ and HBsAg-QT. Pearson correlation, linear regression analysis and Bland-Altman plots were used to evaluate the agreement between the HBsAg-HQ and HBsAg-QT quantitation. Spearman’s correlation analysis was used to analyze the correlation of the serum HBsAg-HQ and HBsAg-QT levels with the liver tissue pathological grade and stage. The receiver op-erating characteristic (ROC) curve was used to assess the effectiveness of serum HBsAg-HQ and HBsAg-QT for predicting the different liver tissue pathological states. The paired-samples DeLong non-parametric test was used to compare the differences in the area under the ROC curve (AUC) between the serum HBsAg-HQ and HBsAg-QT for predicting the same liver tissue pathological states. A 2-sided p-value of less than 0.05 was considered to be significant.
Results
Clinical characteristics of the patients
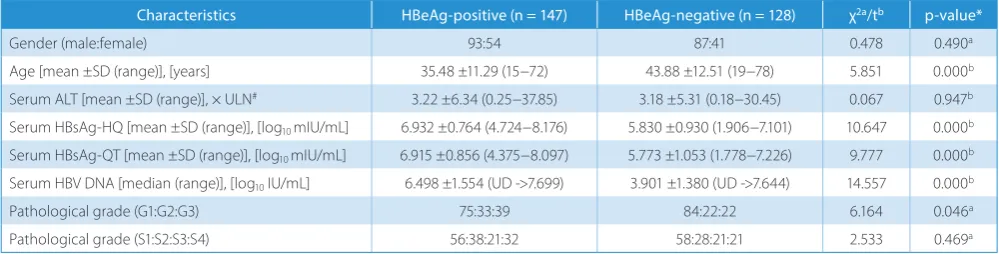
There was no significant difference in the male-to-fe-male ratio (p = 0.490) between the HBeAg-positive and HBeAg-negative patients; however, there was a signifi-cant difference in the average age (p = 0.000) between the HBeAg-positive and HBeAg-negative patients. The differ-ence in alanine transaminase (ALT) (p = 0.947) between the HBeAg-positive and HBeAg-negative patients was not statistically significant. The differences in the serum HBsAg-HQ, HBsAg-QT and HBV DNA (all p = 0.000) be-tween the HBeAg-positive and HBeAg-negative patients were all statistically significant. There was a significant difference (p = 0.046) in the frequency of the different pathological grades, but there was no significant difference (p = 0.469) in the frequency of the different pathological stages between the HBeAg-positive and HBeAg-negative patients (Table 1).
In the HBeAg-positive patients, the serum HBsAg-HQ and HBsAg-QT had a significant negative correlation with the serum ALT (r = –0.258; p = 0.002 and r = –0.254; p = 0.002). In the HBeAg-negative patients, the serum HBsAg-HQ and HBsAg-QT did not have a significant correlation with the serum ALT (r = –0.094; p = 0.291 and r = –0.067; p = 0.454) (Fig. 1A−D). In both the HBeAg-positive and HBeAg-negative patients, the serum HBsAg-HQ and HBsAg-QT levels were significantly positively correlated with the serum HBV DNA (r = 0.524; p = 0.000 and r = 0.501; p = 0.000 in the HBeAg-positive patients, and r = 0.350; p = 0.000 and r = 0.390; p = 0.000 in the HBeAg-negative patients) (Fig. 2A−D).
Comparison between HBsAg-HQ
and HBsAg-QT levels
Regardless of serum HBeAg state and HBsAg levels, there was no significant difference between the serum HBsAg-HQ and HBsAg-QT (p = 0.691). Grouping the pa-tients according to serum HBeAg state and HBsAg levels showed that there were no significant differences between serum HBsAg-HQ and HBsAg-QT in patients with both HBeAg-positive (p = 0.853) and HBeAg-negative (p = 0.647) and in patients with both higher HBsAg levels (HBsAg-QT ≥100 000 mIU/mL) (p = 0.942) and lower HBsAg levels (HBsAg-QT <100 000 mIU/mL) (p = 0.089) (Table 2).
Correlation and agreement
between HBsAg-HQ and HBsAg-QT
Independent of the serum HBeAg state and the HBsAg levels, the serum HBsAg-HQ had a significantly posi-tive correlation with HBsAg-QT (r = 0.955; p = 0.000) (Fig. 3A, Table 3). The linear regression analysis showed that HBsAg-HQ = 0.892 + 0.866 × HBsAg-QT (t = 53.087; p = 0.000). The Bland-Altman analysis showed that, com-pared to the serum QT levels, the serum
HBsAg-HQ levels had an upward bias of 0.04 log10mIU/mL with
a 95% limit of agreement (LOA) of –0.61 to 0.69 mIU/mL. The disagreement rates of ≤95% LOA and ≥95% LOA were 0.73% (2/275) and 2.91% (8/275), respectively, and that the
Table 1. Clinical characteristics of the patients according to their serum HBeAg state
Characteristics HBeAg-positive (n = 147) HBeAg-negative (n = 128) χ2a/tb p-value*
Gender (male:female) 93:54 87:41 0.478 0.490a
Age [mean ±SD (range)], [years] 35.48 ±11.29 (15−72) 43.88 ±12.51 (19−78) 5.851 0.000b
Serum ALT [mean ±SD (range)], × ULN# 3.22 ±6.34 (0.25−37.85) 3.18 ±5.31 (0.18−30.45) 0.067 0.947b
Serum HBsAg-HQ [mean ±SD (range)], [log10 mIU/mL] 6.932 ±0.764 (4.724−8.176) 5.830 ±0.930 (1.906−7.101) 10.647 0.000b
Serum HBsAg-QT [mean ±SD (range)], [log10 mIU/mL] 6.915 ±0.856 (4.375−8.097) 5.773 ±1.053 (1.778−7.226) 9.777 0.000b
Serum HBV DNA [median (range)], [log10 IU/mL] 6.498 ±1.554 (UD ->7.699) 3.901 ±1.380 (UD ->7.644) 14.557 0.000b
Pathological grade (G1:G2:G3) 75:33:39 84:22:22 6.164 0.046a
Pathological grade (S1:S2:S3:S4) 56:38:21:32 58:28:21:21 2.533 0.469a
overall disagreement rate was 3.64% (10/275) between the serum HBsAg-HQ and HBsAg-QT (Fig. 3B, Table 3).
In the HBeAg-positive patients, the serum HBsAg-HQ had a significantly positive correlation with HBsAg-QT
(r = 0.913; p = 0.000) (Fig. 1C, Table 3), and HBsAg-HQ = 1.296 + 0.815 × HBsAg-QT (t = 26.929; p = 0.000). The overall disagreement rate was 2.72% (4/147) between the serum HBsAg-HQ and HBsAg-QT (Fig. 1D, Table 3).
Fig. 1. Correlations of the serum HBsAg-HQ and HBsAg-QT with serum ALT in HBeAg-positive (A, B) and HBeAg-negative (C, D) patients
Fig. 2. Correlations of the serum HBsAg-HQ and HBsAg-QT with serum HBV DNA in HBeAg-positive (A, B) and HBeAg-negative (C, D) patients
r = –0.258
p = 0.002 r = –0.254p = 0.002
r = –0.094
p = 0.291 r = –0.067p = 0.454
r = –0.524 p = 0.000
r = 0.501 p = 0.000
r = 0.350
In HBeAg-negative patients, the serum HBsAg-HQ had a significantly positive correlation with HBsAg-QT (r = 0.959; p = 0.000) (Fig. 1E, Table 3); HBsAg-HQ = 0.963
+ 0.843 × HBsAg-QT (t = 37.740; p = 0.000). The over-all disagreement rate was 4.69% (6/128) between serum HBsAg-HQ and HBsAg-QT (Fig. 1F, Table 3).
Table 2. Comparison between the serum HBsAg-HQ and HBsAg-QT levels
Study population N HBsAg-HQ (±SD) HBsAg-QT (±SD) t-test p-value
Overall 275 6.419 ±1.007 6.383 ±1.109 0.397 0.691
HBeAg-positive 147 6.932 ±0.764 6.915 ±0.856 0.185 0.853
HBeAg-negative 128 5.830 ±0.930 5.773 ±1.053 0.459 0.647
HBsAg-QT ≥5.000 log10 mIU/mL 244 6.655 ±0.752 6.660 ±0.790 0.072 0.942
HBsAg-QT <5.000 log10 mIU/mL 31 4.564 ±0.823 4.206 ±0.806 1.732 0.089
The measurement units for HBsAg-HQ and HBsAg-QT were both log10 mIU/mL.
Fig. 3. Correlation and agreement between the serum HBsAg-HQ and HBsAg-QT
The measurement units of HBsAg-HQ and HBsAg-QT were both log10 mIU/mL. A, C and E show the scatter diagrams of the correlation between serum
HBsAg-HQ and HBsAg-QT in the overall, HBeAg-positive and HBeAg-negative patients; B, D and F show the Bland–Altman plots of the agreement between the serum HBsAg-HQ and HBsAg-QT in the overall, HBeAg-positive and HBeAg-negative patients, in which the upper and lower horizontal solid lines represent the upper and lower limits of the 95% LOA, respectively, and the middle horizontal solid lines represent the average of the serum HBsAg-HQ and HBsAg-QT difference. The horizontal dotted lines represent an average value of 0 for the serum HBsAg-HQ and HBsAg-QT differences.
r = 0.955 p = 0.000
r = 0.913 p = 0.000
r = 0.959 p = 0.000
average
average
average
mean
In patients with higher HBsAg levels (HBsAg-QT ≥100 000 mIU/mL), the serum HBsAg-HQ had a sig-nificantly positive correlation with HBsAg-QT (r = 0.929; p = 0.000) (Table 3), such that HBsAg-HQ = 0.762 + 0.885 × HBsAg-QT (t = 39.150; p = 0.000). The overall disagreement rate was 0.25% (6/244) between the serum HBsAg-HQ and HBsAg-QT levels (Table 3). In patients with lower HBsAg levels (HBsAg-QT <100 000 mIU/mL), the serum HBsAg-HQ had a significantly positive cor-relation with HBsAg-QT (r = 0.861; p = 0.000) (Table 3), with HBsAg-HQ = 0.869 + 0.879 × HBsAg-QT (t = 9.098; p = 0.000). The overall disagreement rate was 6.45% (2/31) between the serum HBsAg-HQ and HBsAg-QT (Table 3).
Correlation of HBsAg-HQ and HBsAg-QT
with pathological grade and stage
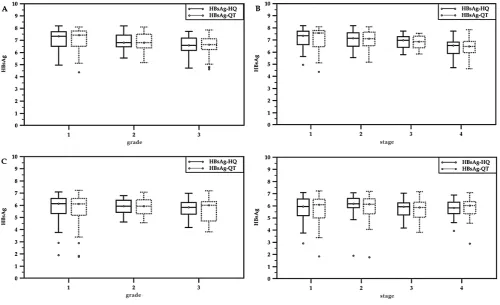
In HBeAg-positive patients, the serum HBsAg-HQ and HBsAg-QT were significantly negatively correlated with the
pathological grade (rs = –0.298; p = 0.000 and rs = –0.320;
p = 0.000, respectively) and stage (rs = –0.366; p = 0.000
and rs = –0.373; p = 0.000, respectively) (Fig. 4A,B).
In HBeAg-negative patients, the serum HBsAg-HQ and HBsAg-QT levels were not significantly correlated with the
pathological grade (rs = –0.127; p = 0.155 and rs = –0.073;
p = 0.411, respectively) and stage (rs = –0.045; p = 0.615 and
rs = –0.011; p = 0.903, respectively) (Fig. 4 C,D).
Table 3. Pearson correlation and agreement between the serum HBsAg-HQ and HBsAg-QT
Study population N r p-value Bias 95% LOA Inconsistency rate (%)
≤95% LOA ≥95% LOA Sum
Overall 275 0.955 0.000 0.04 –0.61−0.69 2/275(0.73) 8/275(2.91) 10/275(3.64)
HBeAg-positive 147 0.913 0.000 0.02 –0.67−0.70 2/147(0.68) 3/147(2.04) 4/147(2.72)
HBeAg-negative 128 0.959 0.000 0.06 –0.55−0.66 1/128(0.78) 5/128(3.91) 6/128(4.69)
HBsAg-QT ≥5.000 244 0.929 0.000 –0.01 –0.58−0.57 2/244(0.82) 4/244(0.16) 6/244(0.25)
HBsAg-QT <5.000 31 0.861 0.000 0.36 –0.49−1.20 0/31(0.00) 2/31(6.45) 2/31(6.45)
The measurement units forHBsAg-HQ and HBsAg-QT were both log10 mIU/mL; bias − the average of serum HBsAg-HQ and HBsAg-QT differences;
LOA − limit of agreement.
Fig. 4. Correlation of the serum HBsAg-HQ and HBsAg-QT levels with the liver tissue pathological grade and stage
The measurement units of HBsAg-HQ and HBsAg-QT were both log10 mIU/mL. The box-plots represent the serum distributions of HQ and
HBsAg-QT in different pathological grades and stages in the HBeAg-positive (A, B) and HBeAg-negative patients (C, D), in which the top and bottom of the box indicates the upper and lower quartile, and the horizontal line in the box indicates the median. The upper and lower horizontal lines outside the box indicate the 95% quintile, and the circle indicates the extreme value.
grade
grade
stage
Performance of HBsAg-HQ and HBsAg-QT
in predicting pathological states
In HBeAg-positive patients, all AUCs of the serum HB-sAg-HQ and HBsAg-QT for predicting the pathological grades ≥G2 and ≥G3, and stages ≥S2, ≥S3 and ≥S4 were significantly greater than the area under the diagonal refer-ence line (all p < 0.01). Of these, only the AUCs of serum HBsAg-HQ and HBsAg-QT for predicting pathologi-cal stage ≥S3 and ≥S4 were >0.70 (Table 4, Fig. 5). In the HBeAg-negative patients, all the AUCs of serum HBsAg-HQ and HBsAg-QT for predicting pathological grades ≥G2 and ≥G3, and stages ≥S2, ≥S3 and ≥S4 were not signifi-cantly greater than the area under diagonal reference line (all p > 0.05) (Table 4).
In HBeAg-positive patients there were no significant differences for predicting all the same pathological states
(all p > 0.05) between the AUCs of the serum HBsAg-HQ and HBsAg-QT (Table 4). In the HBeAg-negative patients, there were no significant differences for predicting the same pathological states except for predicting the pathological stage ≥S4 between the AUCs of serum HBsAg-HQ and HB-sAg-QT (p = 0.046 for predicting the pathological stage ≥S4, p > 0.05 for predicting the other pathological states) (Table 4).
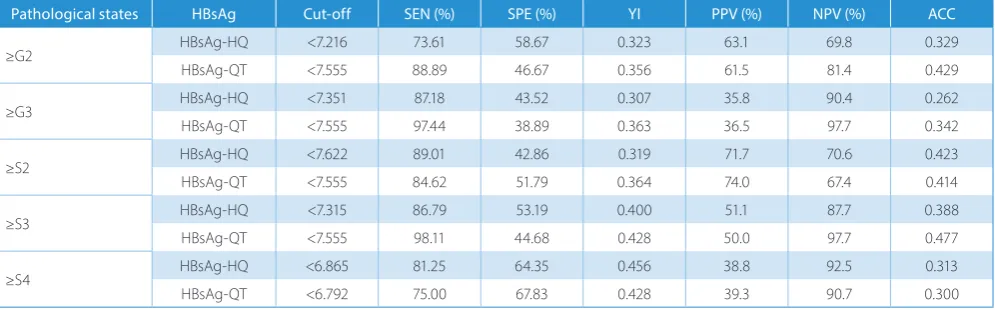
The optimal cut-offs of serum HBsAg-HQ and HBsAg-QT
for predicting a pathological grade ≥G3 were < 2.244 × 10⁷
mIU/mL and < 3.589 × 10⁷ mIU/mL, respectively, and the
corresponding sensitivity, specificity were 87.18% and 97.44%, and 43.52% and 38.89%, respectively. The optimal cut-offs of serum HBsAg-HQ and HBsAg-QT for
predict-ing the pathological stage ≥S4 were < 7.328 × 10⁶ mIU/mL
and < 6.194 × 10⁶ mIU/mL, respectively, and the
corre-sponding sensitivity, specificity were 81.25% and 75%, and 64.35% and 67.83%, respectively (Table 5).
Table 4. AUCs of serum HBsAg-HQ and HBsAg-QT for predicting the different liver tissue pathological states Pathological
states HBsAg
HBeAg-positive HBeAg-negative
AUC* SE# Z^ p-value 95% CI AUC* SE# Z^ p-value 95% CI
≥G2 HBsAg-HQ 0.651
a 0.046 3.290 0.001 0.568~0.727 0.573f 0.051 1.425 0.154 0.482~0.660
HBsAg-QT 0.670a 0.045 3.755 0.000 0.588~0.745 0.547f 0.052 0.781 0.435 0.451~0.629
≥G3 HBsAg-HQ 0.686
b 0.047 3.957 0.000 0.604~0.760 0.584g 0.064 1.317 0.188 0.493~0.671
HBsAg-QT 0.684b 0.046 4.038 0.000 0.602~0.758 0.558g 0.068 0.778 0.437 0.463~0.641
≥S2 HBsAg-HQ 0.659
c 0.049 3.266 0.001 0.576~0.735 0.492h 0.054 0.145 0.885 0.402~0.582
HBsAg-QT 0.660c 0.050 3.213 0.001 0.577~0.736 0.514h 0.053 0.156 0.876 0.418~0.598
≥S3 HBsAg-HQ 0.712
d 0.042 5.045 0.000 0.632~0.784 0.572i 0.052 1.391 0.164 0.481~0.659
HBsAg-QT 0.720d 0.041 5.327 0.000 0.640~0.791 0.540i 0.053 0.645 0.519 0.444~0.623
≥S4 HBsAg-HQ 0.739
e 0.046 5.159 0.000 0.660~ 0.808 0.552j 0.064 0.810 0.418 0.461~0.640
HBsAg-QT 0.745e 0.045 5.476 0.000 0.666~0.813 0.508j 0.065 0.058 0.954 0.414~0.593
95% CI − 95% confidence interval; * AUC − area under the ROC curve; # SE − standard error; Z^ – independent samples DeLong non-parametric test; a-j paired-samples DeLong non-parametric test; a Z = 1.005, p = 0.315; b Z = 0.071, p = 0.943; c Z = 0.034, p = 0.973; d Z = 0.391, p = 0.696; e Z = 0.238, p = 0.812; f Z = 1.511, p = 0.131; g Z = 1.131, p = 0.258; h Z = 0.211, p = 0.833; i Z = 1.826, p = 0.068; j Z = 1.992, p = 0.046.
Table 5. Optimal cut-offs of serum HBsAg-HQ and HBsAg-QT for predicting different pathological states and the corresponding diagnostic parameters in HBeAg-positive patients
Pathological states HBsAg Cut-off SEN (%) SPE (%) YI PPV (%) NPV (%) ACC
≥G2 HBsAg-HQ <7.216 73.61 58.67 0.323 63.1 69.8 0.329
HBsAg-QT <7.555 88.89 46.67 0.356 61.5 81.4 0.429
≥G3 HBsAg-HQ <7.351 87.18 43.52 0.307 35.8 90.4 0.262
HBsAg-QT <7.555 97.44 38.89 0.363 36.5 97.7 0.342
≥S2 HBsAg-HQ <7.622 89.01 42.86 0.319 71.7 70.6 0.423
HBsAg-QT <7.555 84.62 51.79 0.364 74.0 67.4 0.414
≥S3 HBsAg-HQ <7.315 86.79 53.19 0.400 51.1 87.7 0.388
HBsAg-QT <7.555 98.11 44.68 0.428 50.0 97.7 0.477
≥S4 HBsAg-HQ <6.865 81.25 64.35 0.456 38.8 92.5 0.313
HBsAg-QT <6.792 75.00 67.83 0.428 39.3 90.7 0.300
The measurement units of HBsAg-HQ and HBsAg-QT were both log10 mIU/mL; SEN − sensitivity; SPE − specificity; YI − Youden index; PPV − positive
Discussion
Choi et al. confirmed that the qualitative results of serum HBsAg-HQ highly agreed with those of the serum HBsAg-QT, with a concordance rate of 99.8% (k = 1.00; 95% CI, 0.99−1.00). Of the 315 HBsAg-QT-positive samples, 314 were HBsAg-HQ-positive. Of the 685 HBsAg-QT-negative
samples, 684 were HBsAg-HQ-negative.16 Recently, Yang
et al. evaluated and compared the agreement of the qualita-tive and quantitaqualita-tive results of serum HBsAg-HQ with
HB-sAg-QT and HBsAg-EII.17 The results showed that of the
2,043 samples tested, 1,844 samples gave negative results for both HBsAg-HQ and HBsAg-QT, and 172 samples yield-ed positive results for both HBsAg-HQ and HBsAg-QT. Of the remaining 27 samples that had inconsistent HBsAg results, 3 were HBsAg-QT-positive and 24 were HBsAg- -HQ-positive. Among these, none of the 3 HBsAg-QT- -positive samples were subsequently confirmed to be posi-tive. Twenty of the 24 HBsAg-HQ-positive samples were confirmed to be positive, 3 were confirmed to be nega-tive and 1 gave an indeterminate result and therefore was excluded from the specificity calculation for HBsAg-HQ. The specificity was 99.84% for HBsAg-HQ and 99.84% for HBsAg-QT. Yang et al. also found that, of the 112 tested samples, HBsAg-HQ displayed an excellent cor-relation with both HBsAg-QT and HBsAg-EII (r = 0.985 and r = 0.990); the Bland-Altman analyses demonstrated that, compared to HBsAg-QT and HBsAg-EII, HBsAg-HQ
had an upward bias of 0.19 log10 IU/mL with a 95% LOA
of –0.01 to 0.39 log10 mIU/mL and 0.07 log10 IU/mL with
a 95% LOA of –0.12 to 0.25 log10 mIU/mL, respectively.17
In this study, the serum HBsAg-HQ was significantly cor-related with HBsAg-QT. The Bland-Altman analyses showed that, compared to the serum HBsAg-QT, the HBsAg-HQ
had a slight bias of 0.04 log10 mIU/mL with a 95% LOA
of –0.61 to 0.69 log10 mIU/mL; the overall disagreement rate
was 3.64%. Further analyses of the grouping according to the HBeAg state (HBeAg-positive and HBeAg-negative) and the HBsAg levels (higher HBsAg levels (HBsAg-QT ≥100 000 mIU/mL) and lower HBsAg levels (HBsAg-QT < 100 000 mIU/mL)) also showed similar results. This further dem-onstrated that the serum HBsAg-HQ levels were highly correlated and highly agreed with HBsAg-QT.
Seto et al. comparatively investigated the changes in the serum HBsAg-HQ and HBsAg-EII in different phases in the
natural history of chronic HBV infection.18 The changes
in the serum HBsAg-HQ in different phases were consis-tent with previous research based on the same criterion for the division of the natural history of chronic HBV
in-fection.5,6,21−23 Unexpectedly, the serum HBsAg-HQ levels
were significantly higher than the HBsAg-EII levels in ei-ther the immune tolerance or the activation phase of the HBeAg-positive patients. However, the serum HBsAg-HQ levels were similar to the HBsAg-EII levels in either the immune escape or control phase of the HBeAg-negative patients. However, the reason why the serum HBsAg-HQ levels in HBeAg-positive patients were significantly higher than HBsAg-E levels is not clear. The investigators specu-lated that this could possibly be due to the enhanced de-tection of minor viral populations with “a” determinant mutations in patients with higher viral loads. However, Yang et al. reported that the S gene mutations within the “a” determinant, such as T126A, T126S, Q129H, Q129R, T140S, and G145E, did not affect the correlation and agreement observed between the serum HBsAg-HQ and
HBsAg-QT and HBsAg-EII.17
In this study, regardless of the serum HBeAg state and HBsAg levels, the difference between the serum HBsAg-HQ and HBsAg-QT levels was not significant. Further analyses of the grouping according to the HBeAg state and HBsAg levels also showed similar results. Our results agreed with the study by Yang et al. but failed to find a se-rum HBsAg-HQ level that was not significantly higher
than HBsAg-QT.17 This result was not consistent with
the findings of a previous study conducted by Seto et al.18
For the cause-specific indexes, several studies have shown that serum HBsAg and HBV DNA in HBeAg-pos-itive patients and HBV DNA but HBsAg in HBeAg-negative patients are valuable in predicting liver tissue pathological
states.7,24–29 However, the predicable optimal
pathologi-cal state of serum HBsAg and HBVDNA in the HBeAg-positive patients was not consistent between the different
studies,7,24–27 although for the HBV DNA in the
HBeAg-negative patients, there was an agreement in the
pathologi-cal grade ≥G2 and stage ≥S2.28,29 The results of this study
were consistent with the findings by Cheng et al. and Jia
et al., but not those of Martinot-Peignoux et al., Xun et al.
and Seto et al.7,24–27 Furthermore, we did not observe
signif-icant differences in the AUCs for predicting the same liver tissue pathological states between the serum HBsAg-HQ and HBsAg-QT in the HBeAg-positive patients. This study further demonstrated that, in the HBeAg-positive patients, serum HBsAs for predicting the liver tissue pathological states was valuable. Importantly, the efficacies of serum HBsAg-HQ for predicting the liver tissue pathological states were highly consistent with those of HBsAg-QT.
The results of this study showed that, in HBeAg-positive patients, the optimal cut-off of serum HBsAg-HQ for
pre-dicting a pathological grade ≥G3 was < 7.351 log10 mIU/mL
(2.244 × 10⁷ mIU/mL), with a difference of –0.204 log10
mIU/mL (–0.625 mIU/mL) from HBsAg-QT. The corre-sponding sensitivity, specificity, and positive and negative predictive values were 87.18%, 43.52%, 35.8%, and 90.4%, respectively. The optimal cut-off of serum HBsAg-HQ
for predicting a pathological stage ≥S4 was < 6.865 log10
mIU/mL (7.328 × 10⁶ mIU/mL), with a difference of 0.073
log10 mIU/mL (1.183 mIU/mL) from HBsAg-QT.
The cor-responding sensitivity, specificity, and positive and nega-tive predicnega-tive values were 81.25%, 64.35%, 38.8%, and 92.5%, respectively. This suggests that, in HBeAg-positive patients, the optimal cut-offs of serum HBsAg-HQ for pre-dicting pathological grade ≥G3 and stage ≥S4 should be highly consistent with those of HBsAg-QT, and serum HBsAg-HQ and HBsAg-QT should be very valuable for predicting pathological grade ≥G3 and stage ≥S4.
In conclusion, this study further evaluated the agree-ment between the serum HBsAg-HQ and HBsAg-QT levels and comparatively investigated the effectiveness of serum HBsAg-HQ and HBsAg-QT in predicting the liver tissue pathological states of CHB. The results showed that the serum HBsAg-HQ was highly correlated and agreed with the HBsAg-QT in both the positive and HBeAg-negative patients, regardless of whether they presented with higher or lower HBsAg levels. Furthermore, serum HBsAg-HQ and HBsAg-QT had good predictive efficacy on the pathological grade ≥G3 and stage ≥S4 in HBeAg-positive patients, but did not have predictive efficacy on the pathological states in HBeAg-negative patients.
References
1. Deguchi M, Yamashita N, Kagita M, et al. Quantitation of hepatitis B surface antigen by an automated chemiluminescent microparti-cle immunoassay. J Virol Methods. 2004;115:217–222. doi:10.1016/j. jviromet.2003.10.002
2. Wong GLH, Chan HLY. Use of quantitative hepatitis B surface antigen with hepatitis B virus DNA in clinical practice. Clin Liver Dis. 2013;2:8–10. doi:10.1002/cld.165
3. Zhou B, Liu M, Lv G, et al. Quantification of hepatitis B surface anti-gen and e antianti-gen: Correlation between Elecsys and Architect assays.
J Viral Hepat. 2013;20:422–429. doi:10.1111/jvh.12044
4. Park Y, Hong DJ, Shin S, et al. Performance evaluation of new auto-mated hepatitis B viral markers in the clinical laboratory: Two quan-titative hepatitis B surface antigen assays and an HBV core-relat-ed antigen assay. Am J Clin Pathol. 2012;137:770–777. doi:10.1309/ AJCP8QDN7NAUXJFJ
5. Tan Z, Li M, Kuang X, et al. Clinical implications of hepatitis B surface antigen quantitation in the natural history of chronic hepatitis B virus infection. J Clin Virol. 2014;59:228–234. doi:10.1016/j.jcv.2014.01.013 6. Wang L, Zou ZQ, Wang K, et al. Role of serum hepatitis B virus mark-er quantitation to diffmark-erentiate natural history phases of HBV infec-tion. Hepatol Int. 2016;10:133–138. doi:10.1007/s12072-015-9657-6 7. Martinot-Peignoux M, Carvalho-Filho R, Lapalus M, et al.
Hepati-tis B surface antigen serum level is associated with fibrosis severity in treatment-naïve, e antigen-positive patients. J Hepatol. 2013;58: 1089–1095. doi:10.1016/j.jhep.2013.01.028
8. Goyal SK, Jain AK, Dixit VK, et al. HBsAg level as predictor of liver fibro-sis in HBeAg positive patients with chronic hepatitis B virus infection.
J Clin Exp Hepatol. 2015;5:213–220. doi:10.1016/j.jceh.2015.04.008 9. Moucari R, Marcellin P. Quantification of hepatitis B surface antigen:
A new concept for the management of chronic hepatitis B. Liver Int. 2011;31(Suppl 1):122–128. doi:10.1111/j.1478-3231.2010.02390.x 10. Tseng TC, Liu CJ, Yang HC, et al. Serum hepatitis surface antigen
lev-els help predict disease progression in patients with low hepatitis B virus loads. Hepatology. 2013;57:441–450. doi:10.1002/hep.26041 11. Matsubara N, Kusano O, Sugamata Y, et al. A novel hepatitis B virus
surface antigen immunoassay as sensitive ashepatitis B virus nucle-ic acid testing in detecting early infection. Transfusion. 2009;49:585– 595. doi:10.1111/j.1537-2995.2008.02026.x
12. Seto WK, Tanaka Y, Wong DK, et al. Evidence of serologic activity in chronic hepatitis B after surface antigen (HBsAg) seroclearance documented by conventional HBsAg assay. Hepatol Int. 2013;7:98– 105. doi:10.1007/s12072-012-9354-7
13. Seto WK, Tanaka Y, Wong DK, et al. Longitudinal profiles of highly sensitive hepatitis B surface antigen levels: Re-evaluation of HBsAg seroclearance. Liver Int. 2016;36:642–650. doi:10.1111/liv.12980 14. Shinkai N, Matsuura K, Sugauchi F, et al. Application of a newly
devel-oped high-sensitivity HBsAg chemiluminescent enzyme immunoas-say for hepatitis B patients with HBsAg seroclearance. J Clin Microbiol. 2013;51:3484–3491. doi:10.1128/JCM.00726-13
15. Duong LT, Coignard C. Evaluation of a new high sensitive, qualita-tive and quantitaqualita-tive Hepatitis B surface antigen assay. J Clin Virol.
2015;70(Suppl 1):S95.
16. Choi SJ, Park Y, Lee EY, et al. Performance evaluation of Lumipulse G1200 autoimmunoanalyzer for the detection of serum hepati-tis B virus markers. J Clin Lab Anal. 2013;27:204–206. doi:10.1002/ jcla.21584
17. Yang R, Song G, Guan W, et al. The Lumipulse G HBsAg-Quant assay for screening and quantification of the hepatitis B surface antigen.
J Virol Methods. 2016;228:39–47. doi:10.1016/j.jviromet.2015.11.016 18. Seto WK, Wong DK, Fung J, et al. Linearized hepatitis B surface
antigen and hepatitis B core-related antigen in the natural histo-ry of chronic hepatitis B. Clin Microbiol Infect. 2014;20:1173–1180. doi:10.1111/1469-0691.12739
19. Sarin SK, Kumar M, Lau GK, et al. Asian-Pacific clinical practice guide-lines on the management of hepatitis B: A 2015 update. Hepatol Int.
2016;10:1–98. doi:10.1007/s12072-015-9675-4
20. Brunt EM. Grading and staging the histopathological lesions of chronic hepatitis: The Knodell histology activity index and beyond.
Hepatology. 2000;31:241–246. doi:10.1002/hep.510310136 21. Cheng XD, Song LW, Fang LL, et al. Comparison of three
lumines-cent immunoassays for hepatitis B virus surface antigen quantifica-tion during the natural history of chronic hepatitis B virus infecquantifica-tion.
Clin Vaccine Immunol. 2014;21:1521–1527. doi:10.1128/CVI.00529-14 22. Suh SJ, Bae SI, Kim JH, et al. Clinical implications of the titer of serum
hepatitis B surface antigen during the natural history of hepatitis B virus infection. J Med Virol. 2014;86:117–123. doi:10.1002/jmv.23767 23. Zeng LY, Lian JS, Chen JY, et al. Hepatitis B surface antigen levels
during natural history of chronic hepatitis B: A Chinese perspective study. World J Gastroenterol. 2014;20:9178–9184. doi:10.3748/wjg.v20. i27.9178
26. Xun YH, Zang GQ, Guo JC, et al. Serum hepatitis B surface antigen quantification as a useful assessment for significant fibrosis in hep-atitis B e antigen-positive hepin hep-atitis B virus carriers. J Gastroenterol Hepatol. 2013;28:1746–1755. doi:10.1111/jgh.12304
27. Seto WK, Wong DK, Fung J, et al. High hepatitis B surface antigen levels predict insignificant fibrosis in hepatitis B e antigen positive chronic hepatitis B. PLoS One. 2012;7:e43087. doi:10.1371/journal. pone.0043087
28. Alam S, Ahmad N, Mustafa G, et al. Evaluation of normal or minimally elevated alanine transaminase, age and DNA level in predicting liver histological changes in chronic hepatitis B. Liver Int. 2011;31:824–830. doi:10.1111/j.1478-3231.2011.02491.x