RESEARCH ARTICLE
Validity of self-reported height
and weight for estimating prevalence
of overweight among Estonian adolescents: the
Health Behaviour in School-aged Children study
Katrin Aasvee
1*, Mette Rasmussen
2, Colette Kelly
3, Elvira Kurvinen
4, Mariano Vincenzo Giacchi
5and Namanjeet Ahluwalia
6Abstract
Background: Low to moderate agreement between self-reported and directly measured anthropometry is shown in studies for adults and children. However, this issue needs further evaluation during puberty, a period marked by several transitions. We examined the correspondence of BMI status based on self-reported versus measured anthro-pometric data among Estonian adolescents with a specific focus on gender and age differences.
Methods: Self-reported height and weight were determined in a national representative sample of Estonian school-children collected within the framework of the HBSC (health behaviour of school-aged school-children) survey. Self-reported and directly measured height and weight were collected from 3379 students (1071 aged 11, 1133 aged 13 and 1175 aged 15 years). The standardized HBSC questionnaire was used for collecting self-reported data; direct anthropomet-ric measures were taken after the HBSC questionnaires were completed. The accuracy of the self-reported values by age and gender groups were determined by comparing mean differences, Bland–Altman plots with limits of agree-ment, Kappa statistics, and by estimation of the sensitivity and positive predictive value for detecting overweight.
Results: Mean self-reported weight, height and body mass index (BMI) values were significantly lower than corre-sponding values obtained using direct measurements. Mean differences between self-reported and directly meas-ured weight, height and BMI were largest among 11-year-olds and smallest among students aged 15 years. Underes-timation of overweight prevalence (includes obese) showed a graded trend which decreased in older age groups; the difference was greater among girls than boys in all age groups. The mean underestimation of overweight prevalence based on self-reported anthropometry was 3.6 percentage points. The positive predictive value was 72.3 % for boys and 63.4 % for girls.
Conclusion: A distinct age-related pattern in underestimation of weight, height and prevalence of overweight was found; the bias decreased with increasing age. The mean underestimation of overweight prevalence based on self-reports was small, 3.6 %. Self-reported height and weight remain the method of choice in large surveys for practical and logistical reasons.
Keywords: Height/weight, Body mass index, Self-reports, Validity, Overweight, Puberty
© 2015 Aasvee et al. This article is distributed under the terms of the Creative Commons Attribution 4.0 International License (http://creativecommons.org/licenses/by/4.0/), which permits unrestricted use, distribution, and reproduction in any medium, provided you give appropriate credit to the original author(s) and the source, provide a link to the Creative Commons license, and indicate if changes were made. The Creative Commons Public Domain Dedication waiver (http://creativecommons.org/ publicdomain/zero/1.0/) applies to the data made available in this article, unless otherwise stated.
Open Access
*Correspondence: katrin.aasvee@tai.ee
1 Department of Chronic Diseases, National Institute for Health
Development, 42 Hiiu Street, 11619 Tallinn, Estonia
Background
Overweight and obesity in childhood continue to be public health concerns due to high prevalence, short and long-term adverse health consequences and increased health-care-costs [1–3]. Overweight and obesity are usu-ally defined based on the body mass index (BMI) in rela-tion to internarela-tional reference standards [4, 5]. Although BMI is ideally based on actual measurement of height and weight, in large-scale epidemiological studies this is often not feasible. Thus self-reported values of height and weight are often used in national surveys in children [6] as well as in adults [7]. Validation studies comparing self-reported and direct measurements of height and weight indicate that both among adults and adolescents self-reports underestimate weight and BMI [8–15] while height values are often over-reported [11, 15–17]. Also, it is generally documented that the bias in self-reported weight and BMI is greater in females [13, 16, 18], in older people [13, 19] and in overweight subjects [8, 13, 20, 21]. The impact of age on validity of self-reported height and weight through adolescence is not clear because studies often report findings on a single age group [11, 21–24] or on a wide age-range [15, 20]. Two recent studies of ado-lescents show contradictory results on the influence of age on bias in self-reported weight [10, 18].
The 2009/2010 Health Behaviour in School-aged Children (HBSC) survey was conducted in nation-ally representative samples of 11-, 13-, and 15-year-old schoolchildren in more than 40 countries [25] using a standardized protocol and included self-reported data on age, height and weight. The age range sampled in the HBSC survey covers the period of rapid growth, and physical and emotional development [26]. Physical devel-opment in the years 11–15 is gender-specific, thus it is necessary to analyse the self-reported weight and height data by age-gender groups. To our knowledge, only two peer-reviewed validation studies on self-reported height and weight have been published on HBSC study samples. In a Welsh study of 15–17 year-old students a significant underestimation of weight and overweight prevalence (based on IOTF cut-offs; sample size was 418 students) was found: overweight prevalence was 6.4 percentage points lower when based on self-reported data. No gen-der differences were shown and the age-range was too narrow to evaluate differences by age [21]. In another validation study, based on a subset of Portuguese HBSC survey participants, the prevalence of overweight and obesity (based on IOTF cut-offs; sample size was 462 students) did not differ significantly when based on self-reports compared to direct measurements of height and weight [27]. However, the sample was too small to make conclusions regarding the effect of age on bias in BMI estimates.
In other adolescents’ surveys, the underestimation of overweight prevalence based on self-reported data compared to direct measures ranges from 2.6 % (18; overweight prevalence based on German age- and gen-der-specific cut-offs; sample size was 3468) to 15 % (23; overweight prevalence as determined based on IOTF cut-offs, sample size was 499 students] in European samples. Thus, overweight prevalence is quite different depending on use of self-reported or direct measurements to com-pute the BMI. In the Estonian HBSC 2005/2006 survey [6], in which BMI estimates were based on self-reports, the overweight prevalence among 15-year old girls was more than twofold lower than in the Countrywide Integrated Non-communicable Diseases Intervention (CINDI) monitoring which was based on direct measure-ments of height and weight (Unpublished observation by L. Suurorg, I. Tur; estimation of overweight was based on BMI ≥ 24 kg/m2). This finding motivated us to conduct
the first of its kind, large-scale validation study among a nationally representative sample of Estonian youth (11– 15 years old).
The overall aim of this study was to examine the agree-ment of BMI status based on self-reported versus meas-ured anthropometric data in the 2009/2010 HBSC survey in Estonia. A specific focus of this paper was to evaluate age and gender based differences in the magnitude of bias in self-reported (versus measured) anthropometric data and respective prevalence of overweight.
Methods
Subjects
height and weight were available for 4171 students (99 %) and self-reported measures for 3424 students (81 %). Data with both self-reported and direct measurements of weight and height were used in the analysis for this paper. This sample included 3379 adolescents: 1071 aged 11 years (479 boys, 592 girls), 1133 aged 13 years (560 boys, 573 girls) and 1175 aged 15 years (555 boys, 620 girls).
Anthropometric measures
The questions for recording weight and height were as follows: “How much do you weigh without clothes?” and “How tall are you without shoes?” Direct measure-ments of height and weight were taken using standard-ized portable equipment (Tanita HD365 for weighing and Tanita HR001 Leicester for height measures) and the guidelines of the CINDI Programme were followed [28]. The students were informed that their height and weight were to be measured after completing the HBSC survey. Two trained technicians took the measurements in the classroom when receiving the completed ques-tionnaire from the student and registered values on the cover of the questionnaire. Majority (57 %) of the study technicians were healthcare professionals and remain-ing were university students. All technicians were pro-vided detailed instruction on obtaining height and weight measurements using the same protocol. Height and weight were measured without shoes with a preci-sion of 0.1 cm and 0.01 kg, respectively. Measurements were taken in the corner of the classroom, where only the student concerned was present. Adolescents were weighed with light indoor clothing and were asked to take off heavier accessories and remove personal items from their pockets. Standard weights for individual items of indoor clothing were collected earlier in a pilot study among 27 students. The list of weights of clothing in grams usually worn by students (see the Additional file 1) was used. The total weight of a student and weight of clothes were registered on the cover of the completed questionnaire from where the student weight without clothes could be estimated. Data collection was made by two groups of technicians: one was coordinated by National Institute for Health Development, Tallinn (10 technicians) and other by University of Tartu, Depart-ment of Public Health (11 technicians). After group training 5 sets of the portable Tanita equipment was provided to each group.
Body mass index (BMI) was calculated for self-reports and direct measures as weight in kg divided by the square of height in meters. Underweight, overweight and obe-sity were determined using the standardized age- and gender-specific IOTF (International Obesity Task Force) BMI cut-off points [4, 29]. In the present analysis the
overweight category included both overweight and obese adolescents. The prevalence of obesity was too low (3.5 %) to conduct separate analyses by age and gender groups.
Ethical approval
The survey was anonymous and voluntary, confidenti-ality of data was guaranteed. Parents and children were informed about the survey through the class-teachers before the study. School headmasters and representatives of parents gave written consent to participation prior to the survey day. Tallinn Medical Research Ethics Com-mittee approved the questionnaire and research protocol (Application No. 901, Decision No. 1818, October 15th, 2009).
Statistical analyses
As the validity of self-reported weight and height may differ by gender and age, separate analyses were con-ducted by gender and age group. SPSS version 15 and MedCalc version 12.4 were used for statistical analyses. Paired T test was used for comparisons of mean values, to evaluate associations between certain self-reported and measured values, Pearson’ correlation coefficients were calculated [30], and tests for one proportion were used to compare proportions [31]. Bland–Altman plots [32] were used to assess agreement between height and weight based on direct measurements (height-M, weight-M, respectively) and self-reported values (height-SR, weight-SR, respectively). Differences between measured and reported height and weight were plotted against the arithmetic mean of respective anthropometric values. Standard deviation (SD) of the differences was estimated and the 95 % limits of agreement (LOA) were calculated as the mean difference plus or minus 1.96 SD of the dif-ference. The 95 % confidence intervals for upper and lower LOA were found.
Agreement of classification of underweight, normal weight and overweight based on measured and self-reported height and weight were assessed by weighted Kappa statistic [30]. Kappa values less than 0.20 are con-sidered as “poor”, between 0.21 and 0.40 as “fair” agree-ment, between 0.41 and 0.60 as “moderate” agreeagree-ment, between 0.61 and 0.80 as “good” agreement, and between 0.81 and 1.00 as “excellent” agreement. Analyses of sen-sitivity and specificity when using self-reports for esti-mation of overweight status were performed [33] and positive and negative predictive values were determined [34].
Results
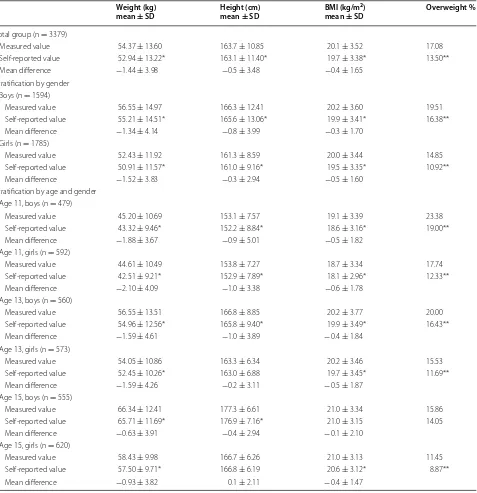
by gender and age are shown in Table 1. In almost all groups mean self-reported anthropometric variables were significantly lower than the measured values; the differences were not-significant for height data in 13- and 15-year-old girls and for BMI in boys aged 15.
The prevalence of overweight among 11–15-years-old schoolchildren based on self-reports was significantly lower compared to the prevalence using measured data in boys (16.4 versus 19.5 %, respectively; p = 0.026) and in girls (10.9 versus 14.9 % respectively; p < 0.001).
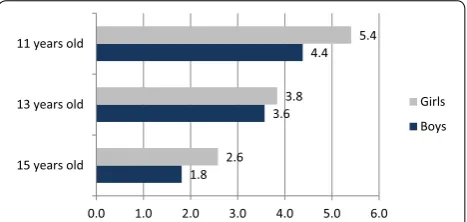
When age and gender were considered, overweight prevalence was underestimated by self-reports in all groups. The difference in percentage points was greatest among 11-year old girls and lowest among 15-year old boys. In all three age groups the differences were greater among girls. The differences between overweight status estimated using self-reported and measured weight and height values by age and gender are presented in Fig. 1.
Pearson correlation coefficients between self-reported and directly measured weight, height and BMI among boys were: 0.96, 0.95 and 0.88, respectively, and among girls 0.95, 0.95 and 0.89, respectively. By age and gender, the correlation coefficients were lowest in 11-year-old boys (0.94, 0.82 and 0.85, respectively) and girls (0.92, 0.90 and 0.85, respectively), and highest in 15-year-old boys (0.95, 0.91 and 0.90, respectively) and girls (0.93, 0.94 and 0.89, respectively). All correlations were strong and highly significant (p < 0.001).
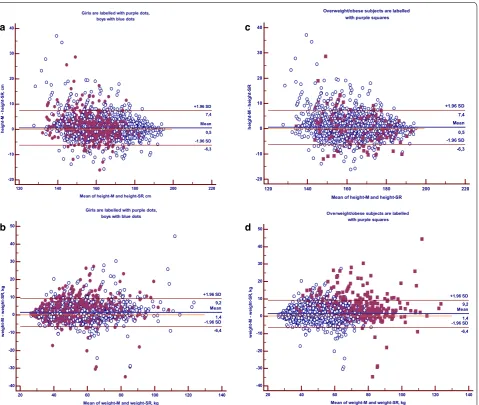
To evaluate agreement between directly measured and self-reported anthropometric values in total study group (n = 3379) Bland–Altman plots were plotted. In Fig. 2, the differences between measured and self-reported height (panels a and c) or weight (Fig. 2b, d) values were plotted against the average of the measured and self-reported height or weight data, respectively. 95 % limits of agreement (LOA) between the two methods for the whole sample are shown in the figures. The distribution pattern of the height and weight data plot was similar for boys and girls (Fig. 2a, b). The LOA values (±1.96 SD) by gender, not shown in the figures, for height data were:
−7.07 and 8.57 cm (boys); and: −5.41 and 6.10 cm (girls). The LOA values for weight were: −6.77 and 9.45 kg (boys); and: −5.98 and 9.02 kg (girls).
In the similar plot graphs for height and weight in pan-els c and d of Fig. 2 the data points of overweight sub-jects, estimated by BMI based on direct measurements of height and weight, are shown. Overweight subjects’ data points scatter homogeneously in the Bland–Altman plot for height (Fig. 2c). However, in the plot for weight, underestimation of weight status was observed for most of overweight participants (Fig. 2d). To characterize the level of agreement between measured and self-reported weight values among overweight subjects (n = 576) only
the LOA for two methods were estimated for overweight participants (panels not shown). The LOA values for height in this group (−6.6 and 7.2 cm) were quite similar to the whole group (−6.3 and 7.4 cm, Fig. 2c). Agreement between measured and self-reported weight data among overweight subjects was different compared to the whole group: LOA values among overweight subjects was −8.9 and 16.8 kg (mean difference was 4 kg) while in the whole group the corresponding data were −6.4 and 9.2 kg (mean difference was 1.4 kg) (Fig. 2d).
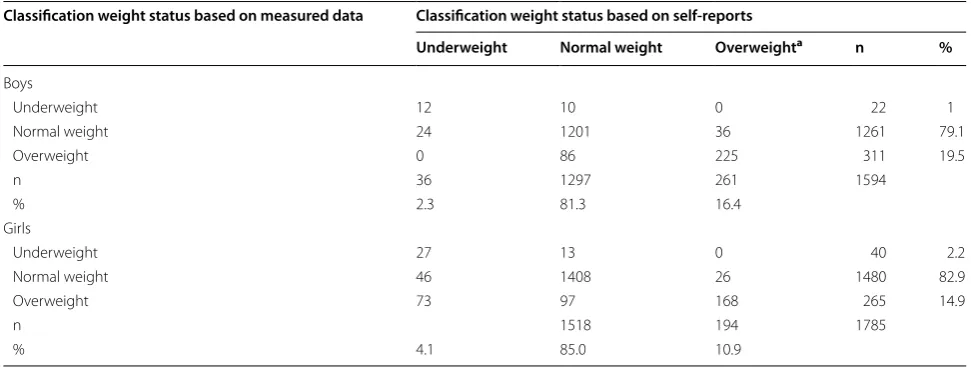
The differences in prevalence of the three weight status classes based on directly measured versus self-reported measurements are presented in Table 2. In both gen-ders overestimation of prevalence of underweight (for boys: by self-reports 2.3 % and by measured data 1.4 %, P = 0.0165; for girls: by self-reports 4.1 % and by meas-ured data 2.2 %, P < 0.0001) and underestimation of overweight (for boys 16.4 % versus 19.5 %, respectively; p = 0.0018; for girls 10.9 % versus 14.9 %, respectively; p < 0.0001) were found when BMI was based on self-reported values.
In the 3 × 3 contingency table (Table 2) includ-ing classifications of weight status categories based on directly measured and self-reported height and weight, the weighted Kappa statistics were calculated to assess the degree of agreement [30]. Kappa statistic for boys was 0.715 (95 % CI 0.67–0.76) and for girls 0.654 (95 % CI 0.61–0.70). By age and gender (data not shown) the weighted Kappa value was lowest among 13-year-old girls and highest among 15-year-old boys: 0.608 (95 % CI 0.52–0.70) and 0.721 (95 % CI 0.62–0.80), respectively.
Analysis of sensitivity and specificity of using self-reported data for estimation of overweight, showed that using BMI based on direct anthropometric measure-ments as the reference, the sensitivity of self-reported data for boys was 86.2 % and for girls 87.0 %, the speci-ficity was 93.5 and 93.9 %, respectively. The positive pre-dictive values for boys and girls were 72.3 and 63.4 %, respectively, and negative predictive value was 97.2 % for boys and 98.4 % for girls.
Discussion
of height through self-reporting is relatively small and unstable as compared to bias of weight values. Thus, despite instability in height biases in some studies the overweight prevalence based on self-reported BMI was underestimated in all of the above-cited studies. The
[image:5.595.62.539.114.607.2]Bland–Altman plots for weight and height in the whole sample and in overweight subjects only showed that most participants who were overweight based on actual meas-ured weight status, under-reported their weight; and this bias was not noticeable for height.
Table 1 Characteristics of measured and self-reported weight, height, BMI and prevalence of overweight by gender and age groups of schoolchildren
Mean difference was obtained by subtracting measured value from self-reported value Overweight category includes obese adolescents, the IOTF cut-offs were used * Significant difference from respective measured value; paired t-test, p < 0.001
** Significant difference from the prevalence of overweight based on measured data; test for one proportion, P < 0.05 Weight (kg)
mean ± SD Height (cm) mean ± SD BMI (kg/m
2)
mean ± SD Overweight %
Total group (n = 3379)
Measured value 54.37 ± 13.60 163.7 ± 10.85 20.1 ± 3.52 17.08 Self-reported value 52.94 ± 13.22* 163.1 ± 11.40* 19.7 ± 3.38* 13.50** Mean difference −1.44 ± 3.98 −0.5 ± 3.48 −0.4 ± 1.65
Stratification by gender Boys (n = 1594)
Measured value 56.55 ± 14.97 166.3 ± 12.41 20.2 ± 3.60 19.51 Self-reported value 55.21 ± 14.51* 165.6 ± 13.06* 19.9 ± 3.41* 16.38** Mean difference −1.34 ± 4.14 −0.8 ± 3.99 −0.3 ± 1.70
Girls (n = 1785)
Measured value 52.43 ± 11.92 161.3 ± 8.59 20.0 ± 3.44 14.85 Self-reported value 50.91 ± 11.57* 161.0 ± 9.16* 19.5 ± 3.35* 10.92** Mean difference −1.52 ± 3.83 −0.3 ± 2.94 −0.5 ± 1.60
Stratification by age and gender Age 11, boys (n = 479)
Measured value 45.20 ± 10.69 153.1 ± 7.57 19.1 ± 3.39 23.38 Self-reported value 43.32 ± 9.46* 152.2 ± 8.84* 18.6 ± 3.16* 19.00** Mean difference −1.88 ± 3.67 −0.9 ± 5.01 −0.5 ± 1.82
Age 11, girls (n = 592)
Measured value 44.61 ± 10.49 153.8 ± 7.27 18.7 ± 3.34 17.74 Self-reported value 42.51 ± 9.21* 152.9 ± 7.89* 18.1 ± 2.96* 12.33** Mean difference −2.10 ± 4.09 −1.0 ± 3.38 −0.6 ± 1.78
Age 13, boys (n = 560)
Measured value 56.55 ± 13.51 166.8 ± 8.85 20.2 ± 3.77 20.00 Self-reported value 54.96 ± 12.56* 165.8 ± 9.40* 19.9 ± 3.49* 16.43** Mean difference −1.59 ± 4.61 −1.0 ± 3.89 −0.4 ± 1.84
Age 13, girls (n = 573)
Measured value 54.05 ± 10.86 163.3 ± 6.34 20.2 ± 3.46 15.53 Self-reported value 52.45 ± 10.26* 163.0 ± 6.88 19.7 ± 3.45* 11.69** Mean difference −1.59 ± 4.26 −0.2 ± 3.11 −0.5 ± 1.87
Age 15, boys (n = 555)
Measured value 66.34 ± 12.41 177.3 ± 6.61 21.0 ± 3.34 15.86 Self-reported value 65.71 ± 11.69* 176.9 ± 7.16* 21.0 ± 3.15 14.05 Mean difference −0.63 ± 3.91 −0.4 ± 2.94 −0.1 ± 2.10
Age 15, girls (n = 620)
Measured value 58.43 ± 9.98 166.7 ± 6.26 21.0 ± 3.13 11.45
The specific focus of the current study was to deter-mine differences in the magnitude of bias in self-reported weight, height and BMI by age and gender during the adolescent years. A distinct age-related pattern in under-reporting of weight and height as well as estimated prev-alence of overweight was found. The mean differences between self-reported and directly measured weight and height were greatest among 11-year-olds and low-est for those aged 15. Our results are consistent with a recent validation study where age-groups 11–13 and 14–17 years were compared and a greater underestima-tion of weight among younger children was found [18]. However, in a study of Chinese adolescents the opposite result was shown: an increasing underestimation of self-reported weight and BMI with increasing age [10]. One reason of this discrepancy may be due to differences in analytical methods applied. In terms of reporting bias in relation to gender, we found underestimation of weight and thus overweight prevalence in all age groups in both genders. The bias tended to be larger among girls as reported also in some previous studies [16, 18, 22, 37]. The causes of under-reporting weight by adolescents can be varied. Adolescents often report a desire to weigh less, as it is a social norm to be thin [18, 38], and this desire is greater among girls [38]. Besides the subjective cause there can also be some objective reasons for under-reporting of anthropometric values by adolescents, e.g. children can be unaware of their measurements. Students generally measure themselves infrequently and may only remember outdated values [14, 17, 39, 40]. This must be considered in particular for children during the period of pubertal growth spurt and weight gain [14, 26].
The difference between overweight prevalence based on self-reported versus directly measured BMI varied among European countries from −2.3 to −15 %; these
studies used varying protocols to measure weight [18,
23]. In the study with the lowest bias [18] the direct
measurements were taken in underwear and self-reported weight and height were asked face-to-face prior to the direct measurements. However, in the study with the largest difference between overweight prevalence based on self-reported and directly measured BMI [23], the weighing procedure involved subtracting 1 kg from each child’s weight to account for clothes worn (age was not considered). Also, the direct measurements were taken 3 months later than self-reported data. Thus, another source of bias in BMI and overweight preva-lence in validation studies is study protocols. Differences in when and how direct measurements (in light clothing versus underwear only) are taken and whether correc-tions for cloths are used can impact on validation with self-report measures [18, 23].
It was considered that accuracy of reporting height and weight may be higher when students are aware that direct measurements will be taken afterwards [8, 14]. However, in a recent study in adults this hypothesis was not con-firmed [41]. This needs to be examined further for ado-lescents in future investigations.
In the current study, Bland–Altman plots demon-strated minimal mean differences between the two methods (direct versus self-reported measurements) for height (0.5 cm). The mean difference between the meth-ods for weight was notable (1.5 kg), suggesting a system-atic under-reporting of weight.
Classifications of underweight, normal weight and overweight, based on measured and self-reported BMI have shown good agreement based on the Kappa statis-tics. In the current study, sensitivity, i.e. the proportion of actual overweight (includes obese) adolescents who were classified correctly using self-reported BMI, was 86.6 % (86.2 % for boys and 87 % for girls). This is higher than shown in previous validation studies, where the sensitiv-ity values varied between 52.2 and 74.8 % [10, 14, 18, 21,
36]. In the present study specificity was 93.7 %, demon-strating that a certain number (~6 %) of non-overweight students were incorrectly classified as overweight using BMI based on self-reported data. Direct comparison of sensitivity and specificity values with other studies is not feasible because national cut-off points for the BMI cate-gories were often used [14, 15, 18] and/or the values were presented for overweight and obese subjects separately [14, 15, 21, 36]. In previous studies positive predictive value, indicating the likelihood of diagnosing overweight accurately by self-reports, was rarely reported [10, 36]. In the present study the positive predictive value was 72 % for boys and 63 % for girls. This finding is in accordance with the observed greater bias of overweight prevalence among girls in all age groups.
This study has certain strengths and limitations. An advantage of the current survey is using a representative 1.8
3.6 4.4
2.6 3.8
5.4
0.0 1.0 2.0 3.0 4.0 5.0 6.0 15 years old
13 years old 11 years old
Girls Boys
[image:6.595.58.292.90.201.2]study sample, in which it was possible to study age and gender differences in biases of self-reported anthropo-metric measures through the period of puberty. The strength is also that great attention was given to avoid potential bias that can be introduced by inaccuracies in procedures of taking measurements: there was no lapse of time between collecting self-reported height and weight and carrying out direct measurements; identical new equipment was used throughout the country, and a standard protocol was used to consider weight of clothes worn during direct measurements.
In this study students were aware that their height and weight would be subsequently measured, which is
considered to lead to more accurate reporting than in usual HBSC study. However, the supposition was not confirmed in a study among adults [41].
Conclusions
In the current study, certain age-related patterns in under-reporting of weight and height values as well as estimated overweight prevalence were found across the period of adolescence. The mean differences between self-reported and directly measured weight, height and BMI were greatest among 11-year-olds and lowest for those aged 15 years. The underestimation of overweight prevalence showed a linear trend to decrease with
Overweight/obese subjects are labelled with purple squares
120 140 160 180 200 220
-20 -10 0 10 20 30 40
Mean of height-M and height-SR
hei
gh
t-M -
he
ig
ht
-S
R
Mean 0,5 -1.96 SD -6,3 +1.96 SD 7,4
Overweight/obese subjects are labelled with purple squares
20 40 60 80 100 120 140 -40
-30 -20 -10 0 10 20 30 40 50
Mean of weight-M and weight-SR, kg
we
igh
t-M
-
we
igh
t-S
R,
kg
Mean 1,4 -1.96 SD -6,4 +1.96 SD 9,2 Girls are labelled with purple dots,
boys with blue dots
20 40 60 80 100 120 140
-40 -30 -20 -10 0 10 20 30 40 50
Mean of weight-M and weight-SR, kg
we
ight-M
-
we
igh
t-S
R,
kg
Mean 1,4 -1.96 SD -6,4 +1.96 SD 9,2 Girls are labelled with purple dots,
boys with blue dots
120 140 160 180 200 220 -20
-10 0 10 20 30 40
Mean of height-M and height-SR, cm
he
ight
-M
-
he
igh
t-SR
, cm
Mean 0,5 -1.96 SD -6,3 +1.96 SD 7,4
a c
b d
[image:7.595.61.541.88.493.2]increasing age. The extent of misclassification in height and its impact on the bias of overweight prevalence were less than that of weight. The mean underestimation of overweight prevalence based on self-reports was rather small, 3.6 %. BMI basing on self-reported data remains the method of choice in large surveys for practical and logistical reasons.
Abbreviations
BMI: body mass index; HBSC: Health Behaviour of School-aged children; CINDI: Countrywide Integrated Noncommunicable Diseases Intervention; height-M, weight-M, BMI-M: directly measured height, weight and resulting BMI; height-SR, weight-height-SR, BMI-SR: self-reported height, weight and resulting BMI; LOA: limits of agreement; CI: confidence interval.
Authors’ contributions
KA participated in data collection, statistical analysis, interpreted the results and wrote the first draft of the manuscript. NA assisted KA on statistical analy-sis and critical revision of the manuscript. EK participated in data collection and in writing the first draft. All authors were involved in writing and revising the manuscript. All authors read and approved the final manuscript.
Author details
1 Department of Chronic Diseases, National Institute for Health Development,
42 Hiiu Street, 11619 Tallinn, Estonia. 2 National Institute of Public Health,
University of Southern Denmark, Øster Farimagsgade 5A, Copenhagen K 1353, Denmark. 3 Health Promotion Research Centre, National University of
Ire-land, 12 Distillery Road, Galway, Ireland. 4 United Laboratories, Department
of Genetics, Tartu University Hospital, 6 Hariduse Street, 10119 Tallinn, Estonia.
5 Department Molecular and Developmental Medicine, Centre of Research
for Health Education and Promotion, University of Siena, Via A. Moro 2, 53100 Siena, Italy. 6 Health Scientist, Hyattsville, Maryland, USA.
Authors’ details
This work was primarily conducted in affiliation with the Faculty of Medicine, University of Paris, 368 Paris, 13 Bobigny, France.
Additional file
Additional file 1. Rules of weighting.
Acknowledgements
We would like to thank Anastassia Minossenko and Ardo Matsi for statistical assistance. The study was funded through the National Health Plan 2009-2020 of Estonia and by the Estonian Ministry of Education and Research, projects SF0942706s06 and SF0940006s12.
Competing interests
The authors declare that they have no competing interest.
Received: 2 February 2015 Accepted: 14 October 2015
References
1. Lobstein T, Baur L, Uauy R. Obesity in children and young people: a crisis in public health. Obesity Rev. 2004;5(Suppl 1):4–104.
2. Sun SS, Liang R, Huang TT, Daniel SR, Arslanian S, Liu K, et al. Childhood obesity predicts adult metabolic syndrome: the Fels Longitudinal Study. J Pediatr. 2008;152:191–200.
3. Olds T, Maher C, Zumin S, Peneau S, Lioret S, Castetbon K, et al. Evidence that the prevalence of childhood overweight is plateauing: data from nine countries. Int J Pediatr Obes. 2011;6:342–60.
4. Cole TJ, Belizzi MC, Flegal KM, Dietz WH. Establishing a standard definition for child overweight and obesity worldwide: international survey. BMJ. 2000;320:1240–3.
5. World Health Organization. Physical Status: the use and interpretation of anthropometry. Geneva; 1995.
6. Currie C, Gabhainn SN, Godeau E, Roberts C, Smith R, Currie D, et al. Inequalities in Young People’s Health. Health Behaviour in School-aged Children: HBSC International Report from the 2005/2006 survey. Health Policy for Children and Adolescents, No. 5. Copenhagen, WHO Regional Office for Europe 2008.
7. CDC. State-specific prevalence of obesity among adults—United States 2007. MMWR. 2008;57:765–8.
8. Niedhammer I, Bugel I, Bonenfant S, Goldberg M, Leclerc A. Validity of self-reported weight and height in the French GAZEL cohort. Int J Obes Relat Metab Discord. 2000;24:1111–8.
9. Spencer EA, Appleby PN, Davey GK, Key TJ. Validity of self-reported height and weight in 4808 EPIC-Oxford participants. Public Health Nutr. 2002;5:561–5.
10. Zhou X, Dibley MJ, Cheng Y, Ouyang X, Yan H. Validity of self-reported weight, height and resultant body mass index in Chinese adolescents
Table 2 Classification of weight status classes estimated by measured and self- reported weight and height
a Overweight category includes also obese subjects
Classification weight status based on measured data Classification weight status based on self-reports
Underweight Normal weight Overweighta n %
Boys
Underweight 12 10 0 22 1
Normal weight 24 1201 36 1261 79.1
Overweight 0 86 225 311 19.5
n 36 1297 261 1594
% 2.3 81.3 16.4
Girls
Underweight 27 13 0 40 2.2
Normal weight 46 1408 26 1480 82.9
Overweight 73 97 168 265 14.9
n 1518 194 1785
[image:8.595.55.541.103.287.2]and factors associated with errors in self-reports. BMC Public Health. 2010;10:190–200.
11. Giacchi M, Mattei R, Rossi S. Correction of the self-reported BMI in a teen-age population. Int J Obes. 1998;22:673–7.
12. Wang Z, Patterson CM, Hills AP. A comparison of self-reported and meas-ured height, weight and BMI in Australian adolescents. Austr N Z J Public Health. 2002;26:473–8.
13. Elgar FJ, Stewart JM. Validity of self-report screening for overweight and obesity. Can J Public Health. 2008;99:423–7.
14. Enes CC, Fernandez PMF, Voci SM, Toral N, Romero A, Slater B. Validity and reliability of self-reported weight and height measures for the diagnoses of adolescent’s nutritional status. Rev Bras Epidemiol. 2009;12:627–35. 15. Bae J, Joung H, Kim J-Y, Kwon KN, Kim Y, Park S-W. Validity of self-reported
height, weight and body mass index of Korea Youth Risk Behaviour Web-Based Survey Questionnaire. J Prev Med Public Health. 2010;43:396–402. 16. Brener ND, Mcmanus T, Galuska DA, Lowry R, Wechsler H. Reliability and validity of self-reported height and weight among high school students. J Adolesc Health. 2003;32:281–7.
17. Himes JH, Hannan P, Wall M, Neumark-Sztainer D. Factors associated with errors in self-reports of stature, weight, and body mass index in Minne-sota adolescents. Ann Epidemiol. 2005;15:272–8.
18. Brettschneider AK, Rosario AS, Ellert U. Validity and predictors of BMI derived from self-reported height and weight among 11- to 17-year-old German adolescents from the KIGGS study. BMC Res Notes. 2011;4:414. 19. Kuczmarski MF, Kuczmarski RJ, Najjar M. Effects of age validity of
self-reported height, weight, and body mass index: findings from the Third National Health and Nutrition Examination Survey, 1988-1994. J Am Diet Assoc. 2001;101:28–34.
20. Himes JH, Story M. Validity of self-reported weight and height and stature of American Indian youth. J Adolesc Health. 1992;13:118–20.
21. Elgar FJ, Roberts C, Tudor-Smith C, Moore L. Validity of self-reported height and weight and predictors of bias in adolescents. J Adolesc Health. 2005;37:371–5.
22. Shannon B, Smiciklas-Wright H, Wang MQ. Inaccuracies in self-reported weights and heights of a sample of sixth-grade children. J Am Diet Assoc. 1991;91:675–8.
23. Jansen W, van de Looij-Jansen PM, Ferreira I, de Wilde EJ, Brug J. Dif-ferences in measured and self-reported height and weight in Duch adolescents. Ann Nutr Metab. 2006;50:339–46.
24. Morrissey SL, Whetstone LM, Cummings DM, Owen LJ. Comparison of self-reported and measured height and weight in eight-grade students. J Sch Health. 2006;76:512–5.
25. Currie C, Zanotti C, Morgan A, Currie D, de Looze M, Roberts C, et al. Social determinants of health and well-being among young people. Health behaviour in school-aged children (HBSC) study: International Report from the 2009/2010 survey. Health Policy for Children and Adoles-cents, No. 6. Copenhagen, WHO Regional Office for Europe 2012.
26. Rogol AD, Roemmich JN, Clark PA. Growth at puberty. J Adolesc Health. 2002;6(Suppl):192–200.
27. Fonseca H, Silva AM, Matos MG, Esteves I, Costa P, Guerra A, et al. Validity of BMI based on self-reported weight and height in adolescents. Acta Pediatrica. 2010;99:83–8.
28. Countrywide Integrated Noncommunicable Diseases Intervention (CINDI) Programme: Protocol and Guidelines. WHO Regional Office for Europe. Copenhagen 1995, EUR/ICP/CINDI 94 02/PB04.
29. Cole TJ, Flegal KM, Nicholls D. Body mass index cut offs to define thinness in children and adolescents: international survey. BMJ. 2007;335:194–201. 30. Altman DG. Practical Statistics for Medical Research. London: Chapman &
Hall; 1991. p. 403–9.
31. Sheskin DJ. Handbook of parametric and nonparametric statistical proce-dures. 3rd ed. Boca-Ration: Chapman and Hall; 2004.
32. Bland JM, Altman DG. Statistical methods for assessing agreement between two methods of clinical measurement. Lancet. 1986;1:307–10. 33. Altman DG, Bland JM. Statistic notes: diagnostic tests 1: sensitivity and
specificity. BMJ. 1994;308:1552.
34. Altman DG, Bland JM. Statistic notes: diagnostic tests 2: predictive values. BMJ. 1994;309:102.
35. Sherry B, Jefferd ME, Grummer-Strawn LM. Accuracy of adolescent self-report of height and weight in assessing overweight: a literature review. Arch Pediatr Adolesc Med. 2007;161:1154–61.
36. De Vriendt T, Huybrechts I, Ottevaere C, VanTrimpont I, De Henauw S. Validity of self-reported weight and height of adolescents, its impact on classification into BMI-categories and the association with weighing behaviour. Int J Environ Res Public Health. 2009;6:2111–696.
37. Davis H, Gergen PJ. The weights and heights of Mexican-American ado-lescents: the accuracy of self-reports. Am J Public Health. 1994;84:459–62. 38. Strauss RS. Self-reported weight status and dieting in a cross-sectional
sample of young adolescents: national Health and Nutrition Examination Survey III. Arch Pediatr Adolesc Med. 1999;153:741–7.
39. Farias Junior JC. Validity of self-reported weight and height for adolescent nutritional status diagnosis. Brazil J Mother Child Health. 2007;7:167–74. 40. Rasmussen M, Holstein BE, Melkevik O, Damsgaard MT. Validity of
self-reported height and weight among adolescents: the importance of reporting capability. BMC Med Res Methodol. 2013;13:85.
41. Yoong SL, Carey ML, D’Este C, Sanson-Fisher RW. Agreement between self-reported and measured weight and height collected in general prac-tice patients: a prospective study. BMC Med Res Methodol. 2013;13:38.
Submit your next manuscript to BioMed Central and take full advantage of:
• Convenient online submission
• Thorough peer review
• No space constraints or color figure charges
• Immediate publication on acceptance
• Inclusion in PubMed, CAS, Scopus and Google Scholar
• Research which is freely available for redistribution