Dr. U. D. Shivhare
Sharad Pawar College of Pharmacy,
Wanadongri, Hingna Road, Nagpur - 441 110, (MS), India
E-mail: [email protected] Address for correspondence
Access this article online www.japer.in
Formulation and Evaluation of Transdermal film of Promethazine
Hydrochloride
INTRODUCTION
The fundamentals of a successful pharmaceutical
formulation are to enable delivery of the active
substance to the target organ at therapeutically
relevant levels, with negligible discomfort and side
effects to the patient.[1-2] The drug delivery system
should deliver the drug at a rate dictated by the needs
of the body over a specified period of treatment.[3]
Transdermal Drug Delivery System (TDDS) is
self-contained, discrete dosage form that, when applied to
intact skin is designed to deliver the drug(s) through
the skin to the systemic circulation. The limitations of
oral route can be overcome by transdermal route and
benefits of intravenous drug infusion such as to
by-pass hepatic “first-by-pass” elimination to maintain
constant prolong and therapeutic effective drug level
in the body can be closely duplicated without its
hazards by using the intact skin as a port of drug
administration.[4]Promethazine hydrochloride though
possessing 88% of bioavailability however undergoes
tremendous hepatic “first-pass” metabolism and thus
the absolute bioavailabilityis only 25%. Thus the
problem associated with promethazine hydrochloride
will be overcome by formulating it into transdermal
film.
The objective of the present study was to evaluate
effect of formulation variables on in vitro characters of
Promethazine hydrochloride transdermal film.
MATERIAL AND METHODS Materials
Promethazine hydrochloride was obtained as gift
sample from Sehat Pharma Pvt. Ltd., Gujarat. Eudragit
RS 100 and Eudragit RL 100were obtained as a gift
samples from Evonik Pharma, Mumbai. Potassium
dihydrogen phosphate, Ethanol, Methanol and
Acetone were purchased from Loba Chemie, Mumbai.
Sodium chloride and Potassium chloride were
purchased from the Merck Co., Mumbai. Ascorbic acid
was purchased from S. D. Fine Chemicals, Mumbai. All
the other chemicals, reagents and solvents used were
of AR grade.
Methods
Formulation of transdermal film
The transdermal films of Promethazine hydrochloride
were prepared by solvent evaporation method. The
In present study Promethazine hydrochloride transdermal films were prepared by mercurysubstrate method using polymer Eudragit RS 100 and Eudragit RL 100. Dimethyl sulphoxide and Dibutyl phthalate were used as a skin permeation enhancer and a plasticizer, respectively. The prepared transdermal films were evaluated for thickness, folding endurance, weight variation, flatness, moisture absorption, moisture loss, moisture content, water vapor transmission, drug contain uniformity and in vitro permeation study. Drug polymerinteractions were determined by FTIR and standard calibration curve of Promethazine hydrochloride was determined by using UV spectroscopy. In vitro drugrelease study was performed by using Franz-diffusion cell. The transdermal films prepared by using Eudragit RS 100 and Eudragit RL 100 showed good physical properties. The formulation batch (F5) containing Eudragit RL 100: Eudragit RS 100 (5:1) showedmaximum drug release (96.15%) and showed fickian diffusion.
Keywords: Promethazine hydrochloride, Transdermal film, Transdermal drug delivery, Eudragit RS 100, Eudragit RL 100
ABSTRACT ABSTRACT ABSTRACT ABSTRACT Umesh. D. Shivhare*1, Pravin. B.
Suruse1 Taher S. Dahodwala1 Azaruddin Sheikh1 1Sharad Pawar College of Pharmacy, Wanadongri, Hingna Road, Nagpur - 441 110 (MS) India
weighed quantities of polymers were taker in a beaker
and then the measured quantity of acetone was added.
The measured quantity of ethanol was taken into
another beaker and weighed quantity of
Promethazine hydrochloride, Dibutyl pthalate and
Dimethyl sulfoxide were added. Ascorbic acid was
dissolved separately in methanol and was then added
in the beaker containing Promethazine hydrochloride.
The solutions in a two beakers were mixed and filled
in the transdermal ring. The ring was covered with
funnel so as to prevent it from rapid drying and dried
at room temperature in a dust-free environment for
24 h. The film was removed from the ring when
properly dried carried out for evaluation tests. The
transdermal patches were stored in a desiccators
containing fused calcium chloride until further use.[5]
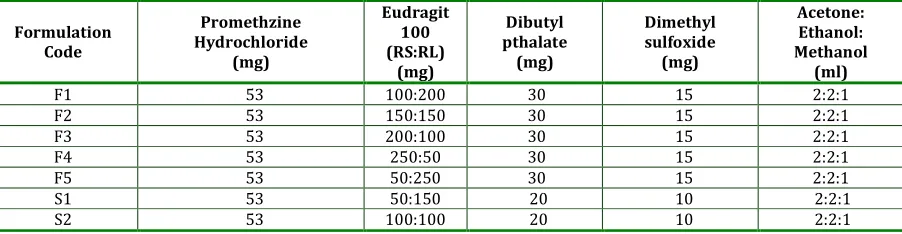
Table 1: Composition of Promethazine hydrochloride polymeric transdermal films
Formulation Code
Promethzine Hydrochloride
(mg)
Eudragit 100 (RS:RL)
(mg)
Dibutyl pthalate
(mg)
Dimethyl sulfoxide (mg)
Acetone: Ethanol: Methanol
(ml)
F1 53 100:200 30 15 2:2:1
F2 53 150:150 30 15 2:2:1
F3 53 200:100 30 15 2:2:1
F4 53 250:50 30 15 2:2:1
F5 53 50:250 30 15 2:2:1
S1 53 50:150 20 10 2:2:1
S2 53 100:100 20 10 2:2:1
Evaluation of transdermal films Weight variation
The transdermal films were subjected to weight
variation by individually weighing 5 transdermal films
of same formulation. Such determinations were
carried out for each formulation of Promethazine
hydrochloride transdermal film.[5]
Thickness
The thicknesses of transdermal films were measured
by using screw gauge. The thickness was measured at
five different points on the same film and average of
five readings was taken.[5]
Folding endurance
It was determined by repeatedly folding the
transdermal filmat the same place until it broke. The
test was carried out to check the efficiency of the
plasticizer and the strength of the film,prepared using
varying ratios of the polymers. The number of times
the film could be folded at the same place without
breaking/cracking gave the value of folding
endurance.[5]
Flatness and appearance
Longitudinal strips were cut out from each
transdermal film, one from the center and two from
either side. The length of each strip was measured.
The variation in the length because of non-uniformity
in flatness was measured by determining %
constriction, considering 0% constriction is equivalent
to 100% flatness.[5]
% Constriction =
100
2 2 1
×
−
L
L
L
Where L1= initial length of each strip
L2 = final length of each strip
Percentage moisture absorption
A weighed transdermal film was kept in a desiccator
and exposed to 84% RH (a saturated solution of
aluminum chloride) at room temperature for 24 h. It
was taken out and weighed until a constant weight for
the film was obtained. The % of moisture absorption
was calculated as the difference between final and
initial weight with respect to initial weight.[5]
% Moisture absorption =
100 weight
Initial
weight Initial weight Final
Percentage moisture content
The transdermal films were weighed individually and
kept in desiccators containing activated silica at room
temperature for 24 h. Individual transdermal films
were weighed repeatedly until they showed a
constant weight. The percentage of moisture content
was calculated as the difference between initial and
final weight with respect to initial weight.[5]
% Moisture content =
100
weight
Initial
weight
Final
weight
Initial
×
Percentage moisture loss
Accurately weighed transdermal films of each
formulation batch were kept in a desiccator and
exposed to an atmosphere of 98% RH (containing
anhydrous calcium chloride) at room temperature and
weighed after 3 d. The percentage of moisture loss
was calculated as the difference between initial and
final weight with respect to initial weight.[5]
% Moisture loss =
100 weight
Initial
weight Final weight Initial
×
Water vapor transmission rate (WVT Rate)
Glass vials of equal diameter were used as transmission
cells. These transmission cells were washed thoroughly
and dried in an oven. Then, in these dried cells about 1 g
anhydrous calcium chloride was placed and the polymer
film from each batch of formulation was fixed over the
brim. The cells were accurately weighed and kept in a
closed desiccators containing saturated solution of
potassium chloride to maintain a humidity of 84%. The
cells were taken out and weighed after 24 h of storage.[5]
Water vapor transmission rate =
Area Time
weight Initial weight Final
×
Drug content
A transdermal patch was cut into 5 equal parts and
put in a 50 ml buffer (pH 7.4). This was then shaken in
a mechanical shaker for 24 h to get a homogeneous
solution and filtered. The drug content was
determined spectrophotometrically at 249.5 nm after
suitable dilution.[5]
Table 2: Physico-chemical evaluation of transdermal films of Promethazine hydrochloride
Formulation code
Percent moisture absorption
(%)±S.D
Percent moisture
loss (%)±S.D
Percent moisture
content (%)± S.D
Thickness (mm)±S.D.
Weight uniformity
(mg)±S.D
Folding endurance
± S.D.
Water vapor
transmission ±S.D
Drug content
±S.D
F1 0.59±0.144 1.43±0.27 1.2±0.185 0.22±0.01 463±2.3 28.4±1.35 1.36±0.057×10⁻⁴ 99.12±0.32
F2 1.06 ±0.17 1.52±0.25 1.39±0.18 0.19±0.01 465.6±2.9 43± 1.098 1.84±0.014×10⁻⁴ 98.65±0.19
F3 0.89±0.133 1.68±0.28 1.85±0.06 0.17±0.06 469.8±2.4 47.8±0.971 2.56±0.280×10⁻⁴ 98.70±0.40
F4 0.59±0.118 1.65±0.23 1.59±0.01 0.18±0.07 464.5±2.2 50.4±1.02 2.7±0.284×10⁻⁴ 98.77±0.50
F5 0.95±0.082 1.58 ± 0.3 1.9±0.057 0.20±0.07 469.2±1.9 28.5±0.74 1.58±0.052×10⁻⁴ 99.07±0.16
S1 1.1 ± 0.237 1.56±0.34 2.05±0.11 0.14±0.06 371.5±1.1 41.2±1.16 2.41±0.040×10⁻⁴ 98.3±0.179
S2 1.35±0.292 1.39±0.23 2.27±0.37 0.16±0.05 364.6±1.3 46.4±0.81 3.68±0.074×10⁻⁴ 98.78±0.56
In vitro drug release (dissolution study)
A modified stainless steel disc assembly (USP
Apparatus 5, paddle over disc assembly), was used for
the assessment of the release of the drug from the
transdermal films. The transdermal drug delivery
system (TDDS) was mounted on the disc and placed at
the bottom of the dissolution vessel. The dissolution
medium was pH 7.4 buffer solution and the apparatus
was equilibrated to 37±0.5°C. The apparatus was
operated at 50 rpm. Samples were withdrawn at
appropriate time intervals up to 12 h and were
filtered through Whatman filter paper no. 42 and then
filter through membrane filter (0.2μ) and analyzed for
absorbance by using UV-Visible spectrophotometer
(UV–1601) at 249.5 nm after suitable dilution.
Cumulative % drug release were calculated and
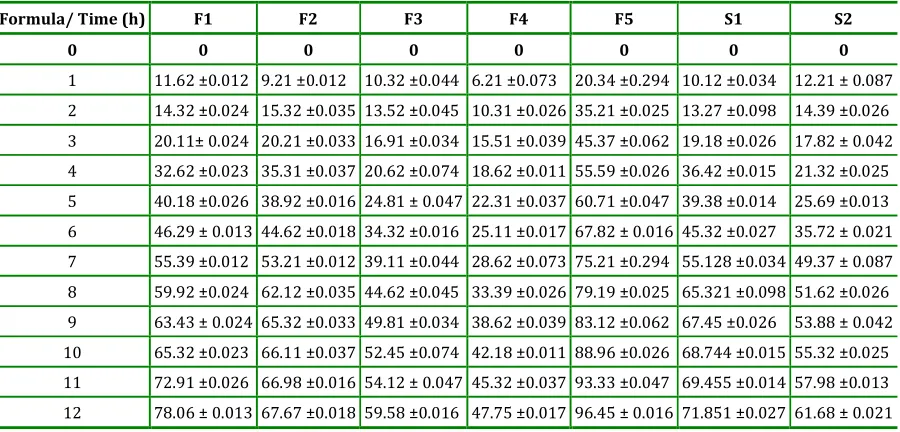
Table 3: Cumulative % drug release from various formulation batches
Formula/ Time (h) F1 F2 F3 F4 F5 S1 S2
0 0 0 0 0 0 0 0
1 11.62 ±0.012 9.21 ±0.012 10.32 ±0.044 6.21 ±0.073 20.34 ±0.294 10.12 ±0.034 12.21 ± 0.087
2 14.32 ±0.024 15.32 ±0.035 13.52 ±0.045 10.31 ±0.026 35.21 ±0.025 13.27 ±0.098 14.39 ±0.026
3 20.11± 0.024 20.21 ±0.033 16.91 ±0.034 15.51 ±0.039 45.37 ±0.062 19.18 ±0.026 17.82 ± 0.042
4 32.62 ±0.023 35.31 ±0.037 20.62 ±0.074 18.62 ±0.011 55.59 ±0.026 36.42 ±0.015 21.32 ±0.025
5 40.18 ±0.026 38.92 ±0.016 24.81 ± 0.047 22.31 ±0.037 60.71 ±0.047 39.38 ±0.014 25.69 ±0.013
6 46.29 ± 0.013 44.62 ±0.018 34.32 ±0.016 25.11 ±0.017 67.82 ± 0.016 45.32 ±0.027 35.72 ± 0.021
7 55.39 ±0.012 53.21 ±0.012 39.11 ±0.044 28.62 ±0.073 75.21 ±0.294 55.128 ±0.034 49.37 ± 0.087
8 59.92 ±0.024 62.12 ±0.035 44.62 ±0.045 33.39 ±0.026 79.19 ±0.025 65.321 ±0.098 51.62 ±0.026
9 63.43 ± 0.024 65.32 ±0.033 49.81 ±0.034 38.62 ±0.039 83.12 ±0.062 67.45 ±0.026 53.88 ± 0.042
10 65.32 ±0.023 66.11 ±0.037 52.45 ±0.074 42.18 ±0.011 88.96 ±0.026 68.744 ±0.015 55.32 ±0.025
11 72.91 ±0.026 66.98 ±0.016 54.12 ± 0.047 45.32 ±0.037 93.33 ±0.047 69.455 ±0.014 57.98 ±0.013
12 78.06 ± 0.013 67.67 ±0.018 59.58 ±0.016 47.75 ±0.017 96.45 ± 0.016 71.851 ±0.027 61.68 ± 0.021
Each value represents mean±SD, n = 5
Table 4: Drug release kinetics for the various formulation batches
Formulation Zero order First order
Higuchi’s
model Peppa’s model Diffusion coefficient (n) R2
F1 0.962 0.948 0.906 0.990 0.495
F2 0.981 0.929 0.903 0.992 0.467
F3 0.965 0.878 0.921 0.989 0.498
F4 0.972 0.981 0.940 0.986 0.449
F5 0.979 0.910 0.915 0.1004 0.502
S1 0.968 0.887 0.876 0.981 0.455
S2 0.986 0.959 0.883 0.988 0.459
Optimized formula for Promethazine hydrochloride transdermal film
Batch F5, composing of polymer ERS 50: ERL 250 was
found to be stable and to release the drug (96.45%) up
to 12 h and possess good physicochemical properties,
hence was considered optimized batch for further in
vitro diffusion study and scanning electron
microscopy.
In vitro diffusion study
In vitro diffusion study was performed in a Franz
diffusion assembly of capacity 10 ml using cellophane
membrane (Dialysis membrane 70). A section of
membrane was cut, measured and placed on the
dermal side of the membrane in the donor
compartment facing the drug matrix side of the
transdermal film to the membrane and backing
membrane upward. The holder containing the
membrane and formulation was placed on the
receiver compartment of the cell, containing
phosphate buffer pH 7.4. The temperature of the
diffusion cell was maintained at 37±0.5°C by
circulating water jacket.
The solution in the receiver compartment was
constantly and continuously stirred during the whole
experiment using magnetic bead. The samples were
withdrawn (1 ml) at different time intervals and an
equal amount of phosphate buffer pH 7.4 was
replaced. Absorbance of the samples was recorded
spectrophotometrically at 249.5 nm using phosphate
buffer solution, pH 7.4, as a blank.[7]
The cumulative percentage of drug diffused at each
time interval was calculated. The plot of % cumulative
drug diffused Vs. time (h), cumulative amount of drug
(µg/cm2)/h V/s time (h) and flux V/s time (h) were
plotted.
Figure 1: In vitro diffusion of Promethazine hydrochloride from formulation batch F5
Figure 2: In vitro diffusion of Promethazine hydrochloride from formulation batch F5
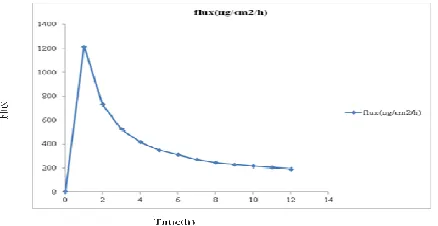
Figure 3: In vitro diffusion flux of Promethazine hydrochloride from formulation batch F5
Scanning electron microscopy (SEM)
The external morphology of the transdermal film was
investigated by Scanning Electron Microscopy (SEM)
using JSM 6380A (JOEL, Japan). Transdermal film of
suitable size was cut and fixed over brass brim. It was
then coated with platinum by ion sputtering using
auto fine coater JFC-1600 for 20s at 1.1v under argon
atmosphere and then mounted onto metal stubs using
double-sided carbon adhesive tape and the scanning
electron micrograph was taken.
Fig IV: SEM photograph of the transdermal film of optimized formulation batch F5
RESULTS AND DISCUSSION Formulation of transdermal film
The matrix-type controlled transdermal drug films
were prepared by solvent evaporation method using
Acetone: ethanol (1:1) as solvent for ERL 100 and ERS
100. The casting solution was prepared by using 6%
w/v polymer in solvent system. Ascorbic acid was
used as an anti-oxidant and was dissolved in
methanol. DBP was used as a plasticizer and DMSO as
penetration enhancer. The formulation of different
batches of Promethazine hydrochloride polymeric
transdermal films are shown in Table 1. The prepared
transdermal films were evaluated for its
physicochemical properties, in vitro dissolution
studies, short term stability studies, in vitro
permeation study and scanning electron microscopy.
Moisture absorption and moisture content
The results of moisture absorption and moisture
content studies are shown in Table 2. The moisture
absorption in the formulation batches ranges from
0.59 ± 0.114 to 0.95 ± 0.082 % and 1.10 ± 0.237 to
1.35 ± 0.292 % (for formulation F series and
formulation S series respectively). The moisture
content in the transdermal film ranges from 1.43 ±
0.27 to 1.68 ± 0.28 % and 1.392 ± 0.23 to 1.56 ± 0.36%
(for formulation F series and formulation S series
respectively). The results revealed that the moisture
absorption and moisture content was found to be
increased with increased concentration of hydrophilic
Percentage moisture loss
The results of percentage moisture loss study are
shown Table 2. The percent moisture loss in the
formulations batches ranges from 1.2 ± 0.185 to 1.9 ±
0.057 and 2.05 ± 0.109 to 2.27 ± 0.372. The results
revealed that the moisture loss was found to be
increased with increased concentration of hydrophilic
polymer (Eudragit RL). The smaller moisture content
in the formulations helps them to remain stable and
from being a completely dried and brittle patch.
Water vapor transmission rate
The results of water vapor transmission rate are
shown in Table 2. Water vapor transmission rate
appeared maximum with the film formulated with
Eudragit RS 100 in 5:1 Eudragit RL 100. As
anticipated, with decreased in Eudragit RL 100
concentration the values of percentage water vapor
transmission rate increased in accordance with their
increasing hydrophobic nature. The transdermal film
F5 having Eudragit RS 100: Eudragit RL 100 in (1:5)
ratio was having least % water vapor transmission
rate.
Mass variation
The results of mass variation study were found to vary
between 463 ± 2.30 to 469.8 ± 2.38 mg and 364.6 ±
1.29 to 371.5 ± 1.11 mg respectively for F series S
series respectively. The results indicated that
formulation batches F3 and S1 were having highest
mass, while formulation batches F1 and S2 was having
the least mass among the formulation batches.
Thickness
The results of thickness study carried for the films are
shown in (Table 2), which indicates that the thickness
of the transdermal films varied from 0.14 ± 0.006 to
0.22 ± 0.008 mm. Formulation F1 was having the
maximum thickness i.e. 0.22 ± 0.008 mm while S1 was
having the least 0.14 ± 0.006 mm.
Folding endurance
Folding endurance study was carried out (Table 2)
and results ranged from 28.4 ± 1.350 to 50.4 ± 1.019
and 41.2 ± 1.160 to 46.4 ± 0.804 for formulation F
series and formulation S series respectively. Folding
endurance test results indicates that the transdermal
films would maintain the integrity with general skin
folding when applied.
Appearance and flatness study
Appearance and flatness study indicates, the
formulations F1 and F5 were having slightly hazy
appearance, while the others were transparent.
Flatness study indicated that all the formulations were
100% flat in nature. Flatness test results indicated
that the transdermal films would adhere to the skin
surface properly.
Drug content
The drug content analysis of the prepared
formulations (Table 2) had shown that the process
adopted for casting the transdermal films was capable
of giving patches with uniform drug content and with
minimum intra batch variability.
In vitro dissolution study
In vitro dissolution study as shown in (Table 3)
indicates that formulation F5 (96.45%) was having
more release as compared to other formulations. In
the present study it was observed that, as the
concentration of hydrophilic polymer (Eudragit RL
100) decreased in the formulations, the drug release
rate was decreased substantially, however it was very
nominal in formulation F5. It also suggested that, the
addition of hydrophilic component to an insoluble film
former tends to enhance the release rate. Hence
comparing all the data and release profiles,
formulation batch F5 among the series was chosen as
good release.
The in vitro release profiles were applied on various
kinetic models in order to find out the mechanism of
drug release (Table 4). The best fit with the highest
correlation coefficient was shown in zero-order
followed by first order and than by Higuchi’s
equations. The rate constants were calculated from
the slope of the respective plots. The data obtained
were also put in Korsmeyer-Peppa’s model in order to
find out n value, which described the drug release
mechanism. The n value of transdermal films of
0.449 and 0.502, indicating that the mechanism of
drug release was Fickian transport.
In vitro diffusion study
The plot of % cumulative drug diffused Vs. time (h),
cumulative amount of drug permeated (µg/cm2)/h
V/s time (h) and flux V/s time (h) are revealed in
Figure 1 to 3. The in vitro diffusion study indicates
that cumulative percentage diffusion of F5
formulation batch is 95.14 ± 0.120 in 12 h.
Scanning electron microscopy (SEM)
Scanning electron microscopy (SEM) was performed
for F5 formulation batch (Figure 4) revealed the
surface morphology of the transdermal film. It had
shown the uniform distribution of drug in the entire
polymer matrix.
CONCLUSION
Promethazine hydrochloride possesses all requisite
qualities required for controlled drug delivery system
in the form of transdermal films. The polymers
selected were non-toxic, non-absorbable and they did
not lose their film forming properties, when
formulated with the drug and excipients. The ERL
polymer swells more than ERS due to its higher
concentration of hydrophilic quaternary groups.
Transdermal films of various polymeric combinations
were having little or no apparent effect on
physicochemical characteristics among themselves.
Among the various polymeric ratios the formulation
F5 comprising of polymers ERL 100 and ERS 100 in
5:1 ratio had shown a maximum release 95.15% in
controlled manner up to 12 h. Formulation F5
followed Korsmeyer-Peppa’s model in dissolution
study. It fulfilled the requirement of good TDDS. The
transdermal films were transparent and the drug
remained homogeneously dispersed in the polymer
matrix and is safe to use via transdermal route.
ACKNOWLEGEMENT
The authors are thankful to Sehat Pharma Pvt. Ltd.,
Gujarat for providing gift sample of Promethazine
hydrochloride.
REFERENCES
1. Kriwet K., Muller-Goymann C.C. Diclofenac release
from phospholipid drug systems and permeation
through excised human stratum corneum. Int. J.
Pharm.1995; 125:231-242.
2. Bonina F.P., Montenegro L., Scrofani N., Esposito E.,
Cortesi R., Menegatti E., Nastruzzi C. Effects of
phospholipid based formulations on in vitro and in
vivo percutaneous absorption of methyl Nicotinate. J.
Control. Rel.1995; 34:53-63.
3. Lee, Y.W., Robinson J.R. Remington: The Science and
Practice of Pharmacy. 20th ed. Vol 2, Lippincott
Williams and Wilkins Publishers, 2000.
4. Jain, N.K., Parmar, N.S., Vyas, S.K., Vaya, N. Advances
in Controlled and Novel Drug Delivery. 1st ed. CBS
Publishers, Delhi, 1997.
5. Shivhare U.D., Dorlikar V.P., Bhusari K.P., Mathur
V.B., Mirani B.N. Effect of polymeric compositions on
pharmacotechnical properties of Carvedilol
transdermal film. Int. J. Pharm. Sci. Nanotech.2009;
2:457-459.
6. Aqil M., Ali A. Monolithic matrix type transdermal
drug delivery systems of Pinacidil monohydrate: in
vitro characterisation. Eur. J. Pharm. Biopharm.2002;
54:162.
7. Anitha P., Ramkanth S., Saleem M., Umasankari K.,
Reddy B.P. Chetty M. Preparation, in vitro and in vivo
characterization of transdermal patch containing
Glibenclamide and Atenolol: a combinational
approach. Pak. J. Pharm. Sci.2010; 24:158-161.
How to cite this article: Umesh. D. Shivhare,*1 Pravin. B.
Suruse,1 Taher. S. Dahodwala,1 Azaruddin Sheikh1;
Formulation and Evaluation of Transdermal film of Promethazine Hydrochloride; J. Adv. Pharm. Edu. & Res. 2013: 3(4): 559-565.