ENGINEERING AND GINNING
Third Stage Seed-Cotton Cleaning System PM
2.5Emission Factors and Rates for
Cotton Gins: Method 201A Combination PM
10and PM
2.5Sizing Cyclones
Michael D. Buser*, Derek P. Whitelock, J. Clif Boykin, and Gregory A. Holt
M.D. Buser*, Biosystems and Agricultural Engineering, Oklahoma State University, 214 Agricultural Hall, Stillwater, OK 74078; D.P. Whitelock, USDA-ARS Southwestern Cotton Ginning Research Laboratory, 300 E College Dr., P.O. Box 578, Mesilla Park, NM 88047; J.C. Boykin, USDA-ARS Cotton Ginning Research Unit, 111 Experiment Station Road, P.O. Box 256, Stoneville, MS 38776; and G.A. Holt, USDA-ARS Cotton Production and Processing Research Unit, Rt. 3
Box 215, Lubbock, TX 79401
*Corresponding author: [email protected] ABSTRACT
This report is part of a project to characterize cotton gin emissions from the standpoint of stack
sampling. In 2006, EPA finalized and published a more stringent standard for particulate matter with nominal diameter less than or equal to 2.5
µm (PM2.5). This created an urgent need to collect additional cotton gin emissions data to address
current regulatory issues, because current EPA
AP-42 cotton gin PM2.5 emission factors did not
exist. The objective of this study was the devel -opment of PM2.5 emission factors for cotton gin 3rd stage seed-cotton cleaning systems based on the EPA-approved stack sampling methodology,
Method 201A. The project plan included sam
-pling seven cotton gins across the cotton belt. Key
factors for selecting specific cotton gins included:
1) facility location (geographically diverse), 2)
industry representative production capacity, 3) typical processing systems, and 4) equipped with
properly designed and maintained 1D3D cyclones.
Two of the seven gins were equipped with 3rd stage seed-cotton cleaning systems. In terms of
capacity, the two gins were typical of the indus
-try, averaging 22.8 bales/h during testing. Some test runs were excluded from the test averages because they failed to meet EPA Method 201A test criteria. Also, other test runs included in the analyses had cotton lint fibers that collected in the ≤ 10 µm and/or ≤ 2.5 µm samples. This larger
lint material can impact the reported emissions
data, but EPA Method 201A does not suggest
methods to account for these anomalies. Average measured 3rd stage seed-cotton cleaning system PM2.5 emission factor based on the two tests (six
total test runs) was 0.0040 kg/227-kg bale (0.0088
lb/500-lb bale). The 3rd stage seed-cotton cleaning system average emission factors for PM10 and
total particulate were 0.022 kg/bale (0.049 lb/ bale) and 0.029 kg/bale (0.063 lb/bale), respec -tively. The 3rd stage seed-cotton cleaning system PM2.5 emission rate from test averages ranged
from 0.073 to 0.11 kg/h (0.16-0.23 lb/h). System
average PM10 emission factors were higher and
system average total particulate emission factors were lower than those currently published in EPA
AP-42. The ratios of 3rd stage seed-cotton cleaning system PM2.5 to total particulate, PM2.5 to PM10, and PM10 to total particulate were 13.8, 18.0, and
76.5%, respectively.
I
n 2006, the U.S. Environmental Protection Agency (EPA) finalized a more stringent standard for particulate matter with a particle diameter less than or equal to a nominal 2.5-µm (PM2.5) aerodynamicequivalent diameter (CFR, 2006). The cotton industry’s primary concern with this standard was that there were no published cotton gin PM2.5 emissions
data. Cotton ginners’ associations across the cotton belt, including the National, Texas, Southern, Southeastern, and California associations, agreed that there was an urgent need to collect PM2.5 cotton gin emissions data
to address the implementation of the PM2.5 standards.
Working with cotton ginning associations across the country, state and federal regulatory agencies, Oklahoma State University, and USDA-Agricultural Research Service (ARS) researchers developed a proposal and sampling plan that was initiated in 2008 to address this need for additional data. This report is part of a series that details total particulate cotton gin emissions measured by stack sampling. Each manuscript in the series addresses a specific cotton ginning system. The systems covered in the series include: unloading, 1st stage seed-cotton cleaning,
2nd stage seed-cotton cleaning, 3rd stage seed-cotton
lint cleaning, combined lint cleaning, cyclone robber, 1st stage mote, 2nd stage mote, combined mote, mote
cyclone robber, mote cleaner, mote trash, battery condenser, and master trash. This report focuses on PM2.5 emissions from 3rd stage seed-cotton cleaning
systems.
There are published PM10 (particulate matter
with a particle diameter less than or equal to a nomi-nal 10-µm aerodynamic equivalent diameter) and total particulate emission factors for cotton gins in EPA’s Compilation of Air Pollution Emission Fac-tors, AP-42 (EPA, 1996a, b); however, there are no PM2.5,emission factors. The AP-42 average PM10
emission factor for the No. 3 dryer and cleaner was 0.015 kg (0.033 lb) per 217-kg (480-lb) equivalent bale with a range of 0.014 to 0.016 kg (0.030-0.035 lb) per bale. The AP-42 average total particulate emission factor for the No. 3 dryer and cleaner was 0.043 kg (0.095 lb) per bale with a range of 0.041 to 0.045 kg (0.091-0.099 lb) per bale. These PM10
and total factors were based on two tests and were assigned EPA emission factor quality ratings of D; the second lowest possible rating (EPA, 1996a).
Seed cotton is a perishable commodity that has no real value until the fiber and seed are separated (Wakelyn et al., 2005). Cotton must be processed or ginned at the cotton gin to separate the fiber and seed, producing 227-kg (500-lb) bales of market-able cotton fiber. Cotton ginning is considered an agricultural process and an extension of the harvest by several federal and state agencies (Wakelyn et al., 2005). Although the main function of the cotton gin is to remove the lint fiber from the seed, many other processes also occur during ginning, such as cleaning, drying, and packaging the lint. Pneumatic conveying systems are the primary method of mate-rial handling in the cotton gin. As matemate-rial reaches a processing point, the conveying air is separated and emitted outside the gin through a pollution control device. The amount of dust emitted by a system var-ies with the process and the condition of the material in the process.
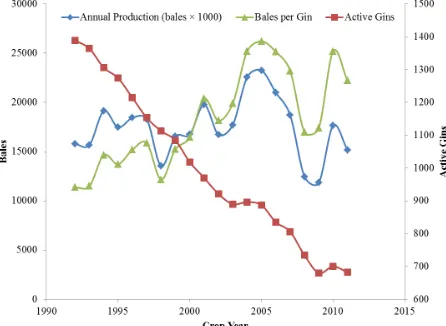
Cotton ginning is a seasonal industry with the ginning season lasting from 75 to 120 days, depend-ing on the size and condition of the crop. Although the trend for U.S. cotton production remained gener-ally flat at about 17 million bales per year during the last 20 years, production from one year to the next often varied greatly for various reasons, including climate and market pressure (Fig. 1). The number of active gins in the U.S. has not remained constant,
steadily declining to less than 700 in 2011. Conse-quently, the average volume of cotton handled by each gin has risen and gin capacity has increased to an average of approximately 25 bales per hour across the U.S. cotton belt (Valco et al., 2003, 2006, 2009, 2012).
Figure 1. Annual U.S. cotton production, active U.S. gins, and average ginning volume (bales per gin) (NASS, 1993-2012).
trash systems typically further process the by-products (e.g., mote cleaners) and/or consolidate the trash from the gin systems into a hopper or pile for subsequent removal.
system is typically the same as that removed by the seed-cotton cleaning machinery (rocks, soil, sticks, hulls, and leaf material) and lint extracted with the trash (Fig. 4).
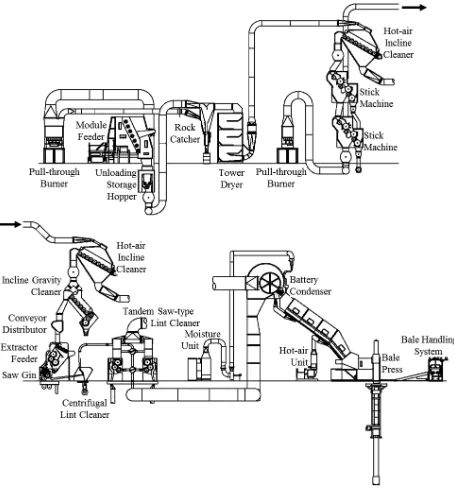
Figure 2. Typical modern cotton gin layout (Courtesy Lummus Corp., Savannah, GA).
The seed cotton is cleaned and dried in the seed-cotton cleaning systems. In the typical 3rd stage
seed-cotton cleaning system (Fig. 3), seed cotton drops from the 2nd stage seed-cotton cleaning system
machinery into the hot-air pneumatic conveying system of the 3rd stage seed-cotton cleaning system
via a rotary airlock and blowbox. The seed cotton is pulled directly into the seed-cotton cleaning machin-ery and separated from the conveying airstream by the cleaning mechanism (called a “hot-air” cleaner) or separated from the conveying air via a screened separator and dropped into the cleaning machinery. Seed-cotton cleaning machinery includes cleaners or extractors. This system removes foreign matter that includes rocks, soil, sticks, hulls, and leaf ma-terial. The airstream from the 3rd stage seed-cotton
cleaning system continues through a centrifugal fan to an abatement system; generally one or more cy-clones. This cleaning system may use air heated up to 117°C (350°F) at the seed-cotton and air-mixing point to accomplish drying during transport (ASABE, 2007). Based on system configuration, the airstream temperature at the abatement device could range from ambient to about 50% of the mixing-point temperature. The material handled by the abatement
Figure 3. Typical cotton gin 3rd stage seed-cotton cleaning
system layout (Courtesy Lummus Corp., Savannah, GA).
Figure 4. Photograph of typical trash captured by the 3rd
stage seed-cotton cleaning system cyclones.
Cyclones are the most common particulate mat-ter abatement devices used at cotton gins. Standard cyclone designs used at cotton ginning facilities are the 2D2D and 1D3D (Whitelock et al., 2009). The first D in the designation indicates the length of the cyclone barrel relative to the cyclone barrel diameter and the second D indicates the length of the cyclone cone relative to the cyclone barrel diameter. A standard 2D2D cyclone (Fig. 5) has an inlet height
of D/2 and width of D/4 and design inlet velocity of 15.2 ± 2 m/s (3000 ± 400 fpm). The standard 1D3D cyclone (Fig. 5) has the same inlet dimensions as the 2D2D or might have the original 1D3D inlet with height of D and width D/8. Also, it has a design inlet velocity of 16.3 ± 2 m/s (3200 ± 400 fpm).
The objective of this study was the develop-ment of PM2.5 emission factors for cotton gin 3rd
at each gin. When testing for this project began in 2008, OTM27 was the EPA method for determina-tion of PM10 and PM2.5 from stationary sources. In
December 2010, OTM27 was replaced with a re-vised and finalized Method 201A (CFR, 2010). The revised Method 201A was a successor to OTM27. The two methods were similar to the point that EPA stated in an answer to a frequently asked question for Method 201A (EPA, 2010) that “If the source was using OTM 27 (and 28) for measuring either PM10
or PM2.5 then using the revised reference methods
Method 201A (and 202) should not be a concern and should give equivalent results.” Accordingly, OTM27 is no longer an EPA method that can be cited, and the revised Method 201A will be cited in this manuscript. Using Method 201A to sample PM2.5, the particulate-laden stack gas was withdrawn
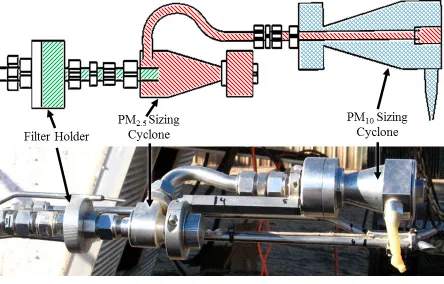
isokinetically (the velocity of the gas entering the sampler was equal to the velocity of the gas in the stack) through a PM10 sizing cyclone and a PM2.5
sizing cyclone, and then collected on an in-stack filter (Fig. 6). The methods for retrieving the filter and conducting acetone washes of the sizing cyclones are described in detail in Method 201A (CFR, 2010). The mass of each size fraction was determined by gravimetric analysis and included: > 10 µm (PM10
sizing cyclone catch acetone wash); 10 to 2.5 µm (PM10 sizing cyclone exit acetone wash and PM2.5
sizing cyclone catch acetone wash); and ≤ 2.5 µm (PM2.5 sizing cyclone exit acetone wash and filter).
The PM2.5 mass was determined by adding the mass
of particulates captured on the filter and the ≤ 2.5 µm wash. The PM10 mass was determined by adding the
PM2.5 mass and the mass of the 10 to 2.5 µm wash.
Total particulate was determined by adding the PM10
mass and the mass of the > 10 µm wash.
METHODS
Two advisory groups were established for this project. The industry group consisted of cotton gin-ning industry leaders and university and government researchers. The air quality group included members from state and federal regulatory agencies and uni-versity and government researchers. Both groups were formed to aid in project planning, gin selection, data analyses, and reporting. The project plan was described in detail by Buser et al. (2012).
Seven cotton gins were sampled across the cot-ton belt. Key factors for selecting specific cotcot-ton gins included: 1) facility location (geographically di-verse), 2) industry representative production capacity, 3) typical processing systems, and 4) equipped with properly designed and maintained 1D3D cyclones. Operating permits, site plans, and aerial photographs were reviewed to evaluate potential sites. On-site vis-its were conducted on all candidate gins to evaluate the process systems and gather information including system condition, layout, capacities, and standard operation. Using this information, several gins from each selected geographical region were selected and prioritized based on industry advisory group discus-sions. Final gin selection from the prioritized list was influenced by crop limitations and adverse weather events in the region.
Based on air quality advisory group consensus, EPA Other Test Method 27 (OTM27) was used to sample the 3rd stage seed-cotton cleaning system
Figure 5. 2D2D and 1D3D cyclone schematics.
Figure 6. EPA Method 201A PM10 and PM2.5 sizing cyclones
and in-stack filter holder schematic (CFR, 2010) and
Figure 7 shows the performance curves for the PM10 and PM2.5 sizing cyclones. To measure both
PM10 and PM2.5, Method 201A requires selecting a
gas sampling rate in the middle of the overlap zone of the performance curves for both sizing cyclones. For this study, the method was specifically used to collect filterable PM2.5 emissions (solid particles emitted by
a source at the stack and captured in the ≤ 2.5 µm wash and on the filter [CFR, 2010]). The PM10
siz-ing cyclone was used to scrub larger particles from the airstream to minimize their impact on the PM2.5
sizing cyclone. Thus, the gas sampling rate was targeted to optimize the PM2.5 cyclone performance.
Only one stack from each 3rd stage seed-cotton
(A18-4, Fisher Chemical, Pittsburgh, PA; assay ≥ 99.5%). Filters, wash tubs, and lids were prelabeled and preweighed and stored in sealed containers at the USDA-ARS Air Quality Lab (AQL) in Lubbock, TX, and then transported to each test site. Prior to testing, the certified stack testing technician conducted cali -brations and checks on all stack sampling equipment according to EPA Method 201A.
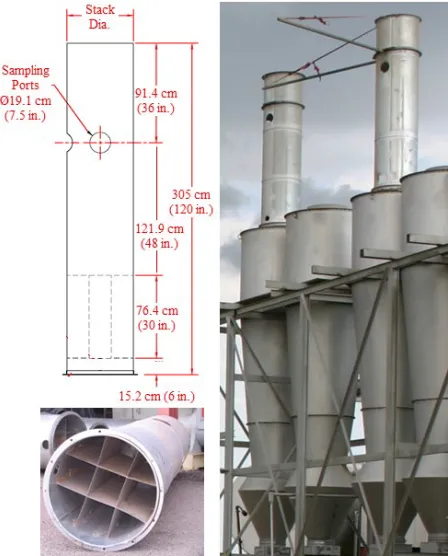
Each cyclone tested was fitted with a cyclone stack extension that incorporated two sampling ports (90° apart) and airflow straightening vanes to elimi -nate the cyclonic flow of the air exiting the cyclone (Fig. 8). The extensions were designed to meet EPA criteria (EPA, 1989) with an overall length of 3 m (10 ft) and sampling ports 1.2-m (48-in) downstream from the straightening vanes and 0.9-m (36-in) up-stream from the extension exit.
Figure 7. Acceptable sampling rate for combined cyclone
heads (CFR, 2010). Cyclone I = PM10 sizing cyclone and
Cyclone IV = PM2.5 sizing cyclone (gas temperatures for
the 3rd stage seed-cotton cleaning systems tested ranged
from 26 to 50°C [79-123°F]).
cleaning system was tested. For systems with mul-tiple stacks, it was assumed that emissions from each stack of the system were equivalent and the total emissions were calculated by multiplying the mea-sured emission rates by the total number of cyclones used to control the process tested (EPA, 1996a). To obtain reliable results, the same technician from the same certified stack sampling company (Reliable Emissions Measurements, Auberry, CA), trained and experienced in stack sampling cotton gins, conducted the tests at all seven cotton gins.
All stack sampling equipment, including the sizing cyclones, was purchased from Apex Instru-ments (Fuquay-Varina, NC) and met specifications of Method 201A. The sampling media were 47-mm Zefluor filters (Pall Corporation, Port Washington, NY) and the sample recovery and analytical reagent was American Chemical Society certified acetone
Figure 8. Schematic and photographs of stack extensions
with sampling ports and staightening vanes (rail attached
to extension above sampling port, at right, supports sampling probe during testing traverse).
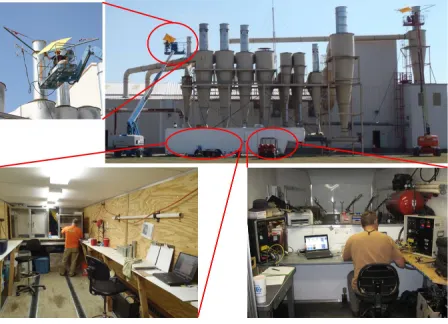
The tests were conducted by the certified stack sampling technician in an enclosed sampling trailer at the base of the cyclone bank (Fig. 9). Sample retrieval, including filters and sampler head acetone washes, was conducted according to Method 201A. After retrieval, filters were sealed in individual Petri
with preweighed lids and placed in individual plas-tic bags for transport to the AQL in Lubbock, TX for gravimetric analyses. During testing, bale data (ID number, weight, and date/time of bale pressing) were either manually recorded by the bale press operator or captured electronically by the gin’s computer system for use in calculating emission factors in terms of kg/227-kg bale (lb/500-lb bale). Emission factors and rates were calculated in ac-cordance with Method 201A and ASAE Standard S582 (ASABE, 2005).
such as cotton lint content or extraneous material. Digital pictures were taken of all filters and washes for documentation purposes prior to further analyses. After the laboratory analyses were completed all stack sampling, cotton gin production, and laboratory data were merged.
Two of the seven gins were equipped with 3rd
stage seed-cotton cleaning systems. The 3rd stage
seed-cotton cleaning systems sampled at gins A and C were typical for the industry. The 3rd stage
seed-cotton cleaning systems at gin A utilized two, separate and parallel systems (Fig. 10). In each of these parallel systems, the seed-cotton material was pneumatically conveyed from the 2nd stage seed-cotton cleaning system with heated
air through a dryer to a seed-cotton cleaner. The material was separated from the airstream by the cleaner. The air from each of the parallel 3rd stage
seed-cotton cleaning systems then passed through separate fans and exhausted through separate cyclones. Gin C also utilized two, parallel 3rd
stage seed-cotton cleaning systems with single cleaners, except there were no dryers before the cleaners (Fig. 11).
Figure 9. Clockwise from top right: cotton gin stack sampling with air quality lab trailer and technicians on lifts; certified
stack sampling technician in the trailer control room
conducting tests; sample recovery in trailer clean room;
technician operating the probe at stack level.
All laboratory analyses were conducted at the AQL. All filters were conditioned in an environmen -tal chamber (21 ± 2°C [70 ± 3.6°F]; 35 ± 5% RH) for 48 h prior to gravimetric analyses. Filters were weighed in the environmental chamber on a Mettler MX-5 microbalance (Mettler-Toledo Inc., Columbus, OH; 1 µg readability and 0.9 µg repeatability) after being passed through an antistatic device. The MX-5 microbalance was leveled on a marble table and housed inside an acrylic box to minimize the effects of air currents and vibrations. To reduce recording errors, weights were digitally transferred from the microbalance directly to a spreadsheet. Technicians wore latex gloves and a particulate respirator mask to avoid contamination. AQL procedures required that each sample be weighed three times. If the standard deviation of the weights for a given sample exceeded 10 μg, the sample was reweighed. Gravimetric pro -cedures for the acetone wash tubs were the same as those used for filters.
In addition to gravimetric analyses, each sample was visually inspected for unusual characteristics,
Figure 10. Schematic of split stream, single cleaner 3rd stage
seed-cotton cleaning system with dryer (gin A).
Figure 11. Schematic of split stream, single cleaner 3rd stage
Both 3rd stage seed-cotton cleaning systems
sampled utilized 1D3D cyclones to control emis-sions (Fig. 5), but there were some cyclone design variations among the gins (Table 1 and Fig. 12). Gin C split the system exhaust flow between two cyclones in a dual configuration (side by side as op -posed to one behind another). The system airstream for gin A was exhausted through a single cyclone. Inlets on the gin A and C 3rd stage seed-cotton
cleaning cyclones were inverted 1D3D and 2D2D inlets, respectively. Expansion chambers were present on 3rd stage seed-cotton cleaning cyclones
at both gins. All of the cyclone variations outlined above, if properly designed and maintained, are recommended for controlling cotton gin emissions (Whitelock et al., 2009).
and the test average ginning rate at each gin ranged from 21.7 to 23.8 bales/h (based on 227-kg [500-lb] equivalent bales). The capacity of gins sampled was representative of the industry average, approximately 25 bales/h. The 1D3D cyclones were all operated with inlet velocities within design criteria, 16.3 ± 2 m/s (3200 ± 400 fpm), except the second run at gin A was outside the design range due to limitations in available system adjustments.
There are criteria specified in EPA Method 201A for test runs to be valid for PM2.5, PM10, or total
particulate measurements (CFR, 2010). Isokinetic sampling must fall within EPA defined ranges (100 ± 20%) for valid PM2.5 and PM10 test runs. All tests
met the isokinetic criteria (Table 2). To use Method 201A to obtain total filterable particulate also, sampling must be within 90 to 110% of isokinetic flow. This criterion was met for all test runs. The PM2.5 aerodynamic cut size must fall within EPA
defined ranges (2.50 ± 0.25 µm) for valid PM2.5 test
runs. All test runs met the PM2.5 aerodynamic cut
size criteria. The PM10 aerodynamic cut size must
fall within EPA defined ranges (10.0 ± 1.0 µm) for valid PM10 test runs. PM10 cut size criteria were
not met in test run one and two for gin A, thus the data associated with these runs were omitted from the PM10 test averages.
Sampling rates ranged from 11.3 to 12.6 stan-dard l/min (0.40-0.45 stanstan-dard ft3/min) (Table 2).
The stack gas temperatures ranged from 26 to 50°C (79-123°F). The sampling method documentation (CFR, 2010) warns that the acceptable gas sampling rate range is limited at the stack gas temperatures encountered during this project’s testing, as indicated by the narrow difference between the solid lines in Fig. 7 for the temperatures listed above. These stack gas characteristics justified targeting the PM2.5 cut
size criteria and treating the PM10 cut size criteria
as secondary.
Figure 12. Cyclone design variations for the tested systems (left to right): dual configuration that splits flow between identical 1D3D cyclones with 2D2D inlets; 1D3D cyclone with an inverted 1D3D inlet; and 1D3D cyclone with 2D2D
inlet and expansion chamber on the cone.
Table 1. Abatement device configurationz for 3rd stage seed-cotton cleaning systems tested.
Gin Cyclone Type Inlet Designy Systems
per Gin
Cyclones
per Gin Configuration Cone Design
Trash Exits tox
A 1D3D inverted 1D3D 2 2 single expansion chamber hopper
C 1D3D 2D2D 2 4 dual expansion chamber hopper
z Figures 5 and 12
y Inverted 1D3D inlet has duct in line with the bottom of the inlet
x Systems to remove material from cyclone trash exits: hopper = large storage container directly under cyclone trash exit RESULTS
Table 2 shows the test parameters for each Method 201A test run for the 3rd stage seed-cotton
PM2.5 emissions data (ginning and emission
rates and corresponding emission factors) for the 3rd stage seed-cotton cleaning systems are shown
in Table 3. The system average PM2.5 emission
factor was 0.0040 kg/bale (0.0088 lb/bale). The test average emission factors at each gin ranged from 0.0031 to 0.0049 kg (0.0068-0.011 lb) per bale and PM2.5 emission rates ranged from 0.073
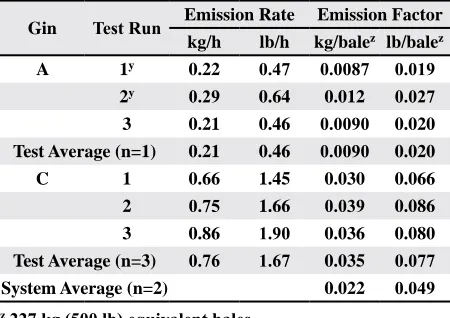
to 0.11 kg/h (0.16-0.23 lb/h). PM10 emissions data
(ginning and emission rates and corresponding emission factors) for the 3rd seed-cotton
clean-ing systems are shown in Table 4. The system average PM10 emission factor was 0.022 kg/bale
(0.049 lb/bale). The test average emission factors ranged from 0.0090 to 0.035 kg (0.020-0.077 lb) per bale and emission rates ranged from 0.21 to 0.76 kg/h (0.46-1.67 lb/h). Total particulate emissions data (ginning and emission rates and corresponding emission factors) for the 3rd
seed-cotton cleaning systems are shown in Table 5. The system average total particulate emission factor was 0.029 kg/bale (0.063 lb/bale). The test average emission factors ranged from 0.013 to 0.044 kg (0.029-0.098 lb) per bale. Test average total particulate emission rates ranged from 0.32 to 0.96 kg/h (0.70-2.12 lb/h). The ratios of PM2.5
to total particulate, PM2.5 to PM10, and PM10
to total particulate were 13.8, 18.0, and 76.5%, respectively (ratios calculated using Tables 3, 4, and 5 might vary slightly from those listed due to rounding).
Table 2. Cotton gin production data and stack sampling performance metrics for the 3rd stage seed-cotton cleaning systems.
Gin Test
Run
Ginning Rate bales/hz
Cyclone Inlet
Velocity Isokinetic Sampling
%
Aerodynamic Cut
Size D50 Sampling Rate
y Stack
Temperature
m/s fpm PM2.5 µm PM10 µm slpm scfm °C °F
A 1 24.7 17.9 3528 101 2.54 11.1x 11.4 0.403 26 79
2 23.5 18.3 3611 98 2.57 11.2x 11.3 0.399 26 79
3 23.2 18.0 3536 110 2.29 10.5 12.4 0.438 27 80
Test Average 23.8 18.1 3558
C 1 21.9 16.6 3260 101 2.37 10.8 12.3 0.436 50 123
2 19.4 16.8 3302 99 2.39 10.9 12.2 0.431 49 121
3 23.9 16.4 3230 105 2.30 10.6 12.6 0.446 50 122
Test Average 21.7 16.6 3264
System Average 22.8 17.3 3411
z 227 kg (500 lb) equivalent bales
y slpm = standard l/min, scfm = standard ft3/min
x Did not meet PM
10 (10.0 ± 1.0 µm) aerodynamic cut size criteria
Table 3. PM2.5 emissions data for the 3rd stage seed-cotton
cleaning systems.
Gin Test Run Emission Rate Emission Factor kg/h lb/h kg/balez lb/balez
A 1 0.072 0.16 0.0029 0.0064
2 0.10 0.23 0.0044 0.010
3 0.045 0.10 0.0019 0.0043
Test Average (n=3) 0.073 0.16 0.0031 0.0068
C 1 0.10 0.21 0.0044 0.010
2 0.10 0.21 0.0049 0.011
3 0.12 0.27 0.0052 0.012
Test Average (n=3) 0.11 0.23 0.0049 0.011
System Average (n=2) 0.0040 0.0088
z 227 kg (500 lb) equivalent bales
Table 4. PM10 emissions data for the 3rd stage seed-cotton
cleaning systems.
Gin Test Run Emission Rate Emission Factor kg/h lb/h kg/balez lb/balez
A 1y 0.22 0.47 0.0087 0.019
2y 0.29 0.64 0.012 0.027
3 0.21 0.46 0.0090 0.020 Test Average (n=1) 0.21 0.46 0.0090 0.020
C 1 0.66 1.45 0.030 0.066
2 0.75 1.66 0.039 0.086
3 0.86 1.90 0.036 0.080
Test Average (n=3) 0.76 1.67 0.035 0.077
System Average (n=2) 0.022 0.049
z 227 kg (500 lb) equivalent bales
y Test run omitted from test averages because aerodynamic
The 3rd seed-cotton cleaning system total
par-ticulate emission factor average for this project was about 66.8% of the EPA AP-42 published value for the No. 3 dryer and cleaner (EPA, 1996a, b), which is an equivalent system to the 3rd stage seed-cotton
cleaning system. The range of test average total particulate emission factors determined for this project and the range of AP-42 emission factor data overlapped. The 3rd seed-cotton cleaning system
PM10 emission factor average for this project was
1.47 times the EPA AP-42 published value for the No. 3 dryer and cleaner. The test average PM10
emis-sion factor range encompassed the AP-42 emisemis-sion factor data range.
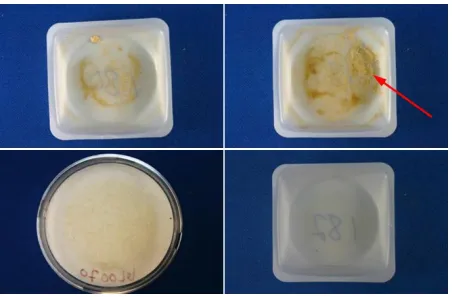
Figure 13 shows an example of samples recov-ered from a typical 3rd stage seed-cotton cleaning
system test run. Often, there were cotton lint fibers, which have cross-sectional diameters much greater than 2.5 µm, in the cotton gin cyclone exhausts. Therefore, it was not unusual to find lint fiber in the > 10 µm wash from Method 201A. However, in the test run shown, lint fibers passed through the PM10
cyclone and collected in the 10 to 2.5 µm wash. This type of material carryover can bias the gravimetric measurements and impact reported PM10 emissions
data. EPA Method 201A does not suggest methods to account for these anomalies. Thus, no effort was made to adjust the data reported in this manuscript to account for these issues.
SUMMARY
Seven cotton gins across the U.S. cotton belt were stack sampled using EPA Method 201A to fill the data gap that exists for PM2.5 cotton gin
emis-sions data. Two of the seven gins were equipped with 3rd stage seed-cotton cleaning systems. The
tested systems were similar in design and typical of the ginning industry. All the systems were equipped with 1D3D cyclones for emissions control with some slight variations in inlet and cone design. In terms of capacity, the two gins were typical of the industry; averaging 22.8 bales/h during testing. Some test runs were excluded from the test averages because they failed to meet EPA Method 201A test criteria. Also, other test runs included in the analyses had cotton lint fibers that collected in the ≤ 10 µm and/or ≤ 2.5 µm samples. This larger lint material can impact the reported emissions data, but EPA Method 201A does not suggest methods to account for these anomalies. Average measured 3rd stage seed-cotton cleaning
system PM2.5 emission factor based on the two gins
tested (six total test runs) was 0.0040 kg/227-kg bale (0.0088 lb/500-lb bale). The 3rd stage seed-cotton
cleaning system emission factors for PM10 and total
particulate were 0.022 kg/bale (0.049 lb/bale) and 0.029 kg/bale (0.063 lb/bale), respectively. The gin test average PM2.5, PM10, and total particulate
emis-sion rates ranged from 0.073 to 0.11 kg/h (0.16-0.23 lb/h), 0.21 to 0.76 kg/h (0.46-1.67 lb/h), and 0.32 to 0.96 kg/h (0.70-2.12 lb/h), respectively. System aver-age PM10 emission factors were higher and system
average total particulate emission factors were lower than those currently published in EPA AP-42. The ratios of 3rd stage seed-cotton cleaning system PM
2.5
to total particulate, PM2.5 to PM10, and PM10 to total
particulate were 13.8, 18.0, and 76.5%, respectively. These data are the first published data to document PM2.5 emissions from 3rd stage seed-cotton cleaning
systems at cotton gins.
Table 5. Total particulate emissions data for the 3rd stage
seed-cotton cleaning systems.
Gin Test Run Emission Rate Emission Factor kg/h lb/h kg/balez lb/balez
A 1 0.28 0.62 0.011 0.025
2 0.37 0.82 0.016 0.035
3 0.30 0.65 0.013 0.028
Test Average (n=3) 0.32 0.70 0.013 0.029
C 1 0.87 1.91 0.040 0.087
2 0.90 1.98 0.046 0.102
3 1.12 2.48 0.047 0.104 Test Average (n=3) 0.96 2.12 0.044 0.098
System Average (n=2) 0.029 0.063
z 227 kg (500 lb) equivalent bales
Figure 13. EPA Method 201A filter and sampler head acetone
washes from the 3rd stage seed-cotton cleaning system with
lint in the 10 to 2.5 µm wash. Clockwise from top left: >
ACKNOWLEDGMENTS
The authors appreciate the cooperating gin man-agers and personnel who generously allowed and endured sampling at their gins. In addition, we thank California Cotton Ginners’ and Growers’ Association, Cotton Incorporated, San Joaquin Valleywide Air Pollution Study Agency, Southeastern Cotton Gin-ners’ Association, Southern Cotton GinGin-ners’ Associa-tion, Texas Cotton Ginners’ AssociaAssocia-tion, Texas State Support Committee, and The Cotton Foundation for funding this project. The authors also thank the Cot-ton Gin Advisory Group and Air Quality Advisory Group for their involvement and participation in planning, execution, and data analyses for this proj-ect that is essential to developing quality data that will be used by industry, regulatory agencies, and the scientific community. The advisory groups included: the funding agencies listed above, California Air Resources Board, Missouri Department of Natural Resources, National Cotton Council, National Cot-ton Ginners’ Association, North Carolina Depart-ment of EnvironDepart-ment and Natural Resources, San Joaquin Valley Air Pollution Control District, Texas A&M University, Texas Commission on Environ-mental Quality, USDA-NRCS National Air Quality and Atmospheric Change, and U.S. Environmental Protection Agency (national, Region 4 and 9).
DISCLAIMER
Mention of trade names or commercial prod-ucts in this publication is solely for the purpose of providing specific information and does not imply recommendation or endorsement by the Oklahoma State University or U.S. Department of Agriculture. Oklahoma State University and USDA are equal opportunity providers and employers.
REFERENCES
American Society of Agricultural and Biological Engineers (ASABE). 2005. Cotton Gins—Method of Utilizing Emission Factors in Determining Emission Parameters. ASAE S582, March 2005. American Society of
Agricul-tural and Biological Engineers, St. Joseph, MI. American Society of Agricultural and Biological Engineers
(ASABE). 2007. Temperature Sensor Locations for Seed-Cotton Drying Systems. ASAE S530.1, August 2007. American Society of Agricultural and Biological Engineers, St. Joseph, MI.
Buser, M.D., D.P. Whitelock, J.C. Boykin, and G.A. Holt. 2012. Characterization of cotton gin particulate matter emissions—Project plan. J. Cotton Sci. 16:105–116. Code of Federal Regulations (CFR). 2006. National ambient
air quality standards for particulate matter; final rule. 40 CFR, Part 50. U.S. Government Printing Office, Wash -ington, D.C.
Code of Federal Regulations (CFR). 2010. Method — De-termination of PM10and PM2.5emissions from stationary
sources (Constant sampling rate procedure). 40 CFR 51, Appendix M. Available at http://www.epa.gov/ttn/emc/ promgate/m-201a.pdf (verified 19 Aug. 2013).
Environmental Protection Agency (EPA). 1989. Particulate
sampling in cyclonic flow. U.S. Environmental Protec -tion Agency, Washington, DC. Available online at http:// www.epa.gov/ttn/emc/guidlnd/gd-008.pdf (verified 19 Aug. 2013).
Environmental Protection Agency (EPA). 1996a. Emission factor documentation for AP-42, Section 9.7, Cotton Ginning (EPA Contract No. 68-D2-0159; MRI Project No. 4603-01, Apr. 1996). Publ. AP-42. U.S. Environ-mental Protection Agency, Washington, DC.
Environmental Protection Agency (EPA). 1996b. Food and agricultural industries: Cotton gins. In Compilation of air pollution emission factors, Volume 1: Stationary Point and Area Sources. Publ. AP-42. U.S. Environmental Protection Agency, Washington, DC.
Environmental Protection Agency (EPA). 2010. Frequently
asked questions (FAQS) for Method 201A [Online].
Available at http://www.epa.gov/ttn/emc/methods/metho-d201a.html (verified 19 Aug. 2013).
National Agricultural Statistics Service (NASS).1993-2012.
Cotton Ginnings Annual Summary [Online]. USDA
National Agricultural Statistics Service, Washington, DC. Available at http://usda.mannlib.cornell.edu/MannUsda/ viewDocumentInfo.do?documentID=1042 (verified 19 Aug. 2013).
Valco, T.D., H. Ashley, J.K. Green, D.S. Findley, T.L. Price, J.M. Fannin, and R.A. Isom. 2012. The cost of gin-ning cotton—2010 survey results. p. 616–619 In Proc. Beltwide Cotton Conf., Orlando, FL. 3-6 Jan. 2012. Natl. Cotton Counc. Am., Memphis, TN.
Valco, T.D., B. Collins, D.S. Findley, J.K. Green, L. Todd, R.A. Isom, and M.H. Wilcutt. 2003. The cost of ginning cotton—2001 survey results. p. 662–670 In Proc. Belt-wide Cotton Conf., Nashville, TN. 6-10 Jan. 2003. Natl. Cotton Counc. Am., Memphis, TN.
Valco, T.D., J.K. Green, T.L. Price, R.A. Isom, and D.S. Find-ley. 2006. Cost of ginning cotton—2004 survey results. p. 618–626 In Proc. Beltwide Cotton Conf., San Antonio, TX. 3-6 Jan. 2006. Natl. Cotton Counc. Am., Memphis, TN.
Wakelyn, P.J., D.W. Thompson, B.M. Norman, C.B. Nevius, and D.S. Findley. 2005. Why cotton ginning is con-sidered agriculture. Cotton Gin and Oil Mill Press 106(8):5–9.