Iranian journal of educational Sociology
(Interdisciplinary Journal of Education)
Available online at: http://www.iase-idje.ir/
Volume 1, Number 6, September 2017
Validation of creative problem solving questionnaire among
education principals in Tehran
Fereshteh Parsi1, Dr. Rashid Zolfaghari2*, Dr. Mehdi Kalantari3
1.Graduated from Department of Educational Management, Roudehen Department, Islamic Azad University, Roudehen Branch, Roudehen, Iran.
2.Assistant Professor, Department of Higher Education, Roudehen Department, Islamic Azad University, Roudehen, Iran.
3.Assistant Professor, Department of Higher Education, Roudehen Department, Islamic Azad University, Roudehen, Iran.
Article history:
Received date: 23 April 2017 Review date: 23 may 2017 Accepted date:17 June 2017 Printed on line: 23 September 2017
Abstract
Purpose: The purpose of this research is to identify the effective factors of creative problem solving in Tehran's education principals in order to provide an appropriate model that is done by exploratory method. Methodology: The statistical population consists of all principals of female high school in Tehran's 22 educational districts, which number is 850 people. Of this community, 304 respondents answered the questionnaire in full. The questionnaire for effective factors on creative problem solving was 47 questions in order to determine the effective factors on creative problem solving in education principals, which identified eight factors through 47 items and the components are as follows: individual characteristics of 72.58, 66.567 information, organizational atmosphere and culture 60.234, rules and regulations 59.659, and rewarding and motivational system 52.693% of the total variance. Findings: all of the observed variables measure the recognized and meaningful values of the identified factors. Discussion: Since the study found that the model has a very good validity and credibility, it can be used as an appropriate diagnostic tool for selecting managers. .
Keywords:
Effective factors on creative problem solving, individual, information, organizational atmosphere and culture, rules and regulations, rewarding and motivational system.
Please cite this article as: Parsi, F. Zolfaghari, R. Kalantari, M . (2017). Validation of creative problem solving
questionnaire among education principals in Tehran, Iranian journal of educational Sociology, 1(6), 47-61
*Corresponding Author Email: [email protected]
1. Introduction
The most important feature of current millennium is uncertainty, complexity, globalization and increasingly technological change, organizational success necessitates a shift in organizational activities, and in particular the management and administration of third millennium organizations under these circumstances. In fact, by increasing the transformations pace in the present world of the information and communication, and due to the volatility and unpredictability of these changes, the thing that can help countries in the world, especially developing ones. In order to increase productivity and their development and advancement is using opportunities to compete with other countries, this is not possible, except with the managerial tact and creativity, as well as the influence of managers on the creativity of employees who work together to grow their organization and the result is a community to work (Keizuri and Hosseini Dolatabadi, 2015).
In today's organizational world, creative managers, organizations, and employees are the cornerstones of creativity triangle, which is not meant to be creative at all if one of them is not creative and innovative. Essential elements of creativity are the proper organizational structure, support, encouragement and rewarding managers, and the context and creativity is a requirement that organizations must provide to achieve the desired goals. Creative managers are the ones who can feel happy about their creative results, thanks to their own personal desire or the training they have seen, even when their own role is to achieve these indirect results. Management is a specialty whose success depends on succeeding others (Bagheri Zadeh, 2013) and the art of a creative director is using others’ creativity and finding creative minds (BavaHarji et al., 2016).
2. literature review
School management is considered to be the most important factor for change and innovation in education, because teaching and learning, which is the focus of all educational activities, are mainly carried out at school. Therefore, considering the role of managers in organizations and collections, especially educational systems, is creativity and innovation are essential and important factors of the system; because the director can create, promote and encourage the ability of creativity and creative solution of problems or their behavior or his performance can prevent this vital issue. This study is identifying the effective factors on the problem solving in the principals of the Tehran’s educational system to provide a suitable model. It is hoped that the results of this study, aimed at designing and achieving a structural model could identify both suitable solutions for principals and identify the components of problem solving, can help the authorities in this way (Keizuri and Hosseini Dolatabadi, 2015).
In todays’ competitive world, creativity and the creation of new thoughts and ideas of the managers and staff of the organization as the most valuable asset of the organization is very important. In fact, organizations need new thoughts and ideas to survive and continue their positive and constructive role, to ensure their dynamism through new perspectives; otherwise, they will be condemned to death, as the resistance of organizations to various environmental changes will eliminate them or diminish their role and will not even be able to maintain the status quo. Nowadays, novelty and creativity and innovation in the organization are a suitable strategy for adapting it to the complex environment of their business. In fact, today's motto "if you are not creative, you will be doomed" is a serious warning to organizations. Creativity in literary sense means "Creation," or "Intelligence," and "The Power of Creating new things." In psychological point of view, "creativity" means creating something from something else in a unique way. In other
words, creativity means either minimizing or expanding a phenomenon and transforming it or combining it with other phenomena, objects or things (Pir Khaefi, 2005).
The concept of creativity refers to the abilities that a person can offer new and useful thoughts. One can clearly understand new and important relationships and can raise unprecedented but important questions. Scientific, artistic, industrial, agricultural creativity and having new insights on political, economic and social issues are the result of a thinking style called creative thinking (Shoari Nejad, 2008). The concept of creative thinking is a type of thinking that leads to new perspectives, emerging approaches, new perspectives and new ways of understanding and understanding things and situations. According to Bed et al. (2005), creative thinking is thought to be a type of intellectual activity that solves difficult and unresolved problems; or finds new solutions to unresolved issues. A person with creative thinking can concentrate his mind on one thing and give him enough energy to clarify the reality by creating a clear and understandable picture in his mind and ultimately solving the problem. A person with creative thinking develops his mind to new possibilities, new values and new concepts (Bergelman, 2006; Kanter, 2000).
Studies on creativity emphasize this view that creativity is an important factor in competing ability and national development. Managers of organizations, especially educators, are among those who need to have high level of creativity and innovation in their management process, in order to manage the organization's affairs properly. Planning, organizing, and controlling are among the tasks that a skillful manager should have, and in practice, work in accordance with the conditions they are facing. Making the right decisions requires the ability to solve problems creatively with current and even unpredictable problems of the organization. In fact, solving the problem is an integral part of organizational life, and a dedicated and caring manager should have the ability to present creative ideas in appropriate circumstances, and to present the problems and challenges posed by a new method and an initiative that leads to the productivity of the organization. Especially in today's changing conditions, which every second comes with fundamental changes around the world, especially in the field of education and learning, the need to solve problems and provide new solutions is very important. But the question is, in which case, what model can be used to provide a useful solution. Based on this, the question of the researcher is that what factors affect the thinking of the creative solution of the problem and what models can be presented in this among the managers of the educational districts of Tehran? In fact, what is essential is to design a pattern as a structural equation (mathematical equations) so that we can identify both the appropriate methods and the main problem of this research, which is the achievement of the structural model is appropriate, to answer.
3. Methodology
The research method is exploratory. In this research, first, the items were identified and reviewed based on the review of theoretical fundamentals and initial extraction, then they were presented with the sample of the study. After implementation, using exploratory factor analysis, factors were identified and based on loading factor, their names were selected and after validation based on Cronbach’s alpha, and the model was validated using structural equation modeling. The statistical population consists of all principals of female high school in Tehran's 22 educational districts, which the number is 850 people. To determine the sample size, based on the Morgan table 265 people were required, which should be selected as samples. Based on experience and studies, it was anticipated that this required minimum was not provided. Therefore, the sample size was increased to 330 people. Finally, 304 questionnaires were returned and analyzed. The questionnaire consisted of closed-ended questions with a five-dimensional questionnaire on
identifying factors affecting the creative problem solving among managers of Tehran's educational districts, which was completed by a survey of managers of Tehran's educational districts. The categorization of the questionnaire includes:1) Factors Affecting Creative Problem Solving: Includes 1 item in order to determine the factors influencing the creative problem solving in the education managers, through 47 items, examines the following eight factors: a)Individual features: Items 1 to 12 b) Information: Items 13 to 20 c) Organizational atmosphere and Culture: Items 21 to 30 d)Terms and Conditions: Items 31 to 37 e)Reward and Motivational System: Items 38 to 47f) To determine its reliability and validity, the Cronbach Alpha test was used as follows: 1) The component of individual characteristics: items 1 to 12, Cronbach's Alpha is 0.89 2) Information: Items 13 to 20, Cronbach Alpha is 0.92 3)Organizational atmosphere and culture: Items 21 to 30, Cronbach alpha is 0.91 4)Rules and Regulations: item 31 to 37, Cronbach Alpha is 0.87 5)Reward and Motivational System: Items 38 to 47, Cronbach Alpha is 0.91. The experts and professionals’ opinions were used to calculate the validity of the questionnaire. In fact, 9 of 10 associate professors of Ph.D. Degrees approved the validity of the questionnaire (90/0).
Since the main question of the present research is, are the indicators used to measure the components, the ability to measure the individual factors, information, the atmosphere and organizational culture, rules and regulations, have the reward and incentive system? To answer this question and achieving the research purpose, the data after the compilation was tested using the structural equation modeling technique. Mean, standard deviation, skewness, Kurtosis and correlation coefficient of the research variables. Then, data preparation and screening were discussed, especially at this stage, the main assumptions of structural equation modeling (SEM) including missing data, normality, linearity, coherency and multicollinearity were investigated. Finally, the research questions were answered.
4. Findings
The extracted framework has five components: A)Individual component features include: 1)A person's ability to provide innovative solutions 2)A person's ability to discuss differences in the values, principles and policies of the organization 3)The person's willingness to participate (joining the formal and informal social groups) 4)The ability of an individual to implement and follow organizational plans 5)A person's ability to provide logic that is difficult to dismiss 6)A person's ability to understand the feelings and aspirations of others 7)One's ability to advise on problem solving 8)One's ability to win others confidence 9)A person's ability to encourage employees who have a new style and idea 10)Person's ability to motivate employees 11)A person's ability to communicate with people who think differently from him 12)A person's ability to use others' experiences.
To answer the question, are the indicators used in this factor to be able to measure a factor as individual factors? Exploratory factor analysis was performed using the principal component analysis method. The results showed that the Kieser-Mir-Uliken index was equal to 0. 854, indicating that the sample size is suitable for exploratory factor analysis. The Bartlett Brightness index was statistically significant, indicating that the correlation matrix of variables formed a single matrix. The results of the analysis showed that there is only one factor with an IGV greater than one, which explains total 72.58% of the total variance.
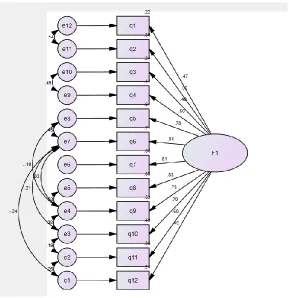
Factor analysis, confirmatory factor analysis was performed using AMOS version 22 in order to ensure the validity of the result obtained from exploratory. The analysis was performed using the Maximum Likelihood Prognosis (ML) method and the study of the fitness indices showed that the Chi-square index (p <0.05, 695.410) was significant at 0.05. This suggests that the model does
not fit well with the data. However, the evaluation of other fitness indices (CFI = 0.712, GFI = 669.0, AGFI = 522.0 RMSEA = 0.204) showed inappropriate values of CFI, GFI and AGFI indices of RMSEA greater than 0.08 (Maximum value which is considered by many experts to be acceptable. Therefore, the correct indices in the AMOS program were examined in order to reduce the value of the RMSEA. This implies that the model is fitted with data, or, in other words, the theoretical model is fitted to the collected data. Corresponding to expectation, due to the lack of significance of the QI index, other indicators were also improved (CFI = 0.998, GFI = 995.0 = AGFI = 0.948) and eventually the RMSEA value was reduced to 0.112. Finally, the results showed that the lowest standard factor load belongs to the indicator of the first question, which is equal to 0.47, and the highest factor load belongs to the indicator of question 6, which is equal to 0.84, indicating that all observed variables are considered as acceptable and meaningful factors that measure individual characteristics.
Figure 1: SCERI test to extract the number of factors
Table 1. Factor loads of component matrix and communality Values of Variables in the factor of Individual features Variables Factor Communality
Question 1 0.580 0.611 Question 2 0.669 0.729 Question 3 0.608 0.643 Question 4 0.730 0.745 Question 5 0.796 0.802 Question 6 0.802 0.836 Question 7 0.774 0.681 Question 8 0.825 0.836 Question 9 0.771 0.823 Question 10 0.741 0.752 Question 11 0.697 0.665 Question 12 0.572 0.588
Table 2. presents the estimation of unstandardized parameter, standardized parameter, standard error, and critical ratio for each indicator of individual features factor.
*P<0.05 ‘**P<0.01
2. The information component includes following items: 13) Creating opportunities for
employees to join a knowledge or learning network 14)The organization has sufficient procedures for sharing information 15)Organizational feedback to employees on how they work 16)Provide documents and records to employees 17)Making programs for the creation and production of knowledge 18)Openness of the organization's reward and punishment structure 19)Knowledge of the person in the correct use of the obtained information 20)Using the database to store information.
In response to the question of whether the indicated markers have the capability to measure the factor as the information factor? Exploratory factor analysis was performed using the principal component analysis method. The results showed that the Kayser-Mir-Olikan index (KMO) was 0.803 and the Bartlett Brightness index was statistically significant (p <0.001, 744/642). Therefore, it can be concluded that the variables are not independent and there is an acceptable level of correlation between them that can be expected to emerge clusters or clusters. In total, 66.567 percent of the total variance is explained.
In order to ensure the validity of the obtained results from the exploratory factor analysis of the psychological variables, confirmatory factor analysis was performed using AMOS version 22 software. The analysis was performed using the Maximum Likelihood Estimation (ML) method and the study of the fitness indices showed that the chi-square index (p <0.05, pp. 388.196) was significant at 0.05. This suggests that the model does not fit well with the data. However, the evaluation of other fitness indicators (CFI = 0.720, GFI = 0.762, AGFI = 0.572, RMSEA = 0.236) did not fit well with the data. Therefore, the correct indices in the AMOS program were examined in order to reduce the value of the RMSEA. This implies that the model is fitted with data, or, in
other words, the theoretical model is fitted to the collected data. In accordance with expectation, due to insignificant QI index, other indicators were also improved (CFI = 0.905, GFI = 0.978, AGFI = 0.932) and finally, RMSEA value decreased to 0.090 and the lowest load of standard factor belongs to the indicator of question 13, which is equal to 0.521, and the highest factor load belongs to the indicator of question 15, which is equal to 0.766. In general, all observed variables measure the amount of information that is acceptable and meaningful.
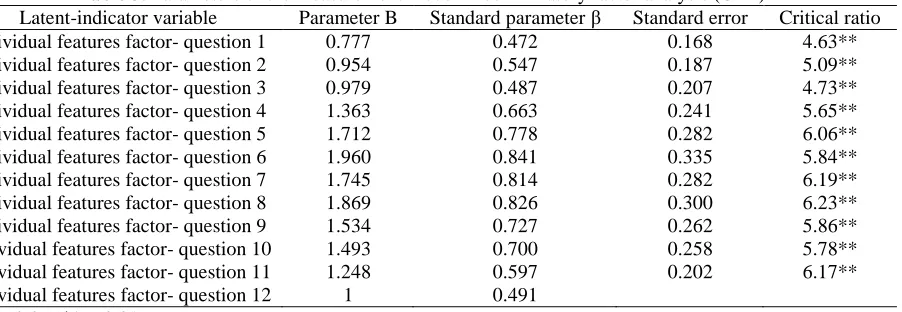
Table 3. Parameters of the measurement model in confirmatory factor analysis (CFA)
Latent-indicator variable Parameter B Standard parameter β Standard error Critical ratio Individual features factor- question 1 0.777 0.472 0.168 4.63** Individual features factor- question 2 0.954 0.547 0.187 5.09** Individual features factor- question 3 0.979 0.487 0.207 4.73** Individual features factor- question 4 1.363 0.663 0.241 5.65** Individual features factor- question 5 1.712 0.778 0.282 6.06** Individual features factor- question 6 1.960 0.841 0.335 5.84** Individual features factor- question 7 1.745 0.814 0.282 6.19** Individual features factor- question 8 1.869 0.826 0.300 6.23** Individual features factor- question 9 1.534 0.727 0.262 5.86** Individual features factor- question 10 1.493 0.700 0.258 5.78** Individual features factor- question 11 1.248 0.597 0.202 6.17** Individual features factor- question 12 1 0.491
*P<0.05 ‘**P<0.01
Table 4. Factor loads of the component matrix and the communality values of the variables in the information factor Variables Factor Communality
Question 13 0.601 0.456 Question 14 0.734 0.752 Question 15 0.781 0.790 Question 16 0.748 0.581 Question 17 0.733 0.541 Question 18 0.785 0.664 Question 19 0.729 0.851 Question 20 0.647 0.691
Table 4 presents the estimation of unstandardized parameter, standardized parameter, standard error, and critical ratio for each indicator of information factor.
Table 5. Parameters of the measurement model in confirmatory factor analysis (CFA)
Latent-indicator variable Parameter B Standard parameter β Standard error Critical ratio Information factor- question 13 0.749 0.521 0.142 5.289** Information factor- question 14 0.937 0.681 0.148 6.347** Information factor- question 15 1.070 0.766 0.158 6.793** Information factor- question 16 1.252 0.734 0.189 6.636** Information factor- question 17 1.041 0.693 0.162 6.412** Information factor- question 18 1.257 0.751 0.187 6.723** Information factor- question 19 1.160 0.652 0.188 6.177** Information factor- question 20 1 0.566
Note: Because the factor loads of question 20 have been fixed, the standard error and critical ratio are not calculated for its significant test.
Confirmatory factor analysis results by using standard estimation method
3. The organizational atmosphere and culture component includes the following: 21)
Obvious goals, roles, responsibilities and authority of the organization for everyone 22) Working school members for similar purposes 23)There is an atmosphere of encouragement and support for employees in contributions 24)Turning on business priorities for everyone 25)The importance of organization to group successes in comparison with individual achievements 26)Coordinating and organizing leadership 27)Supporting creativity in the organization 28)The organization's commitment for caring for working staff in the organization 29)Organization's willingness to accept the ideas of the members
30) Organization's support for employee risk-taking.
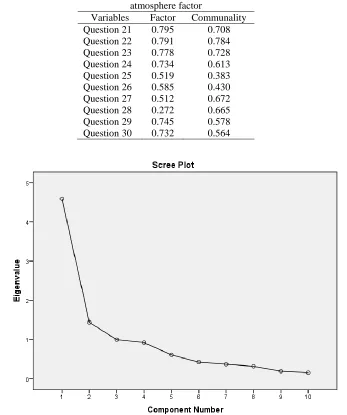
In response to the question of whether the markers are capable of measuring a factor as organizational atmosphere and organizational factors? Exploratory factor analysis was performed using principal components analysis method. The main components analysis method showed that the Kayer-Mir-Olikan index (KMO) was 0.778 and the Bartlett Sphere index was statistically significant (p <0.001, 815.811). Therefore, one can conclude that the variables are not independent and that there is an acceptable level of correlation between them that can be expected to emerge cluster(s). The results of the analysis showed that there are two factors with IGV greater than one, which accounts for a total of 60.234% of the total variance.
In order to ensure the validity of the obtained result from exploratory factor analysis, confirmatory factor analysis was performed using AMOS version 22 software. The analysis was performed using the Maximum Likelihood Estimation (ML) method and the study of the fitness indices showed that the Chi-square index (p <0.05, 198.274) was significant at the level of 0.05. This suggests that the model with data is not optimal. This indicates that the model does not fit well with the data. However, this assessment showed other fitness indices (CFI = 0.711, GFI =
0.756, AGFI = 0.598 and RMSEA = 0.219) The fit model does not fit well with the data. Therefore, in order to reduce the value of the RMSEA, the correction indices in the AMOS program were examined. This implies that the model is fitted with data, or, in other words, the theoretical model is fitted with the collected data. Corresponding to expectation, due to the inaccurateness of the Chi-square index, other indicators were also improved (CFI= 0.911, GFI = 0.908 and AGFI= 0.921), and finally, RMSEA value decreased to 0.099 and the lowest standard factor load belongs to the indicator of question 27, which is equal to 0.152 and the highest factor load belongs to the indicator of question 22, which is equal to 0.885. In general, all observed variables, other than question 27, which are the candidates for deletion, measure the perceptible and meaningful factor of organizational atmosphere and culture.
Table 6. Factor loads of the component matrix and the communality values of the variables in the organizational atmosphere factor
Variables Factor Communality Question 21 0.795 0.708 Question 22 0.791 0.784 Question 23 0.778 0.728 Question 24 0.734 0.613 Question 25 0.519 0.383 Question 26 0.585 0.430 Question 27 0.512 0.672 Question 28 0.272 0.665 Question 29 0.745 0.578 Question 30 0.732 0.564
Figure 6: SCERI test to extract the number of factors
Table 7. Parameters of the measurement model in confirmatory factor analysis (CFA)
Latent-indicator variable Parameter B Standard parameter β Standard error Critical ratio Organizational atmosphere factor- Question 21 1.507 0.834 0.184 8.206** Organizational atmosphere factor- Question 22 1.461 0.853 0.176 8.320** Organizational atmosphere factor- Question 23 1.271 0.789 0.161 7.911** Organizational atmosphere factor- Question 24 1.076 0.713 0.146 7.360** Organizational atmosphere factor- Question 25 0.475 0.389 0.107 4.450** Organizational atmosphere factor- Question 26 0.470 0.464 0.090 5.203** Organizational atmosphere factor- Question 27 0.229 0.152 0.127 1.806 Organizational atmosphere factor- Question 28 0.744 0.509 0.132 5.626** Organizational atmosphere factor- Question 29 0.917 0.633 0.136 6.729** Organizational atmosphere factor- Question 30 1 0.61
*P<0.05 ‘ **P<0.01
4. The components of the rules and regulations include the following: 31) Reducing the
bureaucracy in the organization 32) The relevance of the laws to a particular topic in the organization 33) The existence of a flexible organizational structure 34) The existence of flexible organizational procedures 35) Giving freedom to staff to act in the organization's in decision making 36) Reduce strict instructions 37) Writing organizational rules based on individual differences between employees.
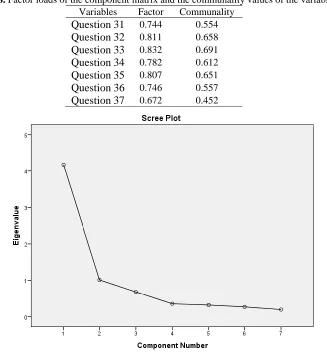
In response to the question, are the markers given the power to measure a factor as the rules of law? Exploratory factor analysis was performed using principal components analysis method. To find the number of factors, the two values of IGV were larger than one and the Katherine Scritic test was considered. The main component analysis method showed that the Kayer-Mir-Olikan index (KMO) was equal to 0.833 and the Bartlett Brightness Index was statistically significant (p <0.001, 689.638). Therefore, one can conclude that the variables are not independent and that there is an acceptable level of correlation between them that can be expected to emerge cluster(s). The
results of the analysis showed that there are two factors with IGV of greater than one, which accounts for 59.659% of the total variance.
In order to ensure the validity of the result obtained from exploratory factor analysis, confirmatory factor analysis was performed using AMOS version 22. The analysis was performed using the Maximum Likelihood Estimation (ML) method and the study of the fitness indicators showed that the chi-square index (p <0.05, pixel 726.140) was significant at the level of 0.05. This suggests that the model with data is not optimal. This indicates that the model does not fit well with the data. However, the evaluation of other fitness indices (CFI = 0.799, GFI = 0.782, AGFI = 0.564, RMSEA = 0.239) did not fit well with the data. For this reason, in order to reduce the value of the RMSEA, the correction indices in the AMOS program were examined. This implies that the model is fitted with data, or, in other words, the theoretical model is fitted with the collected data. In accordance with expectation, due to the inaccurateness of the Chi-square index, other indicators were also improved (CFI=0.907, GFI = 0.902, and AGFI = 0.911), and finally, the RMSEA value decreased to 0.089 and the lowest standard factor load belongs to the marker of question 37, which is equal to 0.563, and the highest factor load belongs to the indicator of question 33, which is equal to 0.841. In general, all measured variables measure the acceptable and meaningful factors of the rules and regulations.
Table 8. Factor loads of the component matrix and the communality values of the variables Variables Factor Communality
Question 31 0.744 0.554
Question 32 0.811 0.658
Question 33 0.832 0.691
Question 34 0.782 0.612
Question 35 0.807 0.651
Question 36 0.746 0.557
Question 37 0.672 0.452
Figure 4: SCERI test to extract the number of factors
Table 9. Parameters of the measurement model in confirmatory factor analysis (CFA)
Latent-indicator variable Parameter B Standard parameter β Standard error Critical ratio Rule and regulation factor- question 31 1.181 0.718 0.175 6.739** Rule and regulation factor- question 32 1.290 0.795 0.181 7.155** Rule and regulation factor- question 33 1.324 0.841 0.180 7.367** Rule and regulation factor- question 34 1.136 0.766 0.162 7.008** Rule and regulation factor- question 35 1.228 0.726 0.181 6.788** Rule and regulation factor- question 36 1.129 0.645 0.179 6.293** Rule and regulation factor- question 37 1 0.563
*P<0.05 ‘ **P<0.01
Confirmatory factor analysis results by using standard estimation method
5. Component of rewarding and motivational system 38)Allocating salaries to employees
on the basis of justice 39)Appreciating the organization of the staff in proportion to their efforts 40)Using financial incentives for successful employees 41)Holding celebration at various opportunities, such as the success of the change projects 42)Taking consideration of rewards for staff for learning 43)Compatibility of payment rates in the organization with the levels of employee responsibility 44)The existence of social acceptance, respect and dignity for employees 45)Allocating extra overpayments for special and difficult tasks 46)Considering the reward for creative and innovative activities
47) Allocating financial and non-financial rewards to superior employees.
In response to the question of whether the indicated markers have the potential to measure the factor as rewarding and motivating factors? Exploratory factor analysis was performed using principal components analysis method. To find the number of factors, the two values of IGV were larger than one and the Katherine Scritic test was considered. The main components analysis method showed that the Kayser-Mir-Oliken index (KMO) was equal to 0.832 and the Bartlett Brightness index was statistically significant (p <0.001, pp. 700.9 48). Therefore, one can conclude that the variables are not independent and that there is an acceptable level of correlation between them that can be expected to emerge cluster(s). The results of the analysis showed that there are
two factors with IGV larger than one, which accounts for a total of 52.693 percent of the total variance.
In order to ensure the validity of the result obtained from exploratory factor analysis, confirmatory factor analysis was performed using AMOS version 22. The analysis was carried out using the Maximum Likelihood Estimation (ML) method and the study of the fitness indices showed that the Chi-square index (p <0.05, 306.284) was significant at 0.05. This suggests that the model with data is not optimal. This indicates that the model does not fit well with the data. However, the evaluation of other fitness indicators (CFI = 0.732, GFI = 0.740, AGFI = 0.591, RMSEA = 0.212) did not fit well with the data. Therefore, in order to reduce the value of the RMSEA, the correction indices in the AMOS program were examined. This implies that the model is fitted with data, or, in other words, the theoretical model is fitted with the collected data. Corresponding to the expectation, due to the inaccurateness of the Chi-square index, other indicators were also improved (CFI= 0.900, GFI = 0.902 and AGFI = 0.903), and finally, the RMSEA value decreased to 0.091 and the lowest standard factor load belongs to the indicator of question 47, which is equal to 0.541, and the highest factor load belongs to the indicator of question 42, which is equal to 0.833. In general, all measured variables measure the acceptable and meaningful factors of the rules and regulations.
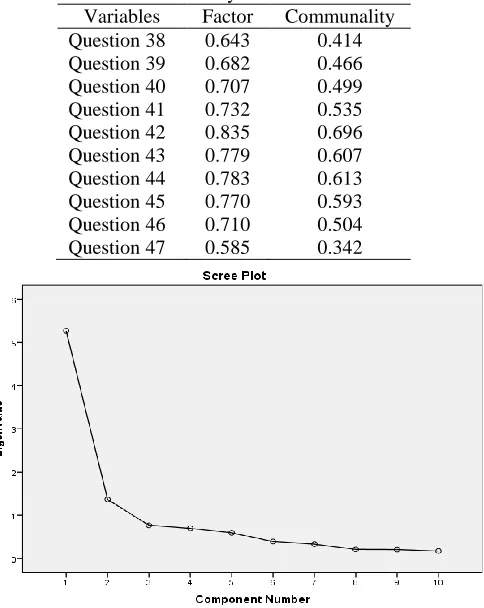
Table 10. Factor loads of the component matrix and the communality values of the variables in the rewarding and incentive system factor
Variables Factor Communality Question 38 0.643 0.414 Question 39 0.682 0.466 Question 40 0.707 0.499 Question 41 0.732 0.535 Question 42 0.835 0.696 Question 43 0.779 0.607 Question 44 0.783 0.613 Question 45 0.770 0.593 Question 46 0.710 0.504 Question 47 0.585 0.342
Figure 5. SCERI test to extract the number of factors
Table 11. Parameters of the measurement model in confirmatory factor analysis (CFA)
Latent-indicator variable Parameter B Standard parameter β Standard error Critical ratio Rewarding and incentive system- question 38 1.332 0.566 0.237 5.625** Rewarding and incentive system- question 39 1.296 0.604 0.221 5.876** Rewarding and incentive system- question 40 1.249 0.637 0.205 6.081** Rewarding and incentive system- question 41 1.638 0.698 0.255 6.421** Rewarding and incentive system- question 42 2.057 0.833 0.291 7.058** Rewarding and incentive system- question 43 1.872 0.773 0.269 6.799** Rewarding and incentive system- question 44 1.595 0.762 0.236 6.748** Rewarding and incentive system- question 45 1.630 0.749 0.244 6.687** Rewarding and incentive system- question 46 1.480 0.674 0.224 6.294** Rewarding and incentive system- question 47 1 0.541
*P<0.05 ‘ **P<0.01
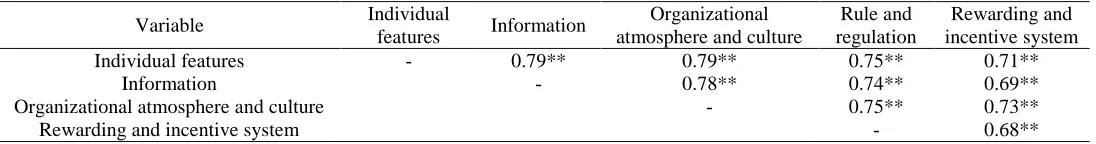
Table 11 shows the correlation between research variables, according to this table, all variables had significant relationships at the level of 0.01, and these relationships were expected in directions. According to Cohen criteria (1988), which states that correlation relationships less than 0.3 are weak, coefficients with intensity of 0.3 - 3.5 were average, and correlation relations greater than 0.5 are strong), the relationships of the variables had strong intensity.
Table 12. Correlation matrix of research variables
Variable Individual
features Information
Organizational atmosphere and culture
Rule and regulation
Rewarding and incentive system
Individual features - 0.79** 0.79** 0.75** 0.71**
Information - 0.78** 0.74** 0.69**
Organizational atmosphere and culture - 0.75** 0.73**
Rewarding and incentive system - 0.68**
This research, like other studies with some limitations, mentioned in the following:
1) One of the most important limitations of this research is that because of the large extent of the studied population, there was no simple and uniform random sampling. This may overwhelm the generalizability of the results.
2) Despite the fact that the validity and reliability of the questionnaire were investigated in the research, there is a probability of errors in the measurement of variables which may affect the generalizability of the findings.
3) Since there has been no research in Iranian society on the identification of factors affecting the creative problem solving in Tehran's education managers to provide a suitable model and there was no possibility of access in other societies. Therefore, the results of this study were not compared to other studies.
4) Despite the cooperation of 85% of the participants in this study, the community should also be cautious about revising the statistical sample and generalizing the results from this sample.
5) Other factors may have been found in the model, but not identified. It is possible to judge with other factors more effective in explaining the variance more confidently.
According to the findings of this research, the role of the five factors of the component of individual characteristics, the information component, the components of the atmosphere and the organizational culture, the component of laws and regulations, and the component of the reward and incentive system on the problem solving in the managers of education in Tehran is indisputable. So it is suggested:
1. Educational authorities and administrators undertake the necessary arrangements for selecting principals to assess the five attributes of the components of the individual characteristics,
the information component, the components of the atmosphere and the organizational culture, the component of the rules and regulations, and the component of the reward and incentive system on the creative problem solving. Provide.
2. Since the study found that the model has a very good validity and credibility, it can be used as an appropriate diagnostic tool for selecting managers.
References
Bagheri Zadeh, Ali (2013) Globalization, the World Trade Organization and the development of the South (Challenges and Opportunities Journal: Political Studies, autumn 2013 - No. 21 Scientific Research)
BavaHarji (2016) Smart school (Application of multiple intelligences in school management). Isfahan: Publication Neveshteh; 2010. [In Persian].
Bed (2005) multiple intelligences. Paper presented at the meeting of the International Conference on Educational Assessment, 1996, Sep 8-11, Washington, America. 1996: 368-85 368. Bergelman (2000). "Technical colleges and profiessional Training of the model based on Cipp and ilo". Australian Journal of Basic and Applied sciences, 5(12): 3133- 3138. (Page of 82)
Byrne, B.M. (2010). Structural equation modeling with AMOS, Basic concepts, applications and programming, 2th edition,Routledge, New York.
Cohen, J. (1988). Statistical power analysis for the behavioral sciences (2nd Ed.). New York: Academic Press. Field, A. (2006). Discovering Statistics using SPSS (2th ed), London; Sage.
Giles, D. C. (2002). Advanced research methods in psychology: New York: Rout ledge.
Hagenah (1987). (Dissertation). Compared to traditional method of teaching based on the stating of Gardner's view on mathematics performance of students in the second year of Shahriar city guides. Tehran: University Teacher Education; 2002. [In Persian]
Harrington, D. (2009). Confirmatory Factor Analysis, Oxford & New York, Oxford University Press.
Ho, R. (2006). Handbook of Univariate and Multivariate Data Analysis and Interpretation with SPSS, Boca Raton London, New York, Chapman & Hall/CRC.
Kalantari, Mahdi (2008). Statistical methods for practice and research using SPSS management. Tehran: Farhang e Sabz.
Kalantari, Mahdi and Safa kish, Mohammad Saeid (2014). Amos Application in Structural Equation Modeling. Tehran: Matin
Keizuri, Amir Hossein; Hosseini Dolatabadi, Bibi Fatimah (2015). Creativity at the conference, Second National Conference on Sustainable Development in Educational Sciences and Psychology, Social and Cultural Studies, Tehran, Islamic Studies and Research Center.
Kline, R. B. (2005). Principles and practice of structural equation modeling, edition 2, Guilford press, New York & London.
Mallinckrodt, B., Abraham, W.T., Wei, M., Russell, D.W. (2006). Advances in Testing the Statistical Significance of Mediation Effects, Journal of Counseling Psychology, 53(3), 372–378.
Meyers, L. S, Gamest.G., & Goarin, A.J. (2006). Applied multivariate research, design and interpretation, thousand oaks. London. New Deihi, Sage publication
Pir Khaefi, Ali (2011). Effectiveness of creativity training on the professional qualifications of teachers. Master's Thesis.
Tabachnick, B. G., & Fidell, L. S. (2007). Using multivariate statistics (5 th ed.). Boston: Allyn and Bacon.ashington.