Crowding out Effect of Foreign Aid in Selected
Developing Countries: Panel Data Evidence
Sadegh Bakhtiari Hojjat Izadkhasti Seyed Komail Tayebi
Received: 2012/08/11 Accepted: 2013/04/16
Abstract
ublic sector decision-makers are faced with the task of allocating resources among different alternative subject due budgetary constraints. In this paper Official Development Assistance (ODA) data have been considered as foreign aid. ODA is channeled through the public sector of recipient countries and, hence, the ultimate effect of ODA on savings or economic growth depends on how governments respond to it. This paper tries to explore the impact of official development assistance on public sector behavior in selected developing countries and contribute to the fiscal response literature on two main grounds. First, it specifies a fiscal response model. Second, using panel data model for a sample of 25 aid recipient countries in Asia and Latin America over the period 1991-2010. Empirical results indicate that official development assistance has a positive and significant effect on government investment expenditure, but it has not significantly impact on government current expenditures. Results also show that ODA crowds out both government revenue and public borrowing.
Keywords: Public Fiscal Behavior, Official Development Assistance,
Panel Data.
1- Introduction
Based on the department of Economic and Social Affairs of UN for many low income countries, Official Development Assistance remains an important vehicle for financing development given low levels of domestic
Department of Economics, Islamic Azad University, Khorasgan Branch, Isfahan, Iran Candidate of Economics, University of Isfahan, Isfahan, Iran (Corresponding Author). Department of Economics, University of Isfahan, Isfahan, Iran.
savings and limited access to private capital flows. The amount of ODA based on UN data reaching $133 billion in 2011 (UN, 2012 P.V).
The government plays a considerable role in the planning and implementing of projects in developing countries, evidently, a large proportion of official development assistance is channeled through the public sector. The final effects of official development assistance on economic growth of the country will depend on how it influences fiscal policy (Machado, 2009).
Net official development assistance to developing countries has averaged between3.7 and 6.7 percent of GDP during 1980–2009, amounting to around 20–40 percent of average tax revenues. The relatively high share of aid in government budgets in some countries has raised concerns about the detrimental effects of aid dependency on domestic revenue effort, spending programs and budget planning as well as institution-building (Gupta, Clements &Tareq, 2008).
Political economy considerations provide additional support to the argument that official development assistance may discourage taxation by recipient governments (Benedek, Crivelli, Gupta, & Muthoora, 2012). A key argument of the aid dependency literature, for example, is that official development assistance lowers tax revenue, because it undermines the development of domestic institutions that support tax administration and good governance (Knack, 2000;Heller and Gupta, 2002; Brautigam and Knack, 2004; and Mosley, Hudson &Horrell2008).
The present paper develops a fiscal response model based on the recent work in the fiscal response literature and provides solution that can be estimated using more advance econometric techniques. A model for a sample of 25 countries in Asian and Latin American countries over the period 1991–20101 have been estimated.
The paper is organized as follows. The next Section review the relevant literature, Section III outlines the specification of a fiscal response model and derive its solution to analyze the fiscal effects of official development assistance. Section IV deals with data issues. The main results will be presented in Section V and concluding remarks will be given in Section VI.
2- Review of literature
The fiscal response literature pioneered by Heller (1975).Fiscal behavior means deciding between various sources or revenue and level of expenditure. Specifically, it looks at how government behaves vis-à-vis of official development assistance (ODA). Critics argue that ODA have resulted in increased public or private consumption rather than in increased investment, and have contributed less to growth than was anticipated.
A data plot suggests a negative association between total net ODA and total tax revenues (Figure1). Between 1980 and 1995, when official development assistance as a share of GDP was increasing, average tax revenue in relation to GDP decreased slightly. Post-1995, a decline in the share of total net ODA to GDP was accompanied by higher tax revenues as percentage of GDP.
Figure1: Average Net ODA and Tax Revenue in Low- and Middle- Income Countries, 1980- 2009
Source: Benedek, Crivelli, Gupta, & Muthoora, (2012).
Evidence of a negative relationship between net official development assistance and tax revenue has been borne out in the data in several studies. Ghura (1998), using data for a sample of 39 sub-Sahran African countries for the period 1985–96, finds that aid has a statistically significant negative effect on the ratio of taxes to GDP.
association with government revenues. They also concluded that the effect depends on the composition of aid: while grants have a negative effect on revenues, loans have no significant or positive effect. They argued that their results may reflect the fact that loans have to be repaid eventually, while grants represent real transfers from abroad. Moreover, they found that although the effect of grants is modest on average, it is higher in countries with weak institutions.
Remmer (2004) uses a broader sample of 120 developing countries over the period 1970–99. She finds a negative relationship between three different measures of net official development assistance and changes in tax revenue to GDP. As noted above, Gupta et al. (2004) find similar results. Moreover, they show that the negative effect of ODA grants is stronger in countries with weak institutions.
Knack (2009) also finds a robust negative relationship between sovereign rents(from aid and natural resources) and taxation. A number of recent contributions have however argued that the results are sensitive to the composition and scope of the estimation sample.
Clist and Morrissey (2011), extending the time period of the Gupta et al. (2004) database, and re-estimating the relationship between net official development assistance and taxation from the mid-1980s to 2005 find a positive association between net official development assistance and taxation. They argue that this reflects a break in pattern of allocation of net official development assistance since the mid-1980s, when net official development assistance became conditional on implementation of good policies or concomitant structural reforms. This argument is central to Carter’s (2011) critique of existing studies on net official development assistance and taxation. He argues that the econometric evidence to date is inconclusive because of failures to adequately address the endogenous nature of net official development assistance.
for government revenue? Does it mainly finance government consumption or public investment? Does it crowds-out public borrowing?
3- A Fiscal Response Model
Fiscal response studies assume that public sector decision-makers are faced with the task of allocating resources among different alternative subject to budgetary constraints. These decision-makers in the public sector behave as a single individual with a well-behaved, homothetic preference map with following utility function following Heller (1975):
)
,
,
,
,
(
i i i i ii
F
INEX
CUEX
GREV
ODA
BORR
U
(1)
Where INEX is government investment expenditure, CUEX is government current expenditure, GREV is government revenue, ODA is net official development assistance and BORR is net public borrowing from other sources.
The standard approach in the fiscal response literature is to define the public sector utility function as a quadratic loss function and minimize it as follows (Ouattara, 2006):
2 * 4 2 * 3 2 * 2 2 * 1 0 ) ( 2 ) ( 2 ) ( 2 ) ( 2 i i i i i i i i i BORR BORR a GREV GREV a CUEX CUEX a INEX INEX a a U (2)
The starred variables represent exogenous target and represent the weight attached to each component of the utility function. All other variables in equation (2), represent actual variables, and treated as endogenous.
these targets subject to budgetary constraint1. The utility function is specified in a way that if the decision-makers try to derive from the targets it will result in a loss of utility2.
Following ouattara (2006), the decision-maker is assumed to maximize utility function (2) subject to the following budget constraint:
i i
i i
i
CUEX
GREV
ODA
BORR
INEX
(3)
The above budget constraint assumes that expenditure must equal total government's receipts. The lagrangian function is applied to maximization problem, as follows:
] [ 2 ) * ( 2 4 2 ) * ( 2 3 2 ) * ( 2 2 2 ) * ( 2 1 0 BORR ODA GREV COEX INEX BORR BORR GREV GREV CUEX CUEX INEX INEX L (4)
Where
is the Lagrange multiplier? Taking the derivative of L with respect to the choice variables and
, and solving the first-order condition through leads to the following semi-reduced form equations:]
[
* * *2 *
1
INEX
ODA
BORR
GREV
CUEX
INEX
(5)]
[ * * *
4 *
3CUEX ODA BORR GREV INEX
CUEX
(6)]
[ * * *
6 *
5GREV ODA BORR IENX COEX
GREV
(7)]
[ * * *
8 *
7BORR ODA GREV INEX CUEX
BORR
(8)
1- Recent papers such as Franco-Rodriguez et al. (1998), McGillivray (2000) have endogenised aid on the basis that it is a government choice variable. However, given that the target for aid is generally set
as aid commitments this implies that the impact of aid obtained in the reduced form equations will be that of the commitment values and not the disbursement values. This will tend to over-estimate the impact of aid, as the amounts committed are generally higher than those disbursed.
Where the
j( j= 1, 2,…., 8), are combinations of
i(i=1,…4)1One problem faced with most fiscal response studies has been to obtain the target variables. It is assumed that the target for public capital expenditure can be peroxide by the following:
i i
C
i
GDP
DESE
ODA
INEX
i 2 3
1 0
*
(9)
Where GDPc is GDP per capita, DESE is debt service and ODA is net
official development assistance. GDP measures the country's level of economic development. Public capital expenditure will also depend on the debt burden of the country measured here by debt servicing. Target for government consumption expenditure is also defined by a similar economic relationship:
i i
i c
i GDP DESE ODA
CUEX 0 1 3
*
(10)The target for government revenue is approximated by:
i i
i c
i
GDP
EXPR
IMPR
GREV
*
0
1
2
3 (11)GDPC is defined as above, EXPR and IMPR denotes exports and imports
respectively. The inclusion of EXPR and IMPR is based on the fact that many developing countries get revenue from exports and imports. Finally, the target for borrowing is specified by the following relationship:
i i
c
i
GDP
ODA
BORR
*
0
1
2 (12)Borrowing will depend on GDPc and ODA. Substituting Esq. (9)-(12)
into Esq. (5)-(8) gives the following full reduced form equations:
it e i it IMPR it EXPR it ODA it DESE cit GDP it
INEX 0 1 2 3 4 5 1 1
(13) it e i it IMPR it EXPR it ODA it DESE t i c GDP it
CUEX 01 2 3 4 5 2 2
(14) t i e i it IMPR it EXPR it ODA it DESE cit GDP it
GREV 01 2 3 4 5 3 3
(15) t i e i it IMPR it EXPR it ODA it DESE cit GDP it
BORR 0 1 2 3 4 5 4 4
(16)
’s,
’s,
’s and
’s can be traced back to the
i’s representing the weigh attached to each element of utility function (2).In this regard panel data techniques provide us with more powerful tools to test these relationships among economic variables.In this paper, the above equations will be estimated using panel data econometrics technique. Given that equations derived from the solution of the model. For this purpose each of Eqs. (13)- (16) can be represented by the following general reduced-form regression:
it it
it
X
e
Y
(17)Where the
Y
itis dependent variable andX
it denotes a set of explanatory variable for country i in time t.These two types of estimators are designed to handle the systematic tendency of eit to be higher for some individuals than for others (individual
effects) and possibly higher for some time periods than for others (time effects). The fixed effect estimator does this by (in effect) using a separate intercept for each individual or time period. The random effect estimator is based on the following decomposition of eit where ε is the individual effect,
µ the time effect, and η the purely random effect. β is estimated by the structure imposed upon eit by this assumption. Both fixed and random effects
individual effect as part of the error term, it suffers from the possibility of bias due to a correlation between it and the repressors.
Hausman (1978) provides a test for discriminating between the fixed effects and the random effects estimators. The test is based on comparing the difference between the two estimators of the coefficient vectors, where the random effects estimator is efficient and consistent under the null hypothesis and inconsistent under the alternative hypothesis. The fixed effects estimator is consistent under both the null and the alternative hypothesis. If the null is true then the difference between the estimators should be close to zero. The calculation of test statistics requires the computation of the covariance matrix of β1- β2. In the limit the covariance matrix simplifies to Var(β1) –
Var(β2), where β1 is the fixed effects estimator and β2 is the random effects
4- Sources of Data
The data used here come from two main sources and cover the period 1991-2010. Countries in Southland West Asia are: Iran, Turkey, Pakistan, Jordan, Oman, Syria, India, and Yemen. In South and East Asia are: Indonesia, Malaysia, Thailand, Philippine, Bangladesh, Nepal, Vietnam. In Latin America are: Argentina, Brazil, Bolivia, Venezuela, Colombia, Peru, Chile, Paraguay, Uruguay1. Data on government investment expenditure is obtained from the World Bank Global Development Network Growth Database. Data on government current expenditure, government revenue, foreign aid, debt service, exports and imports of goods and services (all expressed as a percentage of GDP), GDPC is GDP (market price) per capita
were obtained from the World Bank World Development Indicator, 2012. Data on borrowing is the net public borrowing, obtained as a residual from Eq. (3) in the model.
5- Empirical Results
Tables 1-4, summarize the results related to the estimation of Eqs.(13)-(16). Each equation applied for the same period (1991-2010). The sizes of the samples are 25 countries in Asian and Latin American countries. According to F-Lemer test, H0 hypothesis (Pooling approach) rejected and
all equations estimated with panel data approach. According to Husman test
in government investment expenditure equation, H0 hypo the sis accepted
and this equation estimated based on random effects estimator. In other equations, H0 hypothesis rejected and these equations estimated based on
fixed effects estimator.
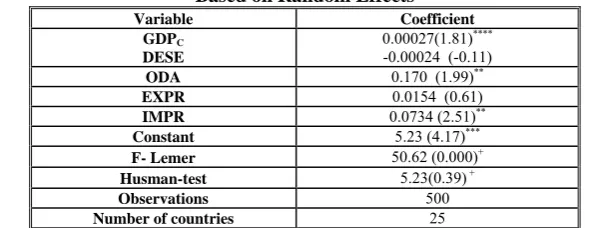
The impact of net official development assistance on the government investment expenditure is assessed in Table 1.
Table1: Estimated Results for Government Investment Expenditure Equation, Based on Random Effects
Variable Coefficient GDPC
DESE
0.00027(1.81)****
-0.00024 (-0.11)
ODA 0.170 (1.99)**
EXPR 0.0154 (0.61)
IMPR 0.0734 (2.51)**
Constant 5.23 (4.17)***
F- Lemer 50.62 (0.000)+
Husman-test 5.23(0.39)+
Observations 500
Number of countries 25
Robust z-statistics in parentheses. ** significant at 5%; *** significant at 1%& **** significant at 10%.+Indicate P-value for F and Husman test, respectively.
Source: Authors
The results in Table 1 show that net official development assistance bears a positive and statistically significant sign in government investment expenditure. Which is consistent with findings of Heller (1975), Khan and Hoshino ( 1992), Franco- Rodriguez et al. (1998), Ouattara (2006), Machado (2010). The impact of foreign aid on the government current expenditure is assessed in Table 2.
Table 2: Estimated Results for Government Current Expenditure Equation, Based on Fixed Effects
Variable Coefficient GDPC
DESE
-0.0001(-0.82) 0.011 (0.30)
ODA 0.047 (0.80)
EXPR -0.041 (-2.43) **
IMPR 0.069 (3.41)***
Constant 10.99 (20.45)***
F- Lemer 57.25 (0.000)+
Husman-test 18.25(0.003)+
Observations 500
Number of countries 25
Robust t-statistics in parentheses. ** significant at 5%; *** significant at 1%.+Indicate
The results in Table 2 show that net official development assistance has insignificant effect on government current expenditures, then contrary to the finding of Boone (1996) and others, we find no evidence that aid flows are used to finance government consumption expenditure. The impact of foreign aid on the government revenue is examined in Table 3.
Table 3: Estimated Results for Government Revenue Equation, Based on Fixed Effects
Variable Coefficient
GDPC -0.0002 (-1.75)****
DESE -0.063 (-1.20)
ODA -0.185 (-2.25)**
EXPR 0.019 (0.80)
IMPR 0.20 (0.71)
Constant 19.23 (25.56)***
F- Lemer 57.25 (0.000)+
Husman-test 17.82(0.003)+
Observations 500
Number of countries 25
Robust t-statistics in parentheses. ** significant at 5%; *** significant at 1%&**** significant at 10%.+Indicate P-value for F and Husman test, respectively.
Source: Authors
The coefficient of net official development assistance on revenue is negative and statistically significant at the conventional level, thus suggesting that developing countries public sector authority reduce their revenue collection efforts when net official development assistance is made available to them. This finding corroborates finding by Heller (1975), Franco-Rodriguez et al. (1998), Mc- Gillivray, Ouattara (2005).Finally and Benedek et al (2012). Table 4 which summarize results related to the net public borrowing in equation (16).
Table 4: Estimated Results for Public Borrowing Equation, Based on Fixed Effects
Variable Coefficient
GDPC 0.0004 (2.88)***
DESE 0.065 (1.18)
ODA -0.56 (-6.61)***
EXPR -0.043 (-1.74)****
IMPR 0.13 (4.51)***
Constant -3.58 (-4.52)***
F- Lemer 30.94 (0.000)+
Husman-test 20.11(0.001)+
Observations 500
Number of countries 25
Robust t-statistics in parentheses. ** significant at 5%; *** significant at 1%. +Indicate P-value for F and Husman test, respectively.
The results shows that net official development assistance have a negative and statistically significant effect on public sector borrowing. Overall this results support the view that government in developing countries are likely to reduce other forms of borrowing1.
6- Concluding Remarks
This paper has investigated the relation between net official development assistance and public sector fiscal behavior using a panel data in Asian and Latin American countries over the period 1991-2010.
The results indicate that net official development assistance has a positive and significant effect on investment expenditure, which in turn might crowds in private investment. The evidence also shows that ODAloans are not used to increase current expenditure. Results also show that net official development assistance crowds out government revenue, then public sector authorities in developing countries reduce their efforts to collect revenue when ODA is available to them. Finally, net official development assistance does induce a reduction in public sector borrowing.
This paper has also some research implications. First, as argued by McGillivray and Morrissey (2001) ODA effectiveness studies need to first consider the question of government behavior vis-à-vis of ODA loans before studying their broad macroeconomic impacts. The relationship between ODA and growth might not be a straightforward one, as many aid growth studies seem to assume. Therefore, understanding how these ODA loans affect fiscal aggregates might shed new light on the aid debate. Second, it might also be worth analyzing whether the fiscal behavior of the recipient government depends on the nature or the type of ODA loans.
This implication of our findings is that developing country should attract more foreign capital by liberalizing their financed markets.
References
1-Bakhtiari, S., Tayebi, S.K., &Izadkhasti, H. Impact of Official Development Assistance on Government Fiscal Behavior in The Selected
Asian Developing Countries, Quarterly Journal of The Economic Research, 12 (2), 2012.
2-Benedek, D., Crivelli, E., Gupta, S., and Muthoora, P. Foreign Aid and Revenue: Still a Crowding Out Effect?,IMF Working Paper, WP/12/186, 2012.
3-Binh, T.N., McGillivray, M. Foreign aid tax and public investment: a comment. Journal of Development Economics, 41, 1993, 173– 176.
4-Brautigam, D., and Knack, S. Foreign Aid, Institutions, and Governance in Sub-Saharan Africa, Economic Development and Cultural Change, 52(2), 2004, pp. 255–85.
5-Clist .P., & Morrissey, O. Aid and Tax Revenue, Journal of International Development, 23 (2), 2011, 165-180.
6-Franco-Rodriguez, S. Recent advances in fiscal response models with an application to Costa Rica. Journal of International Development, 12, 2000, 429– 442.
7-Franco-Rodriguez, S., Mcgillivray, &M., Morrissey, O. Aid and the public sector in Pakistan: evidence with endogenous aid. World Development, 26, 1998, 1241–1250.
8-Gang, I., Khan, H. Foreign aid, taxes and public investment. Journal of Development Economics, 34, 1991, 355– 369.
9-Gang, I., Khan, H. Foreign aid and fiscal behaviour in a bounded rationality model: different policy regimes. Empirical Economics, 24, 1999, 121–134.
10- Gupta, S., Clements, B., Pivovarsky, A., and Tiongson, E. R. Foreign Aid and Revenue Response: Does the Composition of Aid Matter?, Chapter 14 in S. Gupta, B. Clements,and G. Inchauste (ed.), Helping Countries Develop: The Role of Fiscal Policy(Washington: International Monetary Fund); 2004.
11- Gupta, S., Clements, B.and Tareq, S. Mobilizing Revenue, Finance and Development, Vol. 45, Issue 3 (Washington: International Monetary Fund); 2008.
12- Gupta, K.L. Public fiscal behaviour and foreign aid: some model solutions. Economic Modelling, 14, 1997, 203– 214.
13- Heller, P. A model of public fiscal behavior in developingcountries: aid, investment and taxation. American Economic Review, 65, 1975, 429– 445. 14- Heller, P., and Gupta, S. More Aid—Making it Work for the Poor, WorldEconomics, 3, No. 4, 2002.
16- Knack, S. Aid Dependence and the Quality of Governance: A Cross-countryEmpirical Analysis, Policy Research Working Paper Series 2396 (Washington: TheWorld Bank), 2000.
17- ___,. Sovereign Rents and the Quality of Tax Policy and Administration, Journal of Comparative Economics, Elsevier, 37(3), 2009, pp. 359–71.
18- Machado.R. Aid and Fiscal Policy in Nicaragua; A Fiscal Response.Journal of International Development, 22, 2010, 483-502.
19- Mavrotas, G. Foreign aid and fiscal response: does aid disaggregation matter? Weltwirtschaftliches Archive, 138, 2002, 534–559.
20- McGillivray, M. Aid and public sector behaviour in developing countries.Review of Development Economics, 4, 2000, 156–163.
21- Mc Gillivray, M. Aid, Economic Reform and Public Sector Fiscal Behavior in Developing Countries, Review of Development Economic, 13(3), 2009, 526-542.
22- McGillivray, M., Morrissey O. A Review of Evidence on the Fiscal Effects of Aid.Credit Research Papers. University of Nottingham; 2001. 23- McGillivray, M., & Ouattara, B. Aid debt burden and government fiscal behavior in Cote d’Ivoˆ ire. Journal of African Economies, 14, 2005, 247– 269.
24- Mosley, P., Hudson, J. & Horrell, S. Aid, the public sector and the market in less developed countries.Economic Journal, 97, 1987, 616– 641.OECD,. DAC Online Statistics (OECD, Paris); 2003.
25- Moss, T., Pettersson, G. and Walle, N. An Aid-institutions Paradox? A ReviewEssay on Aid Dependency and State Building in Sub-Saharan Africa, In W. Easterly(Ed), Reinventing Foreign Aid, Cambridge, MA: The MIT Press; 2008.
26- Otim, S. Foreign aid and government fiscal behaviour in low-income South Asian countries. Applied Economics, No. 28, 1996, 927-933.
27- Ouattara, B. Froeign Aid and Government Fiscal Behavior in Developing Countries: Panel Data Evidence, Economic Modeling, No. 23, 2006, 506-514.
28- Remmer, K. Does Foreign Aid Promote the Expansion of Government?, American Journal of Political Science, 48(1), 2004, 77–92.
29- UN. Department of Economic and Social Affairs, World Economic and Social Survey 2012: United Nation Publication; 2012.