in the population sciences published by the Max Planck Institute for Demographic Research Konrad-Zuse Str. 1, D-18057 Rostock · GERMANY www.demographic-research.org
DEMOGRAPHIC RESEARCH
VOLUME 23, ARTICLE 20, PAGES 549-586
PUBLISHED 10 SEPTEMBER 2010
http://www.demographic-research.org/Volumes/Vol23/20/ DOI: 10.4054/DemRes.2010.23.20
Research Article
Circular migration patterns and
determinants in Nairobi slum settlements
Donatien Beguy
Philippe Bocquier
Eliya Msiyaphazi Zulu
©2010 Donatien Beguy, Philippe Bocquier & Eliya Msiyaphazi Zulu.
This open-access work is published under the terms of the Creative Commons Attribution NonCommercial License 2.0 Germany, which permits use, reproduction & distribution in any medium for non-commercial purposes, provided the original author(s) and source are given credit.
1 Introduction 550
2 Migration in the urban African context: research questions 551
3 Data and Methods 554
3.1 Data collection 554
3.2 Measures 555
3.3 Limitations 557
3.4 Descriptive analysis 557
3.5 Regression analysis 559
4 Descriptive results 560
4.1 Characteristics of the population 560
4.2 Age and sex pattern 562
4.3 Evidence of calendar effects 565
5 Factors related to movements in and out of the slum areas 569
6 Discussion 575
7 Conclusion 578
8 Acknowledgements 579
Circular migration patterns and determinants
in Nairobi slum settlements
Donatien Beguy1
Philippe Bocquier2
Eliya Msiyaphazi Zulu3
Abstract
This paper measures migration flows and determinants in two slum settlements in Nairobi City between 2003 and 2007. The results confirm the high intensity of migration with a quarter of the total slum population and a third of those aged 15-30 being renewed annually. A circular migration system is at play whereby the majority of slum dwellers are short-term migrants spending on average less than 3 years in the area. Migration is more intense during early adulthood (20-24), and despite very similar determinants across gender, mobility is more intense among women compared to men. The increasing feminization of migration is likely to change the face of slum settlements, resulting in more balanced sex ratios, in line with city-wide trends in Nairobi over the past half century. The high population turnover is due to the insecurity of livelihoods, tenure, and poor basic amenities and social services in slum settlements.
1 African Population and Health Research Center (APHRC), Shelter Afrique Center – 2nd Floor, Longonot
Road, P.O. Box 10787 – 00100, Nairobi, Kenya.
2 Department of Demography and Population Studies, School of Social Sciences, Central Block, Main
Campus, University of the Witwatersrand, Private Bag 3, WITS 2050, Johannesburg, South Africa.
1. Introduction
During the past three decades, significant evidence has been derived concerning migrant characteristics, migration patterns, and the major causes (as well as consequences) that push or pull individuals from rural areas into cities in sub-Saharan Africa (Adepoju 1990, 1995; Oucho 1998; Oucho and Gould 1993; Potts 1995, 2000; Todaro 1969). While past research has given significant insight into migration processes among migrants living in urban areas as a whole, the specific case of migrants living in the rapidly growing urban slum settlements is poorly documented. Estimates by UN-Habitat (2003) show that in sub-Saharan Africa, about 72% of urban residents live in slums or slum-like conditions. Slum settlements are characterized by make-shift housing, congestion, high levels of unemployment, social fragmentation, high levels of migration, and poor environmental sanitation, health, security, and other social services. Despite the limited economic opportunities in most urban centres in general, and in slum settlements in particular, many migrants continue to flock there in search of jobs and other livelihood opportunities.
Although there has been growing concern among policy makers and development partners to address the appalling living conditions in the slum settlements, little is known about the general patterns of migration and what factors attract or push people out of the slum settlements. This paper takes advantage of rich longitudinal data collected under the Nairobi Urban Health and Demographic Surveillance System (NUHDSS) between 2003 and 2007 among residents of Korogocho and Viwandani slum settlements in Nairobi city in order to assess the patterns and determinants of both in and out-migration. Thus, unlike many studies that rely on proxy indicators of slum-like characteristics to estimate people living in slum settlements, our study is unique because we used data collected from actual dwellers of two slum settlements in the city. Longitudinal data are well suited for understanding demographic trends and their drivers, particularly in teasing out causal relationships between migration and other demographic parameters such as fertility and mortality (Collinson et al. 2009b; Kubaje et al. 2009; Nhacolo et al. 2009). Understanding migration patterns and dynamics of slum dwellers is also vital in determining how social and health policies should be adapted to the needs of a highly mobile population.
per year between 1969 and 1999. About 80% of Nairobi residents aged 25-59 are migrants and half of them came to Nairobi between 17 and 23 years of age (Bocquier et al. 2009). Between 60-70% of Nairobi residents live in slums or slum-like conditions, without proper access to sanitation or affordable clean water (African Population and Health Research Center 2002; UN-HABITAT 2008).
Korogocho and Viwandani are located about 5-10 km from the city centre and 3 km from each other. These two settlements are home to nearly 23,000 households. The total population in the two slums grew from about 53,000 in mid-2003 to about 57,500 in mid-2007. Data from a cross-sectional migration history survey carried out in 2006 show that with a median duration of stay of 16 years for the current population, Korogocho has a more settled population. On the other hand, Viwandani, which is located adjacent to Nairobi’s industrial area, attracts a youthful and highly mobile population seeking job opportunities in the nearby industries. The median duration of stay in Viwandani is 7 years (Muindi et al. 2009). In general, the proportion of economically active individuals (aged 15-64 years old) is higher in Viwandani than in Korogocho. For example in 2008, 72% and 62% of the people in Viwandani and Korogocho, respectively, were aged 15-64. Conversely, Korogocho has a larger proportion of 0-4 year olds than Viwandani (37% vs. 28% in 2008). This translates into a higher dependency ratio in Korogocho than in Viwandani (62% vs. 39%). Most residents in the two slums rely on unstable and low-paying sources of income (Zulu et al. 2006).
This paper is a contribution to the internal migration literature and in particular to the understanding of circular migration in the poorest informal urban settlements. Our study differs in an important way from similar ones conducted in the past on migration dynamics using longitudinal data in that it applies Event History Analysis (EHA) technique to both in- and out-migration. Previous studies used the actuarial method that may be sufficient at the descriptive level but is inappropriate to analyse the determinants of migration. To the best of our knowledge, this is the first attempt to use EHA framework to analyze Health and Demographic Surveillance System (HDSS) migration data.
2. Migration in the urban African context: research questions
(excluding China) in the 1980s. Although sub-Saharan Africa’s urban growth is higher than the world average (Bocquier 2005), the fact that the region experienced a decline of urban growth in the 1990s and 2000s (Bocquier 2003; Bocquier and Traoré 2000; Potts 1995), suggests that migration has contributed even less to urban growth in the recent past in Africa (Potts 2006). This is a normal phenomenon when considering the history of the urban transition process: the contribution of migration dominates at the inception of the transition, while natural growth, boosted by a young age structure as in most cities, and reclassification (when a locality crosses the urban population threshold and is no longer classified as rural), dominate at later stages of the transition. Given that the ongoing fertility transition in Africa has mostly been instigated and propelled by fertility decline in urban areas, which also happen to have higher HIV/AIDS and related mortality than in rural areas, we can expect a decline in natural growth of African cities and consequently a decline of the overall African urban growth.
The mobility transition theory (Zelinsky 1971) predicts that as countries progress from a low to a high level of urbanisation, rural to urban migration should give way to circulation. Circular migration systems have been confirmed in many African cities such as Harare, Zimbabwe (Potts 2000); Abidjan, Côte d’Ivoire (Beauchemin 2002); and Nairobi, Kenya (Bocquier et al. 2009). Similarly, circulation has also been confirmed in rural areas (Clark et al. 2007; Collinson et al. 2009a). Thus, the decline in urban growth does not seem to translate to a decline in migration intensity in both directions, to and from the city.
Migration theories have addressed the determinants of migration, with emphasis on migration decisions at the micro-level and employment being central since it is believed that migrants primarily moved from their rural places in search of jobs in urban areas. The well known theory by Todaro (Harris and Todaro 1970; Todaro 1969) was the first to hypothesize that potential migrants decide to move to urban settings if the financial costs of their migration is less than the positive difference between their expected earnings in their places of origin and in their destination. Bilsborrow (1998) has emphasized the important role that noneconomic factors such as individual and household characteristics as well as circumstances at the origin and destination also play in explaining rural-urban migration.
Democratic Republic of Congo (former Zaire) since access to education usually requires one to move to the school area, which is often far from the place of residence. Also, subsequent graduation from school leads many young people to move to other areas where job opportunities corresponding to their skills are available. Brockerhoff and Eu (1993) highlighted the influence of family events on rural-urban migration in most countries in sub-Saharan Africa where married women with at least two recent births were less likely to move to an urban area. Recent evidence from Ghana demonstrate the same link between family life and migration where being married or having more than two living children deters migration from rural to urban areas (Reed, Andrzejewski and White 2010).
In rural areas in Africa, poor living conditions in conjunction with critical natural hazards like drought, flood, and famine tend to push many people to move in search of better livelihood opportunities in urban areas (Adepoju 1990; Oucho 1998). Accordingly, rural households maximize their chances for survival by sending some of their members to urban places to look for other sources of income that their home places are unable to provide (Andersson 2001). In addition, urban areas also offer better health care and educational facilities that attract poor rural inhabitants. Migration, therefore, represents a mechanism for diversifying economic risks and opportunities as well as to tap into better health, education, and other social services at individual and household or family levels.
3. Data and Methods
3.1 Data collection
This paper draws on longitudinal data collected under the NUHDSS that APHRC has been implementing since August 2002 in Korogocho and Viwandani slum settlements in Nairobi City. Fieldworkers visit all households in the two slum settlements once every four months to collect information on key demographic events (births, deaths, and migrations), health and various socioeconomic data. In this paper, we analyze migration data covering the first five years of the NUHDSS, from January 1, 2003 to December 31, 2007.
The procedures related to the NUHDSS organization can impact the quality of data collected. These include data collection periodicity, time threshold for internal and external migration, and changes in questionnaire design. For instance, from August 2002 to December 2006, the NUHDSS used the threshold period of 90 days to determine migration status. That is, one had to live in the demographic surveillance area (DSA) for at least 90 days to be designated as an in-migrant, while a resident in the system was designated as an out-migrant if he or she lived away from the DSA for at least 90 days. In May 2003, the visitation cycle was changed from 90 days to 120 days while the threshold period for migration remained 90 days. The threshold period was changed from 90 days to 120 days from January 2007 in order to make fieldwork easier by having the same period for the visitation cycle and the threshold period.
Movement within the DSA is considered as change of residence or internal migration. In principle, a resident who ‘exited’ from a location in the DSA area is expected to ‘enter’ in another location in the same or another DSA. However, sometimes some people who are reported to have made an internal movement are not found in any other location in the DSA several rounds later. These cases are called ‘hanging cases’ and can introduce biases in the calculation of demographic and health indicators if they are not controlled for in the analysis and ultimately resolved.
3.2 Measures
Out-migration and in-migration are both dependent variables examined in this analysis. Although the threshold period for in and out-migration was 90 days and was later changed to 120 days in the NUHDSS, we use a six-month threshold in this analysis. By choosing a higher (six-month) threshold, the analytical definition does not depend on the operational definition and its variation, and the six-month threshold complies with the definition commonly used in migration analysis. To note, the operational definition of residence excludes from analysis the short-term visitors since they will be classified as in-migrants only after residing in the DSA more than 90 days or 120 days. At the opposite, a resident who is travelling for less than 90 or 120 days out of the slums will still be considered a resident during that period of temporary absence.
The independent variables used in our regression models include calendar quarter, slum area, gender, educational attainment, marital status, period of notice of demolition, a set of household characteristics (toilet, piped water, electricity, ownership of the structure, type of floor material, type of roof material, possession of radio, television and phone), and ethnic group.
inclined to migrate “permanently” while those from areas close to Nairobi but with occasional or seasonal climatic hazards (like the Kambas, some 100-200 km from Nairobi) may be inclined to migrate for shorter periods of time and keep closer ties with their original homes. Merus and Embus originate in the region around Mount Kenya and fairly close (100-250 km) to Nairobi, while the Luhyas, Luos and Kisii originate in the Western Province far (350-500 km) from Nairobi.
Slum area comprised two categories: Korogocho and Viwandani (see description in section 2). In each slum area, the period of notice of demolition characterizes the date when the Kenya Power Lighting Company (KPLC) and other public companies (Kenya Railway, Kenya Pipeline) gave a three month ultimatum to residents living under high voltage electricity lines or near the railway and pipelines to move out of their houses or face forced eviction and demolition of the houses. This period goes from January 4th, 2004 to March 2nd, 2004, and is set as a time-varying indicator. The variable is included in the analysis because the order resulted in mass migration of people who lived in the designated problem areas, and also attracted many in-migrants later when many of the demolished houses were rebuilt when it turned out that the order was not strictly enforced. Socioeconomic status is measured at household-level to reflect ownership of the dwelling unit and presence of key amenities: whether the individual lives in a structure with access to toilets (either flush or traditional pit) or not, whether the structure possesses piped water or not, whether the dwelling unit is connected to electricity or not, and whether the household owns the dwelling unit or not.
3.3 Limitations
Most of the explanatory variables used in our analysis are time-invariant, thus limiting the causal explanation. Some variables such as marital status, socioeconomic status (including education) could have more explanatory power when they vary over the follow-up period. Employment histories were not collected in a systematic way over the data collection period and could not be used in the analysis. The relationships between migration and employment have thus not been fully explored. We tried as much as possible to supplement our analysis with information gathered from other studies nested within the NUHDSS or other studies done in Nairobi. Furthermore, we have not examined reasons for migration in our analysis to determine the push and pull factors of migration, since reasons for migration were only collected for those who migrated to the study area after the start of the NUHDSS while those enumerated in the initial census were not asked why they came to the study area.
Standard errors are corrected for unobserved heterogeneity (also known as ‘shared frailty’), i.e., our regression analysis controls for random effects measured on fieldworkers. This is because each fieldworker is assigned a specific set of neighbouring structures and households that may have unknown common characteristics, such as the ones depicted in the preceding paragraph. The NUHDSS is structured in such a way that the same individual can be interviewed successively by different fieldworkers. We assume that observations for individuals interviewed by the same fieldworker are correlated and thus non-independent. By controlling for intra-fieldworker correlation, we also control for intra-individual and inter-individual differences in quality of the data collected by fieldworkers in the field. Statistical tests show that this correlation cannot be ignored and that standard errors would be underestimated (and statistical significance overestimated); if we do not control for unobserved heterogeneity at the fieldworker level.
3.4 Descriptive analysis
(Kintner 2004). These descriptive techniques used in HDSS analysis and were typically adopted so far to analyse NUHDSS data (Zulu et al. 2006).
The main difference between the life table (actuarial) method and the EHA is not so much in the method of computation as in the use of time-intervals. Because the life table method aggregates separately the numerator and the denominator to compute rates or probabilities, the practical choice of unit time is usually the year in demographic analyses, though in principle any other unit time may be used. In EHA, e.g., to produce Kaplan-Meier estimates, exact dates of events can readily be used for computation, without loss of information. The time at risk can be computed from the date of event and the date of censoring, as recorded from the field. In other words, the precision in the analysis will not be less than what data collection offers.
How does the life table method of analysing migration translate into EHA? Out-migration is straightforward since it can be analysed as any other demographic event, i.e., with decrement tables. The individual, who experienced out-migration is removed from the population at risk, or in the case of a renewable event, may again be included in the population at risk through return migration, until censoring by last observation or death. However, in-migration is more difficult to deal with because in-migrants are increasing the population at risk instead of decreasing it as with out-migration, death, marriage, etc. The population at risk is the population that receives the in-migrants (host population) and not the population from where the in-migrants originate (sending population). In other words, the in-migrant is added to the population at risk of receiving migrants.
Noticing that in-migration is just the opposite process of out-migration, our method consists of running the time of analysis in reverse in order to produce tables that will formally have the same structure and properties as decrement tables but which will be interpreted as increment tables. Beyond descriptive analysis, this method allows us to conduct multivariate analysis on the determinants of in-migration in much the same way as out-migration is analysed.
the age for starting the time in reverse, depending on the size of the population at risk at older ages and the scope of the analysis.
In this paper, we chose age 70 as our starting (reverse) time for in-migration analysis, as the population becomes small after this age (0.6% of the total person-years). To note, death and last observation time (last census round in HDSS) are censoring events for out-migration analysis, whereas birth and first observation time (first census round in HDSS) are censoring events for in-migration analysis using reverse time.
Besides computing migration rates by age, we also compute annual in- and out-migration rates during the period 2003-2007, to capture possible calendar effects (either seasonal or not). Monthly rates are calculated during the 60-month period from January 1st, 2003 to December 31st, 2007, and then annualised for ease of comparison with age-specific migration rates.
3.5 Regression analysis
For regression analysis, semi-parametric proportional hazards (Cox) model was used since it does not require specification of the form of the distribution of baseline hazard rate (Allison 1991; Courgeau and Lelièvre 1989; Cox and Oakes 1984; Trussel, Hankinson, and Tilton 1992). For out-migration analysis, the model takes the form:
β x x(t)(t|x(t)) λ0(t).exp(t)
λ =
) (t
x
β λ0(t)
where is a vector of independent, possibly time-varying covariates as described above in the measures section, and the associated vector of coefficients, while is the baseline hazard rate at x(t)=0.
The analysis time t is the age of individuals, starting at 15 years old with a maximum value of 70 years old. Therefore, the baseline hazard rates are given by age and form the non-parametric part of the model. Their distribution reflects the empirical distribution as described in the descriptive results section of this paper and for that reason is not commented further in the regression section. The same model is applied to in-migration analysis except that t is replaced by its inverse
) (
0 t λ
t
d=− , starting from t=70 years old. In other words, the regression analysis is limited to in- and out-migrations between 15 and 70 years old.
time for each individual is July 1, 2003 and the latest is June 30, 2007. This four year period covers a total of 73,738 individuals aged at least 15 years old (as of July 1, 2003) in the DSA, of which 41,497 out-migrated and 40,349 in-migrated. Note, since migration is a renewable event, individuals can in- and out-migrate several times and therefore can be both in- and out-migrants over the observation period. Gaps are thus considered in the analysis since individuals can move in and out continuously.
Three models were run, for males and females separately and for both sexes (which is referred to as the ‘general model’ in section 5). We interpret the findings from the general model and only comment on the gender-specific models when the results of the latter are different from those of the general model. When the hazard ratio is greater than one, it means a higher risk of occurrence of the event in the corresponding covariate (compared to the reference covariate). Conversely, the risk of occurrence of the event is lower when the coefficient is less than one.
4. Descriptive results
4.1 Characteristics of the population
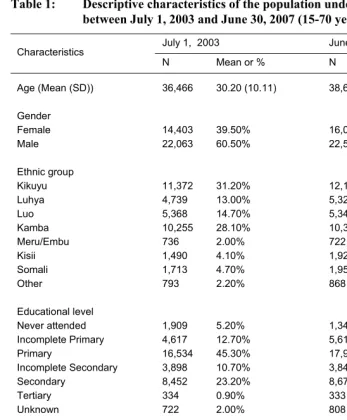
Table 1: Descriptive characteristics of the population under observation between July 1, 2003 and June 30, 2007 (15-70 years old)
July 1, 2003 June 30, 2007
Characteristics
N Mean or % N Mean or %
Age (Mean (SD)) 36,466 30.20 (10.11) 38,601 30.56 (10.47)
Gender
Female 14,403 39.50% 16,020 41.50%
Male 22,063 60.50% 22,581 58.50%
Ethnic group
Kikuyu 11,372 31.20% 12,110 31.40%
Luhya 4,739 13.00% 5,325 13.80%
Luo 5,368 14.70% 5,344 13.80%
Kamba 10,255 28.10% 10,348 26.80%
Meru/Embu 736 2.00% 722 1.90%
Kisii 1,490 4.10% 1,926 5.00%
Somali 1,713 4.70% 1,958 5.10%
Other 793 2.20% 868 2.20%
Educational level
Never attended 1,909 5.20% 1,347 3.50%
Incomplete Primary 4,617 12.70% 5,619 14.60%
Primary 16,534 45.30% 17,981 46.60%
Incomplete Secondary 3,898 10.70% 3,843 10.00%
Secondary 8,452 23.20% 8,670 22.50%
Tertiary 334 0.90% 333 0.90%
Unknown 722 2.00% 808 2.10%
Married/In union 21,694 59.50% 19,341 53.04%
Household characteristics
HHDs own toilet 1,179 3.20% 1,408 3.60%
Piped water in HHD 2,119 5.80% 2,009 5.20%
Electricity in HHD 6,059 16.60% 8,412 21.80%
House owner 4,193 11.50% 4,321 11.20%
Floor finished 28,168 77.20% 30,428 78.80%
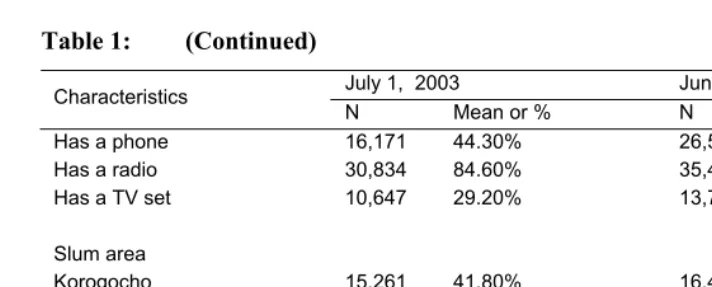
Table 1: (Continued)
July 1, 2003 June 30, 2007
Characteristics
N Mean or % N Mean or %
Has a phone 16,171 44.30% 26,533 68.70%
Has a radio 30,834 84.60% 35,416 91.70%
Has a TV set 10,647 29.20% 13,773 35.70%
Slum area
Korogocho 15,261 41.80% 16,422 42.50%
Viwandani 21,205 58.20% 22,179 57.50%
Total (individuals) 36,466 100.00% 38,601 100.00%
Although data on employment are not available for the whole observation period, a specific survey conducted in 2004 showed that in Korogocho, among men aged 18 years and above, only 11% were in salaried employment, 10% in established trading, 34% in casual employment, 29% in petty trading, and 15% were without any income generating activity. Among women, 50% were without any income generation; 32% in petty trading, 8% in casual employment, , 6% in established trading, and 4% in salaried employment. In Viwandani, among men aged 18 years and above, 20% were in salaried employment in 2004, 7% in established trading, 42% in casual employment, 14% in petty trading and 12% without any income generating activity. Among women, 50% were without any income generating activity; 19% in petty trading, 18% in casual employment, 7% in established trading, and 3% in salaried employment.
4.2 Age and sex pattern
and the out-migration rate 12.2% in 2003-2006 (Bocquier, Collinson, and Tollman 2010). While the average population of the DSA varies between 53,000 and 57,500 individuals during the period 2003-2007, the high intensity of migration is demonstrated by the fact that between 69,400 and 76,200 different people live at least three months in the DSA every year during the same period. The annual out-migration rates are 22% for Korogocho and 31% for Viwandani, translating into between 5,270 and 5,710 migrations every year in Korogocho; and between 9,030 and 9,750 out-migrations in Viwandani. The annual in-migration rates are respectively 21% and 32% in the two slums, i.e., between 5,140 and 5,580 in-migrations every year in Korogocho; and between 9,360 and 10,105 in Viwandani.
During the study period, in- and out-migration rates follow a classic pattern (Rogers and Castro 1981), whereby they decrease between age 0 and age 14, then increase until age 24 before decreasing again till age 65 as observed in most HDSS (Collinson et al. 2009a). Children aged less than 2 are less likely to in-migrate than to out-migrate. The opposite holds between 3- 14 years old where people are slightly more likely to move out of the DSA than to move in. Indeed, the in-migration rates were 23% for the 5 year olds and 17% for the 10 year olds whereas the out-migration rates were 26% and 19% for the same age groups. The major differences between the two rates occur between ages 15- 25 years. At these ages, the in-migration rates are much higher than the out-migration rates. The in-migration rate exceeded 50% between 19-21 years old, while out-migration was at its highest (more than 35%) between 21- 26 years old. From age 25 to 70, it appears that people are more likely to out-migrate than to in-migrate into the DSA by 2-5 percentage points.
Figure 1: Annualised in- and out-migration rates by age and slum residence (Korogocho and Viwandani, 2003-2007)
0% 10% 20% 30% 40% 50% 60% 70% 80%
0 5 10 15 20 25 30 35 40 45 50 55 60 65
Korogocho
In‐migration
Out‐migration
0 5 10 15 20 25 30 35 40 45 50 55 60 65
Viwandani
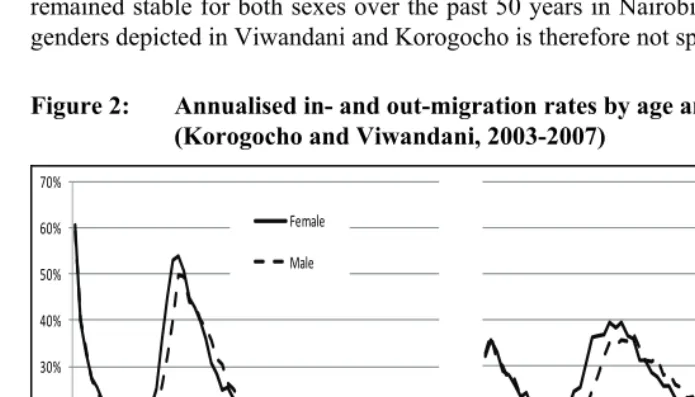
Figure 2 shows gender differences in out- and in-migration rates for the whole DSA. The in-migration rate in the whole DSA was 29% for females and 26% for males. This translates into 6,490 to 7,250 annual in-migrations for women; and 7,890 to 8,320 for men. In the same way, 28% of females and 26% of males were out-migrants during the period 2003-2007. The total number of annual out-migrations during this period varied from 6,250 to 6,990 for females and from 7,940 to 8,340 for males.
In general, data show that there is no gender difference before age 12, for both in-migration and out-in-migration, but slight differences are observed thereafter. For example, when looking at in-migration, females are more likely to move into the DSA than males between ages 12- 20, while it is the opposite after age 25. Turning to out-migration, females show higher rates of moving out than males between 12- 24 while males are more likely to out-migrate from age 25. In other words, at adult ages females are migrating younger than males. After age 60, males are clearly more likely to out-migrate than their female counterparts, reflecting gender difference in retirement age effect on migration. A similar pattern is observed for both in-migration and out-migration when considering Korogocho and Viwandani separately.
difference in migration pattern for Nairobi as a whole. The median age at first migration into Nairobi did not change much: around 20 years old from the 1960s to the 1990s and was only one year less for females as compared to males (Bocquier et al. 2009), and this pattern is confirmed by the 1986 Urban Labour Force Survey (Mazumdar and Mazaheri 2002). Although censuses show that the sex ratio in Nairobi is linearly declining from 1.47 in 1969 to 1.15 in 1999 (Bocquier et al. 2009), the average age at migration remained stable for both sexes over the past 50 years in Nairobi. The similarity across genders depicted in Viwandani and Korogocho is therefore not specific to these slums.
Figure 2: Annualised in- and out-migration rates by age and gender (Korogocho and Viwandani, 2003-2007)
0% 10% 20% 30% 40% 50% 60% 70%
0 5 10 15 20 25 30 35 40 45 50 55 60 65
In‐migration Female
Male
0 5 10 15 20 25 30 35 40 45 50 55 60 65
Out‐migration
4.3 Evidence of calendar effects
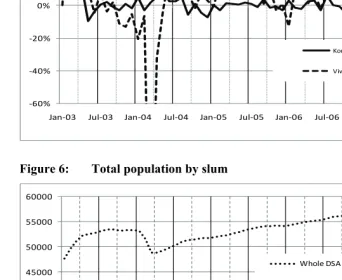
tendency among Kenyans to take vacation and go back to their places of origin during this period and return to Nairobi a few months later. The peak of out-migration at the beginning of the year may be linked to the end of the high season in the tourist industry with the termination of short-term contracts. The highest peak observed at the beginning of the year 2004 in Viwandani is due to the demolition of structures that led many slum residents to leave the area. During February and March, 7,860 people left the DSA; the vast majority (6,820) were from Viwandani. The rate reached 19.64% in February 2004 (i.e., 236% in annual term) in Viwandani, but the scale was kept the same in both graphs for the sake of comparison.
The trend observed before July 2003 is likely to reflect data collection issues when the NUHDSS was still stabilizing its procedures, while the trend after July 2007 is likely to reflect the ‘hanging cases’ as mentioned in the methodology section. However, we cannot exclude that the higher out-migration and lower in-migration in the last quarter of 2007 are linked to the December 2007 general elections. Many residents of Nairobi, who travelled for holidays and incidentally to vote in their constituencies of origin, may have ended up staying longer as a consequence of the violence that erupted after the elections, while potential in-migrants may have delayed their migration for the same reasons. These pre-July 2003 and post-June 2007 periods are not considered in the multivariate analysis to avoid potential biases.
Figure 3: Annualised in- and out-migration rates, by month (Korogocho)
0% 10% 20% 30% 40% 50% 60% 70% 80%
Jan‐03 Jul‐03 Jan‐04 Jul‐04 Jan‐05 Jul‐05 Jan‐06 Jul‐06 Jan‐07 Jul‐07
In‐migration rates
Figure 4: Annualised in- and out-migration rates, by month (Viwandani)
0% 10% 20% 30% 40% 50% 60% 70% 80%
Jan‐03 Jul‐03 Jan‐04 Jul‐04 Jan‐05 Jul‐05 Jan‐06 Jul‐06 Jan‐07 Jul‐07
In‐migration rates
Out‐migration rates
Figure 5: Annualised net migration rates by slum
‐60%
‐40%
‐20%
0% 20% 40% 60%
Jan‐03 Jul‐03 Jan‐04 Jul‐04 Jan‐05 Jul‐05 Jan‐06 Jul‐06 Jan‐07 Jul‐07
Korogocho
Viwandani
Figure 6: Total population by slum
20000 25000 30000 35000 40000 45000 50000 55000 60000
Jan‐03 Jul‐03 Jan‐04 Jul‐04 Jan‐05 Jul‐05 Jan‐06 Jul‐06 Jan‐07 Jul‐07 Whole DSA
Korogocho
5. Factors related to movements in and out of the slum areas
Table 2 displays results from a general model for both sexes (in-migration vs. out-migration). It should be noted that the model controls for age, which is the analysis time t, in the non-parametric component of the model. The hazard rates by age follow the same pattern depicted in the section 4.1.
The chances to in- and out-migrate are lower in Korogocho than in Viwandani, corroborating the findings at the descriptive level. In-migration and out-migration are respectively 8% and 23% lower in Korogocho than Viwandani, indicating that the former retains more of its population than the latter.
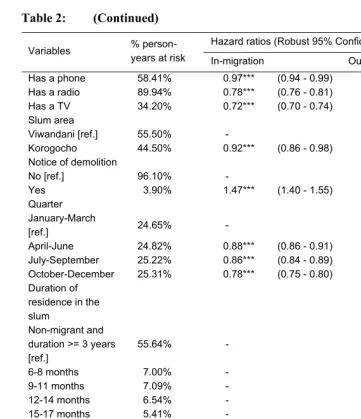
Individuals are more likely to out-migrate or in-migrate during the 1st quarter of the year (January-March) than during other quarters. There is a negative relationship between quarter and in-migration, whereas the chances to out-migrate are at their lowest in the third quarter (July-September). The notice of demolition has a more significant positive effect on out-migration than on in-migration. It is expected that the chance of leaving the DSA increases during the period when the notice of demolition was given to the inhabitants since many houses were actually demolished and many of the residents had to leave the study area. However, the demolition period is also followed by an increase in in-migration because many of the houses were rebuilt after residents discovered that there was no serious enforcement of the demolition order.
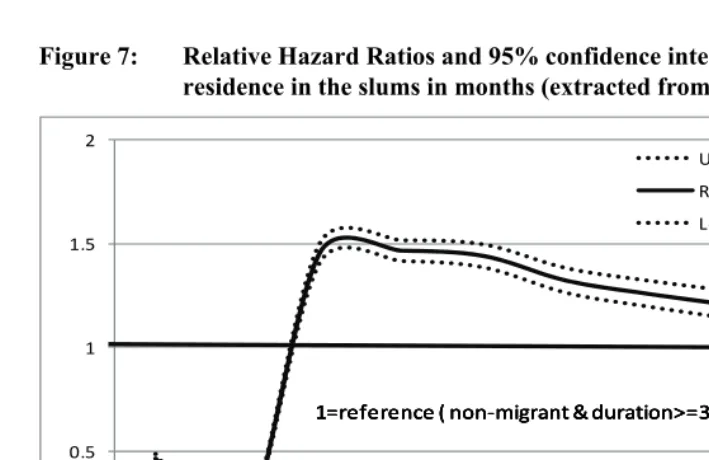
Figure 7: Relative Hazard Ratios and 95% confidence interval by duration of residence in the slums in months (extracted from Table 2)
0 0.5 1 1.5 2
6‐8 9‐11 12‐14 15‐17 18‐20 21‐23 24‐26 27‐29 30‐32 33‐35 Upper band
Relative Hazard Ratio
Lower band
1=reference ( non‐migrant & duration>=3 years) 1=reference ( non‐migrant & duration>=3 years) 1=reference ( non‐migrant & duration>=3 years) 1=reference ( non‐migrant & duration>=3 years)
Differences based on ethnicity are observed for both movements, with Kikuyus being significantly less likely to in-migrate or out-migrate than other ethnic groups. It should be noted that Nairobi is situated close to Central Province, a predominantly Kikuyu region: the distance to ‘home’ area is therefore reduced for this ethnic group and day-time moves might actually replace longer-term migration. Furthermore, many Kikuyus living in slum settlements do not have land or another house in their place of origin, and are likely to live there for a long time. Actually, Kikuyus are also more likely to own houses in slums than the other groups. Data on ownership of property collected under the Urbanization, Poverty and Health Dynamics (UPHD) project show that about 64% of slum residents who own houses in Nairobi are Kikuyus. Also, the same ethnic group forms the largest group (40%) among those who do not own houses in their place of origin. However, geographical proximity as approximated by ethnic origin does not seem to be correlated with either in- or out-migration. Here, the local social context probably better explains the mobility differentials by ethnic group.
with incomplete primary or at least complete primary level of education. This implies that in-migrants are selected among the more educated people but those who are not educated, once they have moved in, are more likely to stay longer in the slum areas. Note that those who have completed their education, whether at primary, or at secondary level, have a higher chance to out-migrate and even more so to in-migrate than those who have not. This could be indicative of the value attached to certificates of formal education on Nairobi job market.
Persons in marital unions are significantly less likely to in-migrate into the slum communities. With regard to household characteristics, there is no significant difference by access to sanitation for both in-migration and out-migration. Living in a structure connected to electricity reduces the likelihood of moving out although the statistical significance is marginal (p-value<0.1). However, the probability of in-migration to a structure connected to electricity is increased by 6%. These results indicate that the presence of basic amenities like electricity may reduce the turn-over in the slum areas, thereby retaining the residents. However, we do not find the same effect for water. While for in-migration, there are no significant differences based on having access to piped water in the structure, results indicate a positive effect of piped water on out-migration. Households with piped water are a minority (less than 6%) and that indicator might actually reflect better overall economic income. For such households, out-migration from the slums may signify upward mobility. In addition, individuals living in structures with finished roof or floor are significantly more likely to migrate either in- or out. Possession of a radio or television set decreases the likelihood of moving either in or out of the slum communities. To note, possession of a phone only slightly reduces in-migration, but it is the most important single factor that reduces the chance to out-migrate (58% reduction). Possession of a phone was a stronger indicator of wellbeing during the reference period than it is currently, since the cost of mobile phones has gone down markedly.
Structure ownership has a significant effect on out-migration, with residents being less likely to move out from the slums when the household owns the structure. Most people in slum settlements (7 out of 8) are tenants. The effect of ownership of housing unit on out-migration is mirrored by the reduced chance to in-migrate in a structure owned by the household. Many come to the slums as tenants and can only buy housing units after generating and saving some income over the years or establishing connections to enable them to identify and buy structures.
gender-specific models (results not shown), with minor differences regarding ethnicity and educational attainment. For out-migration, while results for males show the same effect for ethnicity as in the general model, it is not the case for females where no significant difference was observed for the Somali ethnic group. With regard to education, the results for females show the same effect as in the general model, but it is not the case for males where there is no significant difference for individuals with no education and those with incomplete secondary level education. Marital union is negatively associated with out-migration for males whereas the effect is not significant for females as observed in the general model.
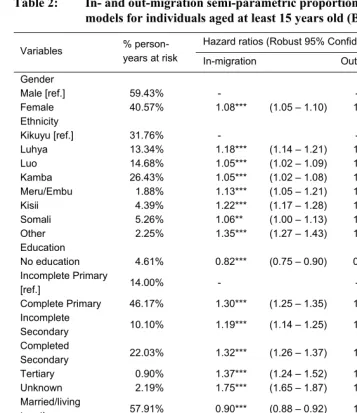
Table 2: In- and out-migration semi-parametric proportional hazard (Cox) models for individuals aged at least 15 years old (Both sexes)
Hazard ratios (Robust 95% Confidence Interval)
Variables %
person-years at risk In-migration Out-migration
Gender
Male [ref.] 59.43% - -
Female 40.57% 1.08*** (1.05 – 1.10) 1.11*** (1.09 – 1.14)
Ethnicity
Kikuyu [ref.] 31.76% - -
Luhya 13.34% 1.18*** (1.14 – 1.21) 1.16*** (1.12 – 1.20)
Luo 14.68% 1.05*** (1.02 – 1.09) 1.16*** (1.12 – 1.20)
Kamba 26.43% 1.05*** (1.02 – 1.08) 1.05*** (1.02 – 1.08)
Meru/Embu 1.88% 1.13*** (1.05 – 1.21) 1.16*** (1.09 – 1.25)
Kisii 4.39% 1.22*** (1.17 – 1.28) 1.17*** (1.12 – 1.23)
Somali 5.26% 1.06** (1.00 – 1.13) 1.13*** (1.07 – 1.20)
Other 2.25% 1.35*** (1.27 – 1.43) 1.32*** (1.24 – 1.40)
Education
No education 4.61% 0.82*** (0.75 – 0.90) 0.93** (0.87 – 1.00)
Incomplete Primary
[ref.] 14.00% - -
Complete Primary 46.17% 1.30*** (1.25 – 1.35) 1.05*** (1.01 – 1.08)
Incomplete
Secondary 10.10% 1.19*** (1.14 – 1.25) 1.02 (0.98 – 1.07)
Completed
Secondary 22.03% 1.32*** (1.26 – 1.37) 1.09*** (1.05 – 1.13)
Tertiary 0.90% 1.37*** (1.24 – 1.52) 1.28*** (1.16 – 1.42)
Unknown 2.19% 1.75*** (1.65 – 1.87) 1.24*** (1.17 – 1.32)
Married/living
together 57.91% 0.90*** (0.88 – 0.92) 1.00 (0.98 – 1.02)
Household (HHD) characteristics
HHD owns toilet 3.48% 1.01 (0.95 – 1.07) 1.00 (0.94 – 1.07)
Piped water in
HHD 5.67% 0.99 (0.95 – 1.04) 1.22*** (1.17 – 1.27)
Electricity in HHD 20.09% 1.06*** (1.03 – 1.10) 0.97* (0.94 – 1.00)
House owner 11.85% 0.62*** (0.59 – 0.65) 0.78*** (0.75 – 0.81)
Floor finished 76.78% 1.08*** (1.05 – 1.12) 1.10*** (1.07 – 1.13)
Table 2: (Continued)
Hazard ratios (Robust 95% Confidence Interval)
Variables %
person-years at risk In-migration Out-migration
Has a phone 58.41% 0.97*** (0.94 - 0.99) 0.42*** (0.41 - 0.43)
Has a radio 89.94% 0.78*** (0.76 - 0.81) 0.72*** (0.70 - 0.74)
Has a TV 34.20% 0.72*** (0.70 - 0.74) 0.80*** (0.78 - 0.83)
Slum area
Viwandani [ref.] 55.50% - -
Korogocho 44.50% 0.92*** (0.86 - 0.98) 0.77*** (0.74 - 0.81)
Notice of demolition
No [ref.] 96.10% - -
Yes 3.90% 1.47*** (1.40 - 1.55) 2.67*** (2.58 - 2.77)
Quarter January-March
[ref.] 24.65% - -
April-June 24.82% 0.88*** (0.86 - 0.91) 0.83*** (0.80 - 0.86)
July-September 25.22% 0.86*** (0.84 - 0.89) 0.76*** (0.74 - 0.79)
October-December 25.31% 0.78*** (0.75 - 0.80) 0.88*** (0.85 - 0.91)
Duration of residence in the slum
Non-migrant and duration >= 3 years [ref.]
55.64% - -
6-8 months 7.00% - 0.46*** (0.44 - 0.49)
9-11 months 7.09% - 0.03*** (0.03 - 0.04)
12-14 months 6.54% - 1.46*** (1.41 - 1.50)
15-17 months 5.41% - 1.47*** (1.42 - 1.52)
18-20 months 4.49% - 1.44*** (1.39 - 1.50)
21-23 months 3.77% - 1.32*** (1.26 - 1.38)
24-26 months 3.15% - 1.26*** (1.20 - 1.32)
27-29 months 2.70% - 1.20*** (1.14 - 1.27)
30-32 months 2.29% - 1.14*** (1.07 - 1.22)
33-35 months 1.92% - 1.04 (0.97 - 1.12)
Wald Chi-square - 3603.02*** 22531.64***
Subjects (Events) - 73738 (40349) 73738 (41497)
Time at risk 146609.92 - -
6. Discussion
Descriptive results presented in this paper confirm that migration intensity is particularly high at ages 20-24, when residents are more likely to move in and out of the two slums. This is consistent with the traditional evidence about the high mobility of young adults in sub-Saharan Africa (Oucho and Gould 1993). Between 15-24 years old, people are more likely to move into the slums than to move out. The opposite holds between 25-70 years of age. The in-migration window is very narrow and concentrated around age 20. Also, a quarter of slum dwellers move from the study areas every year to another part of the city or out of the city. Other analysis of NUHDSS data shows that the main destinations of out-migrants include rural areas (44%), other slum (32%) and non-slum (19%) parts of Nairobi.
Our results also show evidence of calendar effects whereby movements in and out of the DSA are intense at some specific times of the year. Relatively high probabilities of in-migration are observed at the beginning of the year (around February), while high chances of out-migration are observed around the end of the year (around December). This pattern is in line with the labour market tradition whereby most industries close down during the end-of-year festive season, and the tendency of Kenyans to move to go to their places of origin for end-of-the-year festivities. At this occasion, many will stop paying their rent in the slums. Some people, especially those who did not have stable livelihood sources, opt to stay in their rural homes for good or for several months before returning to Nairobi to look for other livelihood opportunities. Others will come back to Nairobi in January or February, but not necessarily to the same slum since the room they left in December may have been rented to somebody else. This renting pattern contributes to the high circulation in the slums. Also, the effect of the notice of demolition is clearly corroborated, with the highest out-migration rate being observed at the beginning of the year 2004 when residents were ordered to vacate houses constructed under high voltage electricity lines, or close to the railway line.
17- 23 years old (Bocquier et al. 2009). Relatively few of them form families in Nairobi Province, which has the lowest total fertility rate (2.7 in 2000-2003) of all Provinces in Kenya (4.9 for the whole country in 2000-2003) (Central Bureau of Statistics (CBS) [Kenya], Ministry of Health (MOH) [Kenya] and ORC Marco 2004). Our data also show a unique phenomenon whereby children born or raised in their first years in Nairobi are sent outside the slums for their education. One result of this persistent migration pattern is that the age pyramid is very squeezed around the 10-14 age-group. According to census data, the proportion of the school-age group (5-19) was only 26% in 1999 census (compared to 40% for Kenya as a whole), a situation that has not evolved much since 1969 (29% in Nairobi compared to 39% in Kenya).
Although the data on reasons for out-migration are incomplete, and since we mostly interview proxy respondents after out-migration and we did not have time-varying measures of employment status in our analysis, we expect out-migrants to be predominantly those who fail to get jobs or other sources of livelihoods. A recent qualitative study aimed at determining the extent of satisfaction with the decision to migrate to Nairobi and live in the slums shows that frustration for slum dwellers mostly revolves around inability to find stable sources of income, which would enable them to afford houses with better amenities or save enough money to escape the poor environmental conditions in which they live (Mudege and Zulu 2010).
Contrary to expectations, our data show a higher intensity of female migration compared to males. Females are more likely to move in and out of the DSA, suggesting a higher circulation of women. Parallel to this high circulation is an increasing positive net migration in favour of women, leading to a major shift in the gender composition of the slums. Males are still the majority in the slums but females are contributing more to the slum growth than males (the sex ratio declined from 1.53 to 1.41 males for 1 female in just 4 years of observation). The net migration rate over the period was +0.34% a year, but it was negative for males (-0.19%) and positive for females (+1.04%). These rates mean that in the long-term, the slums will have a more balanced sex ratio, paralleling the trend observed in the city as a whole: the Nairobi sex ratio shifted from 3.5 males to 1 female in 1948, 1.47 to 1 in 1969, 1.38 to 1 in 1979, 1.31 to 1 in 1989, to 1.15 to 1 in 1999 (Bocquier et al. 2009).
factors such as child bearing and rearing, and union formation. Women have greater opportunities to leave slum settlements for non-slum parts of Nairobi due to marriage or employment as live-in house maids, and many also return to rural areas to get married after working in Nairobi for a few months or years. Previous evidence based on NUHDSS data showed that overall, 58% of men and 22% of women came to the slum areas under study in search of better livelihood opportunities, including employment. Livelihood prospect was the main reason that pushed 70% of men and 22% of women who came directly from their rural homes to move to the slum areas (Zulu et al. 2006). Similarly, most people moving out of the slum areas do so mostly because of the cost of living, the high rent, and job and business prospects as well.
Although men are considerably more likely to migrate to Nairobi for economic reasons than women, given that many women stay behind and follow their husbands after they have managed to get some source of income in Nairobi, an increasing number of women are coming to Nairobi independently and to satisfy their own economic needs (Batten, Baschieri, and Zulu 2009). Actually, qualitative data indicate that while many women set forth ‘joining family’ as the main motivation for coming to Nairobi, it is often economic strains that push them to come and join their husbands (Mudege and Zulu 2010). For instance, many women come to join their husbands so that they can both generate some income to support their families. Some divorced or widowed women leave their rural homes to come to Nairobi because the city gives them autonomy from their husbands’ relatives to focus on their own economic advancement. The increasing feminization of migration has been noted in other parts of Africa as well. For instance, in a South African rural setting, Collinson and colleagues reported significant and growing female migration rates (Collinson et al. 2006). In the case of Nairobi, women may come to town for short stays between planting seasons to look for additional revenues for the household.
A major result of our analysis is that the factors that are conducive to in-migration are the same (with some exceptions) that are conducive to out-migration in the slums. How can the same factors be both attractive and repulsive? This is explained by the relatively stable composition of slum-dwellers and characteristics of slum-dwellings, despite high mobility. If the living conditions and socioeconomic status of the slum dwellers have not evolved much over the years, it is not surprising that in-migrants are replacing out-migrants with more or less the same socioeconomic status, living in the same living conditions. The high mobility of recent migrants is confirmed by the higher chance to out-migrate between 1-3 years of residence in the slums. The long-term residents stay in the slums through a selection process and change their needs and objectives compared to recent migrants. In particular, migrants may be attracted by cheap rent associated with low access to amenities, but may leave the slums when they cannot afford the rent (e.g., after losing a job) or, on the contrary, when they can afford better amenities elsewhere. But they may also stay in the slums when able to acquire these amenities and even own their structure, thus changing their basic socioeconomic conditions. These downward and upward mobilities do not necessarily mean that people start off distinctly as long stayers or short stayers in the slums. The long-term residents may have had the same characteristics as others at the beginning of their stay in the slums, but because of a selection process, they may have acquired new or different characteristics that made them stay longer than other people who started to live in the slums under the same conditions. This is where the principle limitation of our results lies. Due to data limitations, we could not control for the full range of push and pull factors of migration, in particular time-varying factors related to change in socioeconomic status and employment histories. Given the importance of livelihoods and basic amenities as pull and push factors, future analysis should include time-varying employment and social amenities data.
7. Conclusion
livelihood and tenure of slum dwellers. The population pyramid for the slum settlements is characteristic of very mobile young adult populations: very squeezed around the 10-14 age-group, ballooning in the middle ages, with very few people at older ages. One of the key findings of this study is the higher intensity of female migration compared to male migration , and the increasing contribution of females to the growth of the slum population. This pattern is likely to change the face of slum settlements and make them less male dominated, in line with city-wide trends that have seen the sex ratio decline from 3.5 to 1.3 males to 1 female between 1948 and 1999.
Understanding the extent and patterns of migration is vital for the success of any intervention programs seeking to improve the wellbeing of slum dwellers. For instance, interventions should take into account the extent of population mobility and should depend on whether people are likely to stay in the slums for a long or a short time. If slum settlements were mostly transitory, one would expect those who do well economically to leave the slums. However, our findings show that those who do relatively well, as shown by residence in houses with better amenities or ownership of houses, are less likely to leave. It would be interesting to assess how ongoing efforts to improve the wellbeing of slum dwellers, which are mostly focused on upgrading of basic amenities and social services, would affect the extent of in-migration as well as out-migration, especially if such upgrades would be achieved without substantial improvement in the livelihood base for the population. This may depend on the migration selection process identified in this article. Cost of living (rents in particular) might increase as a result of the upgrading, and the poorest migrants will then seek to relocate to other slums where the rent is cheaper. The poverty would just move places together with the poorest. Therefore, the positive effects of slum upgrading in reducing poverty may only be realized if the upgrading is general and coordinated over the city slums.
8. Acknowledgements
References
Adepoju, A. (1990). State and review of migration in Africa. Paper presented at the UAPS Conference on Role of Migration in African Development: Issues and Policies for the 90's, Dakar, Senegal, February 24-28, 1990.
Adepoju, A. (1995). Emigration dynamics in sub-Saharan Africa. International Migration 33(3-4): 313-390. doi:10.1111/j.1468-2435.1995.tb00032.x.
African Population and Health Research Center. (2002). Population and Health Dynamics in Nairobi's Informal Settlements: Report of the Nairobi Cross-sectional Slums Survey (NCSS) 2000. Nairobi: African Population and Health Research Center.
Allison, P.D. (1991). Event History Analysis: Regression for Longitudinal Event Data (Quantitative Applications In The Social Sciences). Beverly Hills: Sage.
Andersson, J.A. (2001). Mobile Workers, Urban Employment and ‘Rural’ Identities: Rural-Urban Networks of Buhera Migrants, Zimbabwe. In: Bruijn, M.d., Dijk, R.v., and Foeken, D. (eds.). Mobile Africa: Changing Patterns of Movement in Africa and Beyond. Lieden, the Netherlands: Brill: 89-106.
Batten, L., Baschieri, A., and Zulu, E. (2009). Female and male migration patterns into the urban slums of Nairobi, 1996-2006: Evidence of feminisation of migration? Paper presented at the XXVI IUSSP Conference. Marrakech, Morroco, September 27-October 2, 2009.
Beauchemin, C. (2002). Des villes aux villages: l'essor de l'émigration urbaine en Côte d'Ivoire. Annales de Géographie 624: 157-178. doi:10.3406/geo.2002.1663. Bilsborrow, R.E. (ed.). (1998). Migration, urbanization, and development: new
directions and issues. New York: UNFPA-Kluwer Academic Publishers. Bocquier, P. (2003). Analyzing urbanization in Africa. In: Hugo, G. and Champion, A.
(eds.). New forms of urbanization. Aldershot: Ashgate: 133-150.
Bocquier, P., Agwanda, A. O., Khasakhala, A., Nyandega, I., and Owuor, S. (eds.). (2009). Biography of three generations of Nairobi residents - Thirty years of social urban history. Dakar: Codesria.
Bocquier, P., Collinson, M., and Tollman, S. (2010). Ubiquitous burden of disease: HIV/TB and migration contribution to mortality in rural South-Africa. Paper presented at the Wits-Brown-Colorado-APHRC Colloquium. Nairobi, May 19-22, 2010.
Bocquier, P. and Khasakhala, A. (2009). Factors influencing union formation in Nairobi, Kenya. Journal of Biosocial Science 41(04): 433-455.
doi:10.1017/S0021932009003319.
Bocquier, P. and Traoré, S. (eds.). (2000). Urbanisation et dynamique migratoire en Afrique de l'Ouest - la croissance urbaine en panne. Paris: L'Harmattan.
Brockerhoff, M. and Eu, H. (1993). Demographic and Socioeconomic Determinants of Female Rural to Urban Migration in Sub-Saharan Africa International Migration Review 27(3): 557-577. doi:10.2307/2547100.
Central Bureau of Statistics (CBS) [Kenya], Ministry of Health (MOH) [Kenya], and ORC Marco. (2004). Kenya Demographic and Health Survey 2003. Calverton, Maryland: CBS, MOH, and ORC Marco.
Chen, N., Valente, P., and Zlotnik, H. (1998). What do we know about recent trends in urbanization? In: Bilsborrow, R.E. (ed.). Migration, urbanization, and
development: new directions and issues. Norwell, Massachussets:
UNFPA-Kluwer Academic Publishers: 59-88.
Clark, S., Collinson, M., Kahn, K., Drullinger, K., and Tollman, S. (2007). Returning home to die: circular labour migration and mortality in South Africa.
Scandinavian Journal of Public Health 35 (Supplement 69): 35-44.
doi:10.1080/14034950701355619.
Collinson, M. (2009). Striving against adversity: the Dynamics of Migration, Health and Poverty in Rural South Africa. [PhD Thesis]. Umea: Umea University, Departement of Public Health and Clinical Medecine.
Collinson, M., Adazu, K., White, M., and Findley, S.E. (eds.). (2009a). The Dynamics
of Migration, Health and Livelihoods: INDEPTH Network perspectives.
Collinson, M., Gerritsen, A., Clark, S.J., Kahn, K., and Tollman, S. (2009b). Migration and socio-economic change in Rural South Africa, 2002-2007. In: Collinson, M., Kubaje, A., White, M., and Findley, S.E. (eds.). The dynamics of migraion,
health and livelihoods: INDEPTH Network Perspectives. Aldershot: Ashgate:
81-108.
Collinson, M., Lurie, M., Kahn, K., Johnson, A., and Tollman, S. (2006). Health Consequences of migration: Evidence from South Africa’s Rural North-East (Agincourt). In: Tienda, M., Findley, S., Tollman, S., and Preston-Whyte, E. (eds.). Africa on the move. African Migration and Urbanisation in Comparative Perspective. Johannesburg: Wits University Press: 308-328.
Courgeau, D. and Lelièvre, E. (1989). Analyse démographique des biographies. Paris: INED.
Cox, D.R. and Oakes, R. (1984). Analysis of survival data. New York: Chapman and Hall.
Harris, J.R. and Todaro, M.P. (1970). Migration, unemployment, and development. American Economic Review 60: 126-142.
Kintner, H.J. (2004). The Life Table. In: Siegel, J.S. and Swanson, D.A. (eds.). The
Methods and Materials of Demography (2nd ed.). Boston Elsevier Academic:
301-340. doi:10.1016/B978-012641955-9/50047-3.
Kubaje, A., Feiken, D., Ofware, P., Onyango, B., Obor, D., Kiriinya, R., Slutsker, L., Vulule, J., and Laserson, K. (2009). Child migration and mortality in Rural Nyanza province: Evidence from the Kisimu Health and Demographic Surveillance System (KHDSS) in Western Kenya. In: Collinson, M., Kubaje, A., White, M., and Findley, S. (eds.). The dynamics of migraion, health and livelihoods: INDEPTH Network Perspectives. Aldershot: Ashgate: 139-158. Kulu, H. and Milewski, N. (2006). Family change and migration in the life course: An
introduction. Demographic Research 17(19): 567-590. doi:10.4054/DemRes. 2007.17.19.
Lututala, M.B. (1995). Les migrations africaines dans le contexte socio-économique actuel – Une revue critique des modèles explicatifs. In: Gérard, H. and Piché, V. (eds.). La sociologie des populations. Montréal: Les Presses de l'Université de Montréal: 391-416.
Mazumdar, D. and Mazaheri, A. (2002). Wages and employment in Africa. Aldershot: Ashgate.
Mudege, N.N. and Zulu, E.M. (2010). In their own words: Assessment of satisfaction with residential location among migrants in Nairobi slums (Forthcoming). Journal of Urban Health.
Muindi, K., Zulu, E., Beguy, D., Mudege, N., and Batten, L. (2009). Characteristics of recent in-migrants in the Nairobi Urban Health Demographic Surveillance System. Paper presented at the XXVI IUSSP Conference. Marrakech, Morocco, September 27 - October 2, 2009.
Nhacolo, A., Nhalungo, D., Sacoor, C., Matsinhe, L., Aponte, J., and Alonso, P. (2009). Migration and Adult Mortality in Rural Mozambique: Evidence from the Demographic Surveillance System in Manhica District. In: Collinson, M., Kubaje, A., White, M., and Findley, S. (eds.). The dynamics of migraion, health and livelihoods: INDEPTH Network Perspectives. Aldershot: Ashgate: 159-168. Oketch, M., Mutisya, M., Ngware, M., Ezeh, A.C., and Epari, C. (2008). Pupil School
Mobility in Urban Kenya. Working paper. 38. Nairobi: APHRC. (APHRC Working paper).
Oucho, J.O. (1998). Recent internal migration processes in sub-Saharan Africa: Determinants, Consequences and Data Adequacy Issues. In: Bilsborrow, R.E. (ed.). Migration, Urbamization, and Development: New Directions and Issues. Norwell, Massachussets: UNFPA-Kluwer Academic Publishers: 89-120.
Oucho, J.O. and Gould, W.T.S. (1993). Internal migration, urbanization, and population distribution. In: Foote, K.A., Hill, K.H., and Martin, L.G. (eds.). Demographic
change in sub-Saharan Africa. Washington DC: National Academy Press:
256-296.
Potts, D. (1995). Shall we go home? Increasing urban poverty in African cities and migration processes. Geographical Journal 161(3): 245-264.
Potts, D. (2000). Urban Unemployment and Migrants in Africa: Evidence from Harare 1985-1994. Development and Change 31(879-910). doi:10.1111/1467-7660.00181.
Potts, D. (2006). Urban Growth and Urban Economies in Eastern and Southern Africa: trends and prospects. In: Bryceson, D.F. and Potts, D. (eds.). African Urban Economies: Viability, Vitality or Vitiation of Major Cities in East and Southern Africa? Houndmills, Basingstoke: Palgrave Macmillan: 67-104.
Reed, H.E., Andrzejewski, C.S., and White, M.J. (2010). Men's and women's migration in coastal Ghana: An Event History Analysis. Demographic Research 22(25): 771-812. doi:10.4054/DemRes.2010.22.25.
Rogers, A. and Castro, L.J. (1981). Model Migration Schedules. Laxenburg: International Institute for Applied Systems Analysis.
Todaro, M. (1969). A model of labor migration and urban unemployment in less developed countries. American Economic Review 59: 138-148.
Trussel, J., Hankinson, R., and Tilton, J. (1992). Demographic applications of event history analysis. Oxford: Clarendon Press.
UN-HABITAT (2003). Slums of the World: the face of urban poverty in the new Millenium. Nairobi: Global Urban Observatory.
UN-HABITAT (2008). The State of African Cities 2008 - A framework for addressing urban challenges in Africa. Nairobi: UN-HABITAT.
Zelinsky, W. (1971). The hypothesis of the mobility transition. Geographical Review 61(2): 219-249. doi:10.2307/213996.
Zulu, E., Konseiga, A., Muindi, K., Darteh, E., and Mberu, B. (2006). Migration and the Urbanization of Poverty in sub-Saharan Africa: The Case of Nairobi City,
Kenya. Paper presented at the 2006 PAA Annual Meeting. Los Angeles, USA,