Journal of Applied Biotechnology Reports
Original Article
Microarray Data Analysis for Detection and Classification of Viral Infection
Khadijeh Nazari1, Ali Karami*2, Nezameddin Mahdavi Amiri1, Fateme Pourali2
Abstract
Introd
uction
Old methods of studying and analyzing the gene expres-sion such as PCR, RT-PCR, Northern blot, Southern blot and determination of the gene sequence are of the best methods for the analysis of a limited number of genes at a time [1], But microarray technology can assess thousands of genes or proteins simultaneously. The type of microar-ray depends on the materials placed on the slide: If the material is DNA, it is called DNA microarray, if the ma-terial is RNA, it is called RNA microarray, if it is protein, the relevant microarray is called protein microarray and if the material has been derived from a particular tissue, it is called a tissue microarray.
The laboratory procedures of microarray technology in-volve production of microarray, extraction and labeling of samples using fluorescent dyes, hybridization of samples with a microarray and washing of the samples. Finally, the
technology is an ideal tool for this purpose [8, 9]. Many microarrays are designed to identify a range of microor-ganisms present in a sample and their application has been proved in detection of pathogenic viruses [10]. Of other applications of microarray are identification of different bioterrorist threat agents [11] and examining the quality of water and food for the detection of pathogens [12].
However, microarray data analysis in infectious diseases is not easy, because any tested sample of Nucleic Acid usual-ly containing a mixture of DNA and RNA of different or-ganisms, host and variety of contaminants, all this may affect the test results. Furthermore, it is possible that the hybridization process becomes complicated due to the presence of several species, even interdependent, of patho-gens.
Materials and Methods
In this study, two methods of E-predict and DetectiV were
DNA microarrays consist of collection of DNA microscopic spots that In order to form an array attached to a solid surface such as glass, plastic or silicon chip. The pieces of fixed DNA considered as a searcher. In this technology it is possible to test sample against thousands probes for specific genes. With this ability, arrays accele-rate the biological investigations, gene finding, molecular detection and disease di-agnosis. Microarray technology can be seen as a continued development of southern blotting. The most important stage in this technology is data analysis. To analysis such large data whit high degree of confidence and reliability needs reliable bioin-formatics tools.Infectious diseases still is major problem for human. One of the most important application of microarray technology is the possibility of testing for the presence of thousands micro-organism in environmental and clinical samples only in a single excrement. Thereby we take an important step in rapid and accurate detec-tion of infectious diseases. Here, we present E-Predict algorithm and DetectiV pack-age that is based on species identification in microarray. We demonstrate the applica-tion of E-Predict and DetectiV for viral detecapplica-tion in a large publicly available dataset and show that DetectiV performs better than E-Predict. DetectiV is implemented as a package for R - powerful, open source software for statistical programming - that containing visualization, normalization and significance testing functions.
Keywords: Microarray, Microarray Data Analysis, Infectious Diseases
1.Faculty of Mathematics, Sharif University of Technology, Tehran, Iran
2.Research Center of Molecular Biology, Baqiyatallah University of Medical Sciences, Tehran, Iran
* Corresponding Author Ali Karami
Research Center of Molecular Biology, Baqiyatallah University of Medical Sciences, Tehran, Iran
E-mail: [email protected]
K Nazari. et al, Microarray Data Analysis
calculated for each alignment using the nearest neighbor method. For those oligoes that are unsuccessful in the pro-duction of the BLAST output, the hybridization energy is considered to be zero. Thus, a theoretical specific energy profile includes non-zero hybridization energies which are calculated for a subset of oligoes that produce a BLAST alignment compatible with the genome. In general, the energy profiles of all viruses form a matrix of energy. In this matrix, each row is according to a viral species and each column is based on an oligo from a microarray. Then the vector of oligo intensity is normalized and using a si-milarity measurement compared with each profile norma-lized in the energy matrix. The result of this function is a raw vector of similarity scores. Each element in this vector expresses the similarity between observed patterns and a profile predicted for a species present in the energy matrix. In the E-Predict method, the p value and the similarity score determine the answer. Using E predict, some useful results were achieved in a number of conditions. However, E-Predict is not currently a tool for imaging and there is a need for updating and costly calculations before using it for the new arrays. Also E-Predict can be used only in Unix and Linux operating systems.
DetectiV
DetectiV is a package for the R statistical software which includes functions for imaging, normalization and per-forming significance tests of pathogen detection microar-ray data. R is a free statistical software and available in the Windows, Unix, Linux and Mac operating systems [15]. Since the DetectiV is created in the R software, it is easily integrated with many packages available for microarray analysis [16].
The original data set is a matrix of data which its rows represent probes and its columns represent the measure-ments of the microarray. These data is easily created from the structures of data obtained by limma [17]. Limma in-cludes functions for reading output formats of many scan-ners. Affy has functions for reading data of Affy Matrix [18].
We obtain the mean of duplicate probes and at then per-form the normalization procedure using dividing corres-ponding values for each probe on the correscorres-ponding array mean value. Then we do the logarithm at the base 2. Therefore, data becomes normal and their mean is equal to zero (Of course, it is assumed that most probes are not hybridized with something). Then the data are grouped
based on viral species using t -test. Those data are used in later stages that their mean logarithm in the base 2 is greater than or equal to 1. These numbers are ordered based on P value.
In this section, the data obtained from the GEO are imple-mented using the access number of GSE2228 [19]. The array platform for these data is the GEO with the access number of GPL1834 and includes more than 11,000 oligoes representing 1000 viral and bacterial species.
Results and Discussion
Expected and proper results are pre- specified. The results obtained from the data are considered correct if the follow-ing two cases occur:
1) The result of analysis is similar to the pre- specified pathogen.
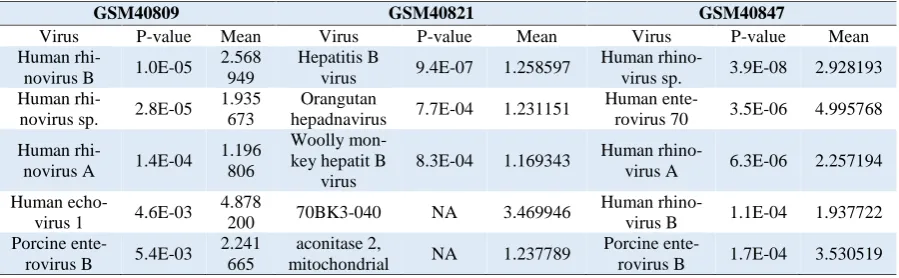
2) If the target pathogen is not present in the array, the obtained result is very similar and related to the virus. In the existing 55 arrays of the total 56 arrays, DetectiV will lead to the correct result. In comparison, E-Predict method gives correct results in 53 arrays of 56 arrays. The results of data analysis of 3 arrays with wrong answers in E-Predict algorithm and correct answers in DetectiV are given in the tables 1 and 2. GSM40809 is hybridized with RNA composing of 26 human rhinoviruses. Here, any oglioes designed specifically for this serotype is not present in the array. However, we expect that rhinovirus sp. human and human rhinovirus B to be at the top table as a serotype of human rhinovirus B. The expected infectious agent in GSM40821 array is the virus of Hepatitis B. Fi-nally, GSM40847 array is hybridized with RNA contain-ing human rhinovirus 87 Virus. In this array, we are also faced with a kind of serotype with which no specific oligo has been designed. Therefore, we can expect that the group human rhinovirus sp. to gain the highest value among all results. We achieve correct result using DetectiV in all three arrays.
K Nazari. et al, Microarray Data Analysis
Table 1. Wrong results of E-Predict
GSM40809 GSM40821 GSM40847
Virus P-value Similarity Virus P-value Similarity Virus P-value Similarity
Human
en-terovirus D 4.3E-05 0.258894
Orangutan
hepadnavirus 2.29E-03 0.148865
Human
ente-rovirus B 1.4E-05 0.386095
Human
en-terovirus B 4.5E-05 0.267815
Hepatit B
virus 2.38E-03 0.147182
Human
ente-rovirus A 1.6E-05 0.378912
Human
en-terovirus C 5.2E-05 0.254504
Woodchuck
hepatit B virus 2.72E-03 0.10964
Human
echovirus 1 2.2E-05 0.414618 Enterovirus
Yanbian 96-83csf
9.4E-05 0.276873
Woolly mon-key hepatit B
virus 2.84E-03 0.128919 Enterovirus Yanbian 96-83csf 2.2E-05 0.412299 Human
echovirus 1 1.34E-04 0.253816
Arctic ground squirrel hepa-tit B virus
3.22E-03 0.103357 Human
ente-rovirus D 2.6E-05 0.296065
Table 2. Result of DetectiV
GSM40809 GSM40821 GSM40847
Virus P-value Mean Virus P-value Mean Virus P-value Mean
Human
rhi-novirus B 1.0E-05
2.568 949
Hepatitis B
virus 9.4E-07 1.258597
Human
rhino-virus sp. 3.9E-08 2.928193 Human
rhi-novirus sp. 2.8E-05
1.935 673
Orangutan
hepadnavirus 7.7E-04 1.231151
Human
ente-rovirus 70 3.5E-06 4.995768 Human
rhi-novirus A 1.4E-04
1.196 806
Woolly mon-key hepatit B
virus
8.3E-04 1.169343 Human
rhino-virus A 6.3E-06 2.257194 Human
echo-virus 1 4.6E-03
4.878
200 70BK3-040 NA 3.469946
Human
rhino-virus B 1.1E-04 1.937722 Porcine
ente-rovirus B 5.4E-03
2.241 665
aconitase 2,
mitochondrial NA 1.237789
Porcine
ente-rovirus B 1.7E-04 3.530519
and biological concepts. In DetectiV method, the mini-mum p value in combination with the largest mean value,
K Nazari. et al, Microarray Data Analysis
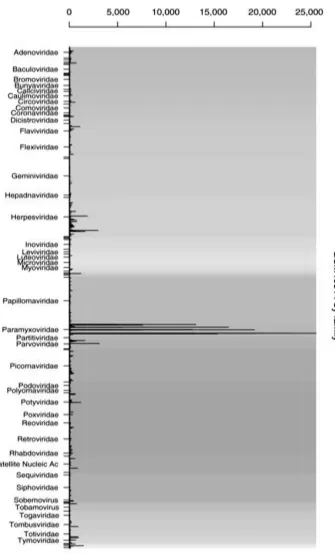
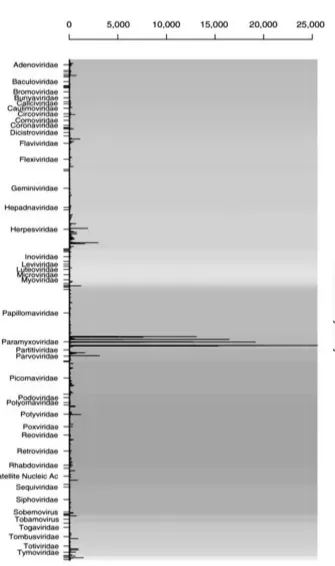
Figure 1. GSM40814 Families; This figure shows an example of barplot prepared by DetectiV, indicating microarray data for the detection of viruses. Oligoes are clustered based on viral family and their mean is obtained according to the replications. Each oligois shownby abar
and each viral family has a background color. Asspecifiedin the figure, the Paramyxoviridae family is introduced as the answer. K Nazari. et al, Microarray Data Analysis
Figure 1. GSM40814 Families; This figure shows an example of barplot prepared by DetectiV, indicating microarray data for the detection of viruses. Oligoes are clustered based on viral family and their mean is obtained according to the replications. Each oligois shownby abar
K Nazari. et al, Microarray Data Analysis
It is worth noting that for the use of DetectiV in other data collection that uses arrays completely different from the first dataset, the only requirement is to change the user of GEO access number and the number of arrays in the data set.
Acknowledgements
We thank our colleges in Molecular Research Center for kind assistant.
References
1. Brown T.A., Gene cloning and DNA analysis: an introduction: Blackwell Pub, 2006.
2. Wentian L. YY., Introduction to microarray analysis. biomed central proceedings, 2007.
3. Boonham, N., Walsh, K., Smith, P., Madagan, K., Graham, I., Barker, I., Detection of potato viruses using microarray technology: towards a generic method for plant viral disease diagnosis. J Virol Meth, 2003, vol.108, pp.181-187.
4. Lapa, S., Mikheev, M., Shchelkunov, S., Mikhailovich, V., Sobolev, A., Blinov, V., et al., Species-level identification of orthopoxviruses with an oligonucleotide microchip. J Clin Microbiol, 2002, vol.40, pp.753-757.
5. Perrin A., Duracher, D., Perret, M., Cleuziat, P., Mandrand, B.A., combined oligonucleotide and protein microarray for the codetection of nucleic acids and antibodies associated with human immunodeficiency virus, hepatitis B virus, and hepatitis C virus infections. Anal Biochem, 2003, vol.322, pp.148-155.
6. Riesenfeld, C.S., Schloss, P.D., Handelsman, J., Metagenomics: genomic analysis of microbial communities. Annu Rev Genet, 2004, vol.38, pp. 525-552.
7. Song, Y., Dai, E., Wang, J., Liu, H., Zhai, J., Chen, C., et al. Genotyping of hepatitis B virus (HBV) by oligonucleotides microarray. Mol Cell probes, 2006, vol.20, pp.121-127.
8. Mezzasoma, L., Bacarese-Hamilton, T., Di Cristina, M., Rossi, R., Bistoni, F., Crisanti, A., Antigen microarrays for
serodiagnosis of infectious diseases. Clin Chem, 2002, vol.48, pp.121.
9. Zourob, M., Elwary, S., Turner, A., Turner, A., Zourob, M., Elwary, S., Principles of bacterial detection: biosensors, recognition receptors, and microsystems, Springer, 2008. 10. Wang, D., Coscoy, L., Zylberberg, M., Avila, P.C., Boushey, H.A., Ganem, D., et al. Microarray-Based Detection and Genotyping of Viral Pathogens. Proc Natl Acad Sci U S A, 2002, vol.99, pp.187-192.
11. Sergeev, N., Distler, M., Courtney, S., Al-Khaldi, S.F., Volokhov, D., Chizhikov, V., et al., Multipathogen oligonucleotide microarray for environmental and biodefense applications. Biosens Bioelectron, 2004, vol.20, pp.684-698. 12. Lemarchand, K., Masson, L., Brousseau, R., Molecular biology and DNA microarray technology for microbial quality monitoring of water. Crit Rev Microbiol, 2004, vol.30, pp.145. 13. Urisman, A., Fischer, K.F., Chiu, C.Y., Kistler, A.L., Beck, S., Wang, D., et al., E-Predict: a computational strategy for species identification based on observed DNA microarray hybridization patterns. Genome Biol, 2005, vol.6, pp.R78. 14. Altschul, S.F., Gish, W., Miller, W., Myers, E.W., Lipman, D.J., Basic local alignment search tool. J Mol Biol, 1990, vol.215, pp.403-410.
15. The R Project for Statistical Computing Available from: http://www.R-project.org.
16. Michael, W., Juliet, D., Abu-Bakr, A.M., Donald, P.K., Paul, B., Detecti, V., visualization, normalization and significance testing for pathogen-detection microarray data. Genome Biol, 2007, vol.8, pp.R190.
17. Smyth, G.K., limma: Linear Models for Microarray Data. In: Gentleman R, Carey V, Huber W, Irizarry R, Dudoit S, editors. Bioinformatics and Computational Biology Solutions Using R and Bioconductor, Statistics for Biology and Health, Springer, New York, 2005, p. 397-420.
18. Gautier, L., Cope, L., Bolstad, B.M., Irizarry, R.A., affy--analysis of Affymetrix GeneChip data at the probe level. Bioinformatics, 2004, vol.20, pp.307.