ISSN 2185-3762
http://sisaljournal.org
Institutional Challenges for a Voluntary-Basis Language Learning Advising Program
Yuuki Ogawa, Soka University, Tokyo, Japan Ryo Hase, Soka University, Tokyo, Japan Corresponding author: [email protected] Publication date: March, 2015.
To cite this article
Ogawa, Y., & Hase, R. (2015). Institutional challenges for a voluntary-basis language learning advising program. Studies in Self-Access Learning
Journal, 6(1), 97-111.
To link to this article
http://sisaljournal.org/archives/mar15/ogawa_hase
This article may be used for research, teaching and private study purposes. Please contact the authors for permission to re-print elsewhere.
Institutional Challenges for a Voluntary-Basis Language
Learning Advising Program
Yuuki Ogawa, Soka University, Tokyo, Japan Ryo Hase, Soka University, Tokyo, Japan
Abstract
This quantitative report was conducted to explore the potential factors which promoted the increased number of students who utilized the English Consultation Room (ECR) which is one of the self-access programs at the World Language Center (WLC), Soka University, Japan. In 2013, 63.5% of students used the English language learning advising service in total whereas the number of
students increased to 70.2% in 2014. While self-access centers (SACs) are widely recognized as an effective means to promoting students’ language learning, especially outside the classroom, just establishing the facilities does not guarantee frequent and active use by students. Increasing the number of users, in fact, may be an institutional challenge for program coordinators (Kodate, 2012). The results of the report may give the self-access program coordinators an insight into the students’ frequent use of the program. In addition, it may provide an example of how usage figures relating to an advising program can be effectively collected and analyzed.
Keywords: advising, self-access center, data analysis
Self-Access Centers
Self-access centers (SACs) are widely recognized to be facilities which promote self-directed or autonomous learning and have gained popularity especially among higher education institutions (Dofs & Hobbs, 2011). A SAC is defined as “a room or areas consisting of a number of resources such as materials, activities and support, usually located in one place and is designed to
accommodate learners of different levels, goals, styles and interests” (Barrs, 2010, p. 11).
to students should be considered (Hughes, Krug, & Vye, 2012). In addition, Croker and Ashurova (2012) noted that using a SAC could be daunting especially for freshmen, first-year Japanese university students. Furthermore, students who are intrinsically motivated and have an advanced level of English proficiency may find an institution’s SAC more appealing while learners that depend more on their teachers in the classroom may hesitate in using SACs (Hughes, Krug, & Vye, 2012). Attempts have been made to help university students use SACs actively at institutions in Japan. For example, colleagues at Soka University attempted to gain support from the teaching staff including part-time teachers. This was done by holding lunchtime information sessions to explain the value and efficacy of the self-access language program, a practice advocated by Shibata (2013). Staff at Tokyo Gakuen University developed a stamp card system with which students, especially freshmen, were required to visit the SAC initially in order to become familiar with the facilities, in the hope that they would start using them later independently (Kodate, 2012). At another institution, Thompson and Atkinson (2010) report on a curriculum which integrates classroom activities with a self-access learning center, resulting in encouraging learners’ independent learning as well as a greater number of SAC users.
The Context
World Language Center and the self-access programs
Center where students practice independent or integrated speaking tasks for TOEFL iBT test. In 2014, the Nihongo Dojyo was established where international students learn Japanese with Japanese university student-staff.
In 2013, all of the self-access programs listed above were relocated together in one place called the SPACe; the Student Performance Acceleration Center.
The English Consultation Room
The English Consultation Room (ECR) is an English language learning advising service and one of the self-access programs in addition to the other six programs. The ECR was founded in 2006 “to guide students in how to utilize the university facilities and resources on campus effectively” (Ishikawa, 2012, p. 96). Students use the ECR on a voluntary basis to seek advice regarding English language learning. One session lasts for 30 minutes. As of 2014, the ECR is open from 12:30 to 16:30 on weekdays and there are nine advisors. They consist of six assistant lecturers teaching English classes and three undergraduate students. Although the content of each consultation varies, most questions related to test preparation are the most frequently asked questions. For example, how to study English for the Test of English International Communication (TOEIC), or how to improve the score of Test of English as a Foreign Language (TOEFL). Given that at Soka University, the students are separated into levels for English classes based on their TOEIC scores, and their TOEFL scores are required to apply for the exchange programs which are available to all of the students except seniors, both of these test scores are intrinsically important to students. In addition to the TOEIC and TOEFL test, there are growing demands from the students who ask about how to study for the International English Language Testing System (IELTS) since they need to take it to apply for a UK visa.
Research questions
What were the trends of ECR use in spring 2013 and spring 2014? What were some potential factors which contributed to an increase in the
number of students?
Data Collection
This section provides an overview of the three instruments that were utilized for data collection related to students who visited the ECR. The
instruments were: (1) ‘regular shifts’ for each semester, (2) the reservation lists for every session, and (3) the session reports for each session. Data were collected in the spring semesters in 2013 and 2014.
Regular shifts
Each semester, the ECR staff work the same shifts every week. For example, Teacher A always works Monday 4th period. The work shifts are called
regular shifts. The regular shifts are used to count the number of available slots in
the corresponding semester.
Reservation lists
The names and student numbers of students using the ECR are listed on
reservation lists. The reservation lists can be utilized to count the number of
reserved slots. The data from reservation lists was acquired from the online ECR reservation system. Students can access the reservation system, check available slots, and make a reservation for one of the available slots. Students can make a reservation for available slots up to two weeks in advance.
If a student makes a reservation, the student number and name will be registered onto the database system. Then, the reserving student information will appear on the reservation list for each day.
Although the reservation lists show the reserving student information, those lists cannot specify the number of students who actually visited the ECR. Some students did not visit the ECR though they made a reservation.
Session reports
Students visiting the ECR write a session report about the session they participated in. There are two reasons for writing the session report: to enable the student to remember the content of the session, and to store information about the session. The session report includes following sections: (1) student name, (2) student number, (3) session date, (4) staff, (5) mid-term and long-term goals, (6) achievement in English learning so far, (7) work to be completed by the next session, (8) summary of the current session. Each student filled out a report of the session that they participated in. When a session finished, staff scanned the report that the student had filled out. Then, the staff sent the report data to an online data storage system that the ECR uses to check the report. These reports are used to determine the number of students who actually visited the ECR in data analysis.
Data Analysis
This section outlines the data analysis procedures for analysing data collected by the three instruments described in the previous section. The data used in the analysis were: the reservation rate, the utilization rate, the cancelation rate, the walk-in student numbers, the student’s year of study, the student’s major, and the number of returning students.
Reservation rate
The reservation rate is the number of reserved slots compared with the available number of slots in a semester expressed as a percentage. The number of students on the reservation list does not necessarily equal the number of ECR attendees due to the existence of walk-in students and cancelations. Hence, there is always a difference between utilization rate and reservation rate.
Utilization rate
The utilization rate is the rate of the number of slots in which students visited the ECR compared with the number of available slots in a semester. This rate indicates the percentage of used slots overall in a semester.
The number of slots students used in a semester is obtained by counting the number of session reports written in a semester. Moreover, the number of available slots in a semester can be acquired by simply counting slots open in the semester. Thus, the utilization rate in a semester can be calculated by using the following equation.
Cancelation rate
Unfortunately, some students did not come to the ECR even though they made a reservation. If a student did not come, the formerly reserved slot would become a vacant slot. This type of slot is called a canceled slot or the purposes of this paper. Although some students canceled their reservations on the reservation system in advance, these slots are not counted as canceled slots in this paper.
If there was no session report for the slot filled in with a student number on a reservation list, it was considered to be a canceled slot. By counting the number of canceled slots, the cancelation rate can be calculated by using the following equation:
Walk-in students
Students who come to the ECR without making reservations are called
walk-in students. If there are some vacant slots in a day, students are able to
By examining the reservation lists and session reports, walk-in students can be identified. If the student number on a session report does not appear in the corresponding slot on the reservation list, the student is a walk-in student.
Years
We classified the year the students were in into five types: 1st, 2nd, 3rd, 4th, and other. The student number can identify the year the Soka University student is in. Student numbers are written on session reports, so the student year classification was obtained from the session reports.
Majors
In terms of majors, the collected data were classified into the eight majors described in the previous section and “Others” including graduate students. The major of a student can also be obtained from the student number as well as the year. Hence, the session reports are used to collect data relating to majors.
Returning students
Some students visited the ECR two or more times in one semester, and these students are called returning students in this paper. The amount of
duplicated student numbers appearing on the session reports indicates returning students.
Results and Discussions
The main findings obtained from the data analysis are presented in this section.
Reservation rate and utilization rate
increased to two in the slots that were in high demand in 2013. Hence, two students were able to use the ECR in some slots in 2014.
In addition, ECR promotion is considered to be another reason for the increase. The ECR attempted the following new developments from 2013 to 2014 in terms of promotion. The ECR was advertised at the guidance meeting for freshmen and the orientation for students wishing to study abroad in April. Coupled with this promotion at orientation, the ECR advisors visited the Basic level English classes (for students who scored lower than 285 on the TOEIC test) to help the student become familiar with the support service available, including ECR.
Table 1. Reservation Rate
Semester # of available slots # of reserved slots Reservation rate [%]
Spring 2013 504 388 77.0
Spring 2014 533 490 91.9
Table 2 shows the utilization rate of the ECR in the spring semester of both years. The utilization rate increased by approximately 7% in 2014. It may be inferred that the utilization rate increased because of the increase of the
reservation rate.
Table 2. Utilization Rate
Semester # of available slots # of utilized slots Utilization rate [%]
Spring 2013 504 320 63.5
Spring 2014 533 374 70.2
some students did not come to the ECR in spite of their reservation. This issue is explained in more detail in the next section.
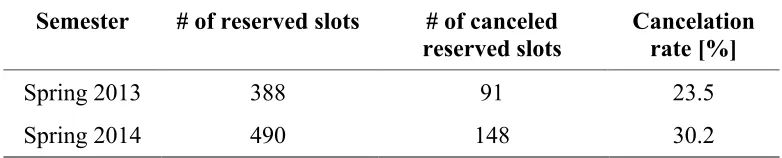
Cancelation rate
Table 3 shows the comparison of the cancelation rates in Spring 2013 and 2014. In 2014, the cancelation rate increased from 23.5% to 30.2%, a difference of 6.7%. Hence, fewer of the reserved slots were not being utilized in 2014.
Table 3. Cancelation Rate
Semester # of reserved slots # of canceled
reserved slots
Cancelation rate [%]
Spring 2013 388 91 23.5
Spring 2014 490 148 30.2
The causes of this increase are difficult to ascertain as the ECR staff cannot have immediate access to students who do not come to their appointments. However, one possible cause that can be inferred from the data may be that due to the limited number of slots, students may have reserved far ahead and then found that they could not attend on the actual day. Actually, in 2014, over 90% of the available slots were occupied by reserving students.
To reduce the cancelation rate, students who cancel the session cannot make reservations for the next two weeks by a ‘penalty’ system of the ECR. The cancelation rate, however, indicates that this system might not work effectively, and other measures to reduce the cancelation should be considered. Hence, measures to reduce the cancellation rate might be also be necessary in addition to the current penalty system, for example adding more long-term penalties or promoting walk-in students.
Walk-in students
the utilized slots in 2014, and this percentage is larger than percentage of that in 2013 which was 7.2%.
Table 4. Walk-in Students
Semester # of slots for
walk-in students Percentage of walk-in in utilized slots [%]
Spring 2013 23 7.2
Spring 2014 32 10.0
The location change of the ECR in 2014 is considered to be one reason for the increase in walk-in students. However, because around 30% of students who made a reservation did not come to the ECR, some slots were available for walk-in students. This situation probably explawalk-ins the walk-increase walk-in walk-walk-in students.
Years
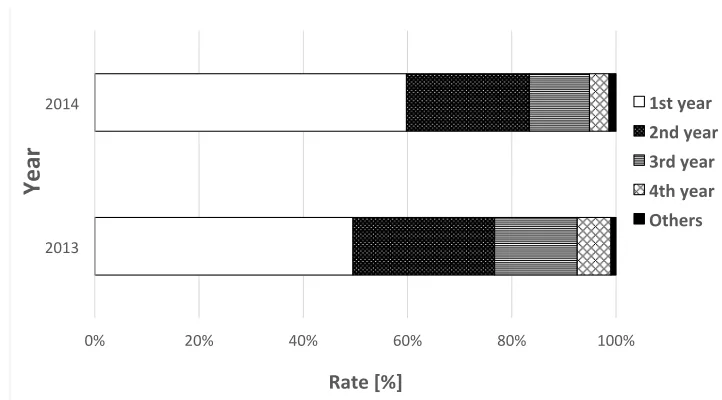
Figure 1. The Percentage of Students in Each Year who Visited the ECR
Figure 1 shows the percentage of students in each year that used the ECR
in 2013 and 2014. The percentage of freshmen (1st year students) and
sophomores (2nd year students) who used the ECR is greater than juniors (3rd
year students) and seniors (4th year students) comparing the two semesters.
Freshmen and sophomores are required to take a heavier load of English classes than juniors and seniors, and any study-abroad programs need to be finished
!"# $!"# %!"# &!"# '!"# (!!"#
$!()# $!(%#
!"#$%&'(
)$
"*
before the junior year. These two factors are considered to be reasons for the large percentage of freshmen and sophomores using the service.
In 2014, the rate of freshmen users increased by 12%. It is assumed that
the increased number of freshmen is due, in part, to the newly initiated ECR
classroom promotion visits.
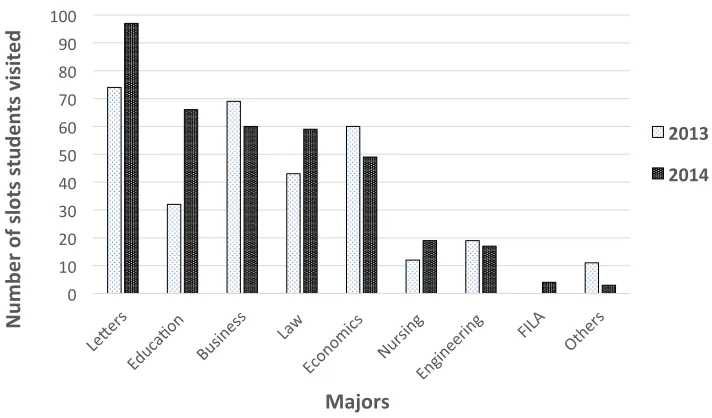
Majors
Figure 2. Number of Students Classified by Major
Figure 2 indicates the number of students classified by major. The faculty
of Letters has the largest percentage of users, whereas Education, Business, Law and Economics have a fairly equal distribution. Nursing and Engineering students had the least recorded visits to the ECR in 2014. Within those majors, Education students showed the largest increase rate. In 2014, an English learning program
for students majoring in Education was started. Hence, the larger usage rate could
be associated with the opening of the program.
Students majoring in Engineering and Nursing are less likely to use the
facilities than the other faculties. Possible reasons for this might be following two
factors. First, the overall number of students majoring in Engineering and Nursing
are fewer than the other faculties. Second, these two faculties have special classes
for English, and the ECR staff did not promote the ECR in those classes.
!" #!" $!" %!" &!" '!" (!" )!" *!" +!" #!!"
!"#
$%
&'()
'*+(,*'*,"-%
.,*'/0*0,%
123(&*
4567'
Even though the Faculty of International Liberal Arts (FILA) started in
2014, the slots used for FILA were fewer than for other faculties. The ECR staff
did not promote the ECR in those classes, so it is assumed that this might be the
reason for the low usage figures.
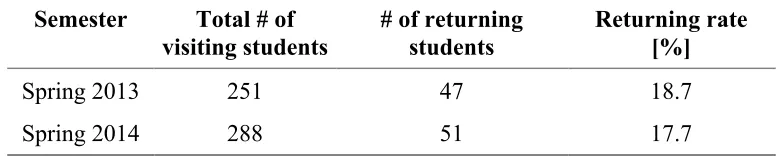
Returning students
When each session finished, the ECR staff recommended that the students
return. However, the recommendation did not have the desired effect. Table 5
indicates the number of returning students and the returning rate. In both 2013 and
2014, the percentage of returning students was less than 20%. In other words,
more than 80% of the students did not return. Between 2013 and 2014, the
number of returning students increased by 4. The percentage of returning students
in 2014 was 17.7%; a slight decrease of 1% compared with 2013.
Table 5. Returning Student Rate
Semester Total # of
visiting students # of returning students Returning rate [%]
Spring 2013 251 47 18.7
Spring 2014 288 51 17.7
Table 6 shows the number of times that students returned. In 2014, the
number of times students returned increased overall from 2013.
Table 6. Number of Times Students Returned
# of slots for returning students Semester
2 times 3 times 4 times 5 times 6 times Total
Spring 2013 32 9 5 1 0 47
Future action
The results obtained from the data resulted in a possible course of action for next year in order to achieve more active use of the program. First, it may be necessary to get support from the university faculties of Engineering and Nursing to help their students to be familiar with this language learning advising service. Although the total number of students majoring in these two faculties are much smaller than that of students majoring other faculties such as Law or Education, (a) specialized English courses for Engineering and Nursing students and (b) a greater physical distance to the ECR are the two major issues to be solved. The ECR advisors did not advertise to these students by visiting classes in 2014 and therefore they might not know that the ECR advising service is available to them. Researching these students’ needs in studying English and explaining the value and efficacy of the advising service to the faculty teachers may be effective for getting support from the faculty instructors. In addition, it could be also helpful for the ECR advisors to visit the orientation meetings for English training programs for Nursing and Engineering students. Those who are motivated to study English to participate this English program may be more likely to find the language advising service more valuable and use the ECR even though it is located far from the building where their classes are mainly held.
Second, it would be helpful for the ECR to collaborate with the student-oriented organizations which help students’ job hunting and therefore have frequently contact with juniors and seniors. This data indicated that the utilization rate decreased with student year. One possible cause is that, as previously
mentioned, English classes are usually taken mainly in the freshman and
Conclusions
This report has summarized the statistical data related to ECR use. One finding was that the reservation rate increased from 77% in 2013 to 91.9% in 2014. Approximately 60% of students who used the ECR were freshman students who might not have been familiar with this program before and this may indicate the effectiveness of the publicity activities conducted from 2013.
This research has limitations in that it does not show the reasons why the students who booked the session did not show up. While the reservation rate increased by approximately 15% from 2013 to 2014, 30% of the sessions still remained unused in 2014. Further investigation needs to be carried out in order to understand the reasons students canceled the sessions.
The results obtained from the data analysis also resulted in a possible course of action for the coming year in order to promote a more active use of the program. First, it may be necessary to get more support from the university teachers belonging to the faculty of Engineering and Nursing to help their students to be familiar with this language learning advising service. Second, it would be helpful for the ECR to collaborate with the organizations which provide juniors and seniors with support for job hunting.
Notes on the contributors
Yuuki Ogawa received a Master’s degree in TESOL at Soka University, Japan. She currently works as an English teacher as well as a Coordinator of the English Consultation Room. Her special interests include international understanding through English language education, academic advising, learner autonomy and critical thinking.
Ryo Hase is currently a graduate student in the Master’s program in Soka University, Japan. He currently works as a student advisor at the English
Consultation Room. His research interests include data analysis, computer science, and systems development.
Barrs, K. (2010). What factors encourage high levels of student participation in a self-access centre? Studies in Self-Access Learning Journal, 1(1), 10-16. Retrieved from http://sisaljournal.org/archives/jun10/barrs/
Croker, R., & Ashurova, U. (2012). Scaffolding students’ initial self-access
language centre experiences. Studies in Self-Access Learning Journal, 3(3), 237-253. Retrieved from
http://sisaljournal.org/archives/sep12/croker_ashurova/
Dofs, K., & Hobbs, M. (2011). How can Independent Learning Centres mediate language learning and communication? CLESOL 2010: Proceedings of the
12th National Conference for Community Languages and ESOL, 47-54.
Hughes, L.S., Krug, N.P., & Vye, S.L. (2012). Advising practices: A survey of self-access learner motivations and preferences. Studies in Self-Access
Learning Journal, 3(2), 163-181. Retrieved from
http://sisaljournal.org/archives/jun12/hughes_krug_vye/
Ishikawa, Y. (2012). The influence of learning beliefs in peer-advising sessions: Promoting independent language learning. Studies in Self-Access Learning
Journal, 3(1), 93-107. Retrieved from
http://sisaljournal.org/archives/march12/ishikawa/
Kodate, A. (2012). The JASAL Forum 2011: Growing trends in self-access learning. Studies in Self-Access Learning Journal, 3(1), 122-132. Retrieved from http://sisaljournal.org/archives/march12/kodate/
Shibata, S. (2013). JASAL Forum 2012: Making a difference through self access.
Studies in Self-Access Learning, Journal, 4(1), 62-69. Retrieved from
http://sisaljournal.org/archives/mar13/shibata/