IRJPEE
Enhancing
Energy
Efficiency
of
Distribution
Transformers through Energy Conservation Techniques
Rajashekar P. Mandi
Director, School of Electrical and Electronics Engineering, REVA University, Bangalore, India E-mail: [email protected]
This paper describes the various options of energy conservation methods to enhance the energy efficiency of transformers. The energy economics of using low loss core is also studied and given the results in this paper. The load management of distribution transformers have reduced the energy losses considerably in industries. In this paper, a detailed computer based evaluation of energy losses due to off-design operation and size mismatch of transformers, unbalanced secondary load, low power factor on the secondary are discussed for thermal power stations and process industries. Automation of transformer management is described as it can lead to considerable saving in energy. The energy conservation measures for distribution transformers have reduced the transformer losses by 10 – 15 % in industries.
Keywords: energy efficiency, all day efficiency, eddy current losses, winding losses, load factor,
INTRODUCTION
The present total installed power generation capacity in India is 228.72 GW, out of which 44 % of the energy is being used by industries. The estimated energy loss in transformers is 520 MW in industrial system (CEA, 2013, Growth of Electricity Sector in India from 1947 to 2013).
Electrical energy is the most popular form of energy being used as the main driving force in industrial units and power stations due to its versatility, easy to use & less pollution (Energy conservation in India (1983), Energy conservation bulletin, Tata Energy Documentation and Information Centre, 1983). The electrical energy for industrial sector accounts for about 50 % of total energy generated. Indian industries consume about 25 % more electrical energy for the same level of production as compared to the advanced countries due to hesitation in technology up-gradation, obsolete equipment, higher line losses, inadequate capacitive power compensation, poor quality of power supply, etc.
The electrical distribution network in many industries were extended in an ad hoc manner to provide power supply to new equipment with a minimum capital cost, resulting in increased network losses and poor-quality power supply. This had overloaded the transformers industries.
The transformers are the simple electrical equipment that transfer the power from voltage level to other voltage i.e., either step up or step down. This equipment is robust and sturdy which does not have any moving parts. Transformers require least maintenance compared to other electrical equipment. Due to the advancement in transformer core technology, new low loss transformers introduced.
The losses in transformers account for 3.6 % of total auxiliary power in a typical 210 MW plant and are in the range of 5 % to 16 % in process industries. Thus, due to acute shortage in power, it is essential to conserve the energy through minimizing the transformer losses by design up-gradation, use of low loss material, improved secondary load power factor, minimizing the voltage and load unbalance, suppressing the harmonics, use of better quality of oil, etc. (Rajashekar P. Mandi et al., 2012).
Transformer losses
These losses are mainly due to iron losses and winding losses.
International Research Journal of Power and Energy Engineering
Vol. 3(2), pp. 104-111, November, 2017. © www.premierpublishers.org, ISSN: 3254-1213xMandi RP. 105
A. Iron losses
The iron losses account for 1.77 - 3.85% of total input energy in an industry. These losses are mainly eddy current and hysteresis losses. The increased iron losses are due to idle charging, oversizing, use of inferior core material and harmonics in the distribution system, etc. Table I gives the core losses for different types of cores used in transformers.
TABLE I. THE CORE LOSSES FOR DIFFERENT GRADES OF TRANSFORMER CORES.
S/No Type/grade Thickness, mm
Core loss at flux density of 1.7 T,
W/kg
01 M4 0.27 1.22 02 MOH 0.30 1.01 03 ZH 100 0.27 0.96 04 ZDKH 0.23 0.84 05 Metal glass alloy
SA1 0.025 0.31
It can be seen from the table that the metal glass (Amorphous) cores will reduce the core loss by about 75 % and the cost of the metal glass core transformer will be 1.6 to 2 times (Hitachi, ‘Catalogue on Hitachi Amorphous Core Transformers’, Hitachi Industrial Equipment Systems Co. Ltd., Singapore). The Iron losses are divided into a) hysteresis losses & b) eddy current losses. Hysteresis losses are those which are inherent to magnetic fields. An empirical relation for hysteresis losses is given by (Sawhney A.K., 1990):
)
1
(
.
.
B
1max.6f
W
k
W
h
hwhere Kh is a constant dependent on the material used, f is frequency in Hertz and Bmax is maximum flux density in wb/m2.
Hysteresis losses mainly depend on applied voltage and frequency. If the voltage and frequency is high, the hysteresis losses will be more. But these losses mainly depend on the type of material used. The present new material (Amorphous) available in the market is having less hysteresis loss.
Eddy current losses occur because the magnetic core material itself consists of material that conducts electricity. As voltages are induced in the material by alternating magnetic fields, currents called eddy currents are produced. An approximate expression for these losses is given by:
)
2
(
.
.
.
B
max2f
2t
2W
k
W
h
ewhere Ke is a constant dependent on the material and t is thickness of material.
These eddy current losses are more for the harmonic prone areas where the higher order frequencies are available in the system voltage. The possibility of transformer core failure is more in harmonic prone area. These core losses play a major role in industrial system and power stations where the loading on these transformers will be less. All these transformers have to be either idle charged or loaded at partially cause more losses in core because core losses depend on the applied voltage and frequency and not directly depend on the load carried through transformers (Rajashekar P. Mandi and Udaykumar R Yaragatti, 2014).
The suggested measures are:
i. The stand-by transformers may be de-energised on primary side.
ii. Generally industrial distribution transformers are designed based on the all day efficiency of transformer and lower loading on these transformers cause more core losses.
iii. The loading on transformer in industries is often in the range between 10 - 30 % (low load factor). Wherever more number of transformers are installed and are working at low load factors, it is economical to shift all the load on to a single or multiple transformers without increasing the transformer load factor to above 65 - 70 %.
iv. The suppression of harmonics in the distribution will reduce the eddy current and hysteresis losses.
B. Winding losses
The winding losses in the transformers are in the range of 0.25 - 1.65 % of total energy in an industry. The increased winding losses are due to poor power factor, load unbalance, winding temperature and harmonic currents on the secondary (Say M.G., 1983).
The poor power factor will reduce the capacity of the transformer. The improved secondary power factor will reduce the winding losses and enhance the transformer capacity. The unbalanced load on secondary causes the reduction in transformer capacity. A load unbalance of 50 % will reduce the transformer capacity approximately by 14.5 %.
Int. Res. J. Power Energy Engin. 106
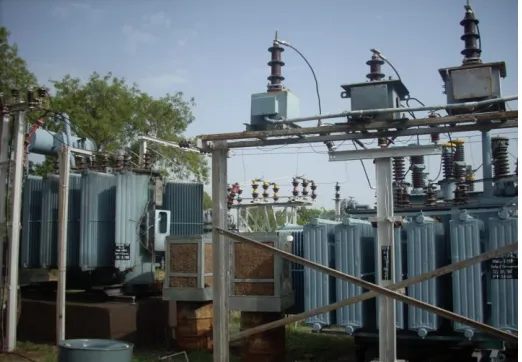
Fig. 1. View of Cooling of Transformer by using desert coolers r base
Fig 2. View of cooling Transformer by using desert coolers
EXPERIMENTAL RESULTS AND DISCUSSIONS
The transformer efficiency and the factor affecting the transformers efficiency are discussed below:
A. Voltage variation and unbalance
Unbalanced incoming voltage will reduce the capacity of transformer and cause more unbalanced load. Due to low incoming voltage, the efficiency of the transformer decreases (G.L. Dua, 1996). Generally, distribution transformers are provided with off-load tap changers to maintain the voltage at transformer secondary. The off-load tap changers are provided with either 5 taps or 7 taps. In 7 tap changers, the middle tap 4th is 1:1 ratio, the higher tap numbers i.e., 5 or 6 or 7 will increase the secondary voltage when the primary voltage is lower than rated value whereas lower taps i.e., 1 or 2 or 3 will reduce the secondary voltage in-case of primary voltage is higher than rated value. The voltage step between each tap is 2.5% of secondary rated voltage. Thus, 7 tap off load tap changer will provide voltage variation of ±7.5%. The sensitivity of efficiency to voltage is more pronounced at lower power factors i.e., below 0.90. When the power
factor is above 0.90, the variation in efficiency offered by voltage is less.
Case study 1: In a case study in an industry, the 500 kVA transformer (provided with off load tap changer of 7 taps) secondary voltage was measured during peak hour was about 380 V and the transformer tap was middle at 4. The computed transformer efficiency at an average load factor of 52% was 98.58%. The transformer tap position was increased to 7 by de-energising and again charged the transformer. The voltage was improved to about 400 V on secondary side with the same load factor of 52%. The transformer efficiency is computed as 98.65% i.e., an increase of about 0.07%. The reduction of power loss in 500 kVA transformer is 0.19 kW. The saving in transformer winding loss by changing the transformer tap is computed as:
)
3
(
100
1
2 2
1 2
W
W
LF
V
V
L
loss tap
C
Where V1 is the present transformer secondary voltage in V, V2 is the voltage after changing the transformer tap in V, LF is the load factor of transformer in % and Wc is the transformer winding loss at full load in W.
The higher secondary voltage improved the illumination level by about 10% and also enhanced the performance of process end-use equipments.
B. Harmonics
The effects of harmonic currents are copper loss due to circulating currents, increased core loss and interference magnetically with communication circuits and protective gear (Ramakrishnaiah R, 1996). The effects of harmonic voltages are increased dielectric stresses, electrostatic interference with communication circuits and resonance between the inductance of the transformer windings and the capacitance of a feeder to which they are connected (Ned mohan and Girish R Kamath, 1997). The voltage total harmonic distortion (THD) was measured about 7.4 % in an industry. But as per IEEE 519-1992, the voltage THD should be below 5 % and for special applications and critical loads it should be below 3 % for the system voltage up to 69 kV. The harmonics will reduce the capacity of transformers up to about 50 % and these can be suppressed by using harmonic filters (Rajashekar P. Mandi and Udaykumar R Yaragatti, 2016).
C. Load unbalance
Mandi RP. 107
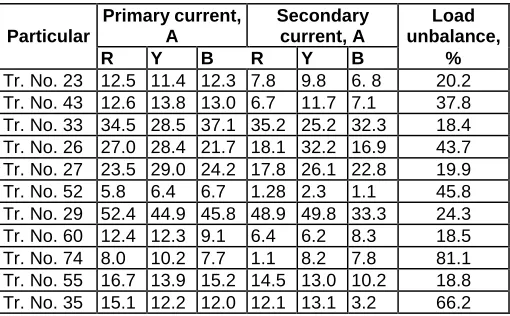
Case study 2: In a case study in Thermal power plant, the loading of lighting transformers is studied. Table II gives the current in three phases, load unbalance at primary & secondary side of transformer ( / Y connection) (100 kVA, 0.433/0.433 kV) in a power station. The load unbalance on secondary is in the range of 5.08 % and 32.45 % and the load unbalance at primary side is 18.44 % and 82.58 %. The increased loss due to load unbalance is 548 kWh/month. The flow of unbalanced current in secondary increased flow of current in primary windings. The reduction in load unbalance below 3 % by distributing the single-phase lighting loads equally on all three phases reduces the energy losses in transformer and network losses.
TABLE II. MEASURED CURRENT AND COMPUTED LOAD UNBALANCE AT LIGHTING TRANSFORMERS.
Particular
Primary current, A
Secondary current, A
Load unbalance, R Y B R Y B %
Tr. No. 23 12.5 11.4 12.3 7.8 9.8 6. 8 20.2 Tr. No. 43 12.6 13.8 13.0 6.7 11.7 7.1 37.8 Tr. No. 33 34.5 28.5 37.1 35.2 25.2 32.3 18.4 Tr. No. 26 27.0 28.4 21.7 18.1 32.2 16.9 43.7 Tr. No. 27 23.5 29.0 24.2 17.8 26.1 22.8 19.9 Tr. No. 52 5.8 6.4 6.7 1.28 2.3 1.1 45.8 Tr. No. 29 52.4 44.9 45.8 48.9 49.8 33.3 24.3 Tr. No. 60 12.4 12.3 9.1 6.4 6.2 8.3 18.5 Tr. No. 74 8.0 10.2 7.7 1.1 8.2 7.8 81.1 Tr. No. 55 16.7 13.9 15.2 14.5 13.0 10.2 18.8 Tr. No. 35 15.1 12.2 12.0 12.1 13.1 3.2 66.2
D. Power factor
The power factor in industries was varying between 0.70 to 0.85. At poor power factor of secondary load, the transformer efficiency is low. Fig. 3 gives the efficiency of transformer with improvement in power factor for 500 kVA transformers. The efficiency for 500 kVA transformer (load factor: 35%) is increased from 97.6 % to 98.5 % by improving the power factor from 0.70 to about 0.98. This had reduced the energy consumption of 324 kWh/month and the demand saving was 50 kVA. The investment is Rs. 1.50 lakhs (125 kVAR) and the payback period with considering the total demand saving at network is 13 months which is economically feasible solution.
Fig. 3. Variation of efficiency with load factor.
Case study 3: In a case study at power station, the power factor measured at secondary of Lighting transformers in each phase are in the range of 0.06 and 0.93 (Table III). The lower power factor causes more flow of current in the transformer winding that increased the losses in transformer. The installation of switchable single phase capacitor banks (360 kVAR) at secondaries of transformers lead to energy saving of 892 kWh/month and network demand saving of 25 kVA. The investment of Rs. 4.00 lakhs had a payback period of 40 months.
E. Load factor & transformer management
The overloading of transformer increases the hot spot temperature of winding. The rate of deterioration increases exponentially with temperature rise. This will reduce the transformer life drastically.
Int. Res. J. Power Energy Engin. 108
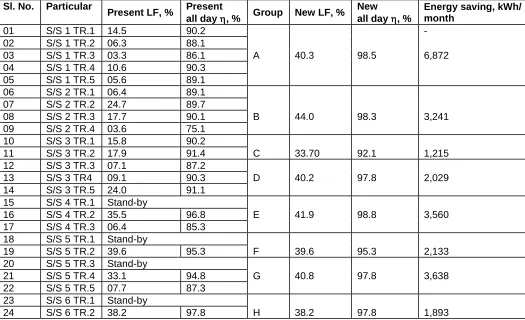
Table IV. energy savings through transformer management
Sl. No. Particular
Present LF, % Present
all day , % Group New LF, % New
all day , %
Energy saving, kWh/ month
01 S/S 1 TR.1 14.5 90.2 -
02 S/S 1 TR.2 06.3 88.1
03 S/S 1 TR.3 03.3 86.1 A 40.3 98.5 6,872
04 S/S 1 TR.4 10.6 90.3
05 S/S 1 TR.5 05.6 89.1
06 S/S 2 TR.1 06.4 89.1
07 S/S 2 TR.2 24.7 89.7
08 S/S 2 TR.3 17.7 90.1 B 44.0 98.3 3,241
09 S/S 2 TR.4 03.6 75.1
10 S/S 3 TR.1 15.8 90.2
11 S/S 3 TR.2 17.9 91.4 C 33.70 92.1 1,215
12 S/S 3 TR.3 07.1 87.2
13 S/S 3 TR4 09.1 90.3 D 40.2 97.8 2,029
14 S/S 3 TR.5 24.0 91.1
15 S/S 4 TR.1 Stand-by
16 S/S 4 TR.2 35.5 96.8 E 41.9 98.8 3,560
17 S/S 4 TR.3 06.4 85.3
18 S/S 5 TR.1 Stand-by
19 S/S 5 TR.2 39.6 95.3 F 39.6 95.3 2,133
20 S/S 5 TR.3 Stand-by
21 S/S 5 TR.4 33.1 94.8 G 40.8 97.8 3,638
22 S/S 5 TR.5 07.7 87.3
23 S/S 6 TR.1 Stand-by
24 S/S 6 TR.2 38.2 97.8 H 38.2 97.8 1,893
The transformer efficiency will be maximum when iron losses are equal to winding losses. Generally, the iron losses and winding losses will be equal at load factor of 45 to 55 % in case of distribution transformers. If the iron losses and winding losses are equal at 50 % load factor. Till the transformer load factor increases to 50 %, the iron losses will be dominant and above 50 % load factor, the winding losses will be dominant. In case if two transformers are sharing the load, it is economical to operate only one transformer while de-energizing other transformer till the load factor transformer reaches to about 70 %. If the load factor is more than 70 %, it is economical to operate both transformers in parallel to reduce winding losses. In order to optimization of number of transformers to be energized following relation is developed. The number of transformers to be charged in a bunch of transformer is computed and is given in Table V.
)
4
(
2 2
i C
r T
P
P
n
P
P
X
Where PT is the total demand in kVA, Pr is the rating of transformer in kVA, Pi is the No-load losses in kW, Pc is the Load losses of transformer in kW and n is the No. of transformers present.
Table V. Transformers to be charged with different values of X
Numbers to be charged Value of X
1 X 2
2 2 X 6
3 6 X 12
4 12 X 20
5 30 X 30
It can be seen from the Table V that if X is between 2 and 6, the number of transformers to be charged is 2 numbers to optimize the total transformer losses.
Case study 5: In a thermal power plant, there are two station transformers (charged from the grid, 220 kV / 6.6 kV) of 50 MVA ratings for two 210 MW units and two unit auxiliary transformers (charged from the individual 210 MW generator voltage, 15.7 kV / 6.6 kV) of 16 MVA rating for 210 MW plant. The auxiliary load is about 18 to 19 MW.
Mandi RP. 109
F. Oil quality
As the temperature of the transformer oil increases, the temperature and resistance of winding increases correspondingly and the transformer efficiency decreases. The temperature rise should be limited as per B.S. 171:1936. The important physical property i.e., Interfacial tension, Chemical properties i.e., acidity, sludge content and water content, and electrical properties i.e., dielectric strength (breakdown voltage), dielectric dissipation factor (Tan ) and resistivity are responsible for lower transformer efficiency.
The electrical properties of transformer oil are important in its function as an insulator, and their maintenance at an acceptable level (Table VI) ensures satisfactory equipment performance, reduces ohmic losses and limits discharge inception within the oil. To keep higher transformer efficiency, the oil should have high dielectric strength, high resistivity and low dielectric dissipation factor. Sludging is the slow formation of semi-solid hydrocarbons and are deposited on windings and tank walls. The formation of sludge is due to heat and oxidation. Experience shows that sludge is formed more quickly in the presence of bright copper surfaces. The transformer oil has to be heated in the presence of oxygen to test the sludge formation. If the sludge formation is less than the prescribed limit, the oil has to be changed.
Table VI. Properties of transformer oil.
Particulars Units Limits
Sludge % 0.10
Acidity after oxidation ( max ) mg KOH/G 0.40 Flash point ( min. ) 0C 140
Viscosity at - 15 0C cSt 800
Viscosity at 27 0C cSt 40
Pour point ( max. ) 0C -30
Break down voltage with 2.5 mm standard gap
Upto 11 kV kV 25 11 - 33 kV kV 30 66 - 220kV kV 40
220kV kV 45
400kV kV 50
Water content ( max.) ppm 5.00 Acidity (neutralization value
(max.) mg KOH/g 0.03 Dissipation factor (Tan ) (max.)
at 270C - 0.005
at 900C - 0.001
Oil density at 270C kg/m3 890
Due to oxidation of transformer oil produces CO2, volatile, water soluble organic acids and water. These combination attack and corrode iron and other metal parts. Oil conservators are desirable to avoid the condensation of water soluble acids on the under surface of the tank lid from which acidic droplets may fall back into the oil.
The deterioration of oil during its working life be retarded by the use of oxidation inhibitors which are usually of the
phenolic or amino type, convert chain forming molecules in the oil into inactive molecules, being gradually consumed in the process. Inhibitors greatly prolong the phase in the service life of the oil which precedes the onset of deterioration and during which the acid and sludge formations are substantially zero.
Modeling of transformers
The transformer losses consist of load losses (85 % of total losses) and no-load losses (15 % of total losses) in the ratio of 17 : 3 for a typical distribution transformer (Darshan Sakpal, 1996)
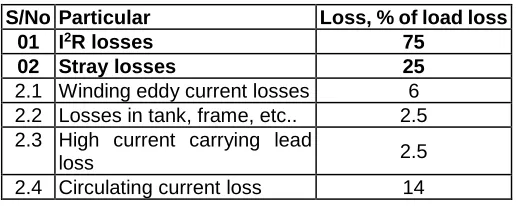
Table VII gives the load losses in 2 MVA (11/0.433 kV) transformer. The load losses are grouped into (a) I2 R loss: Due to winding resistance & the current flowing through the transformer winding and these losses from about 75 % of load losses. (b) Stray losses: These are produced by the leakage flux which cuts the conductors & metallic parts such as frame, tank, clamping structures, etc., and due to the circulating current through these metal parts.
Table VII. Load losses in a transformer
S/No Particular Loss, % of load loss
01 I2R losses 75
02 Stray losses 25
2.1 Winding eddy current losses 6 2.2 Losses in tank, frame, etc.. 2.5 2.3 High current carrying lead
loss 2.5
2.4 Circulating current loss 14
The I2 R losses may be reduced by reducing the resistance of winding i.e., by increasing the conductor cross section. The stray losses can be minimized by reducing the conductor size and increasing the number of conductors in parallel, increasing the clearances of tank and metallic parts with conductors and adequate arrangement of inlet & outlet leads. The load losses also can be reduced by transposing the conductors such that each conductor cut the same leakage flux.
The no load losses are those independent of the load. These are mainly due to eddy current and hysteresis losses in core. The use of amorphous (metallic glass core) in place of CRGO core will reduce the no load losses [13]. Table VIII presents the no load losses of transformers for different core material. It can be seen from the table that the loss reduction is about 70 % and 76%.
Table VIII. No-load losses for different cores
Rating, No-load losses, W Saving,
kVA CRGO Amorphous %
25 100 30 70
63 180 45 75
Int. Res. J. Power Energy Engin. 110
Automation of Transformer network
In an industry where the distribution system is widely spread over, it is emphasized to introduce the automated distribution network control system [14] which contains Power Monitoring Devices (PMD), power transducers, CTs, PTs, Programmable logic controllers (PLC), Supervisory Control and Data Acquisition (SCADA), application software, etc.
The PMD works based on the input data from power transducers that have the ability not only to gather and analyze the power system data but also the added functionality of remote status input and control outputs for peripheral functions such as Alarm, Trip and Control action.
These devices when integrated with PLCs and SCADA based computer workstations, will provide very powerful power monitoring control, protection of power automation system and along with application software will supervise, control, collect, analyze and archival of the data.
The application software can offer graphic-based data displays that can be used for displaying real-time power data parameters and graphics of the power monitoring system. This can provide the evaluation of power/energy input, losses, load factor, all day efficiency, etc., on hourly, daily, monthly and yearly on the mean value basis. The critical conditions can be stored and re-viewed whenever required. The charging and de-energisation of transformers can also be programmed.
CONCLUSION
Present all India electrical energy loss occurring on account of transformers - size mismatch and internal losses in industrial sector is ~ 520 MW. Energy loss due to voltage variation and unbalance is varying between 1.5 - 6.5 % of total transformer load which can be reduced in the range of 1.0 - 4.0 % by implementing energy conservation techniques like installation of regulating transformer on HT side and appropriate selection of transformer tapping. The minimization of load unbalance on transformer secondaries and operational optimization of transformer reduces the energy losses from 1.5 - 6.5 % of transformer load to 1.2 - 4.5 %. The improvement of power factor on secondaries of 500 kVA transformer near to 0.96 enhanced the transformer efficiency from 94.25 - 97.75 % to 95.5 - 98.7 %. Appropriate sizing of transformer and load management as suggested in the paper, reduces the energy loss from 5 - 16 % of the total energy handled by transformer to 2.5 - 8.2 %. The implementation of overall energy conservation measures reduces the all India transformer loss by 35 % of the present loss which works out to a saving of about 180 MW.
REFERENCES
CEA, 2013, Growth of Electricity Sector in India from 1947 to 2013, website: http//:www.cea.nic.in.
Darshan Sakpal (1996), Computer aided design for energy efficient transformers, Electrical India, 29th Feb. 1996, pp. 31-34.
Energy conservation in India (1983), Energy conservation bulletin, Tata Energy Documentation and Information Centre, 1983, pp. 13-38.
G.L. Dua (1996), Debut of ultra-energy efficient transformers in India, Electrical India, 29th Feb. 1996, pp. 17-18. Hitachi, ‘Catalogue on Hitachi Amorphous Core
Transformers’, Hitachi Industrial Equipment Systems Co. Ltd., Singapore, website: http://www.hitachi.com.sg. 4 J. McCarthy (1997), Power monitoring devices: trends in
power automation, Electrical India, 28th Feb. 1997, pp. 19-22.
Ned mohan and Girish R Kamath (1997). Active power filters-Recent advance”, Sadhana, Vol.22, Part 6, pp. 723 - 732.
Rajashekar P. Mandi and Udaykumar R Yaragatti (2014). Technological advances in distribution transformers. Electrical Power & Review Magazine, Vol. 2, issues 11, pp. 39-41.
Rajashekar P. Mandi and Udaykumar R Yaragatti (2016). Power Quality issues in Electrical Distribution System and industries. Asian Journal of Engineering and Technology Innovation, Vol. 2016, issues 3, pp. 64-69. Rajashekar P. Mandi, S. Seetharamu and Udaykumar R Yaragatti (2012). Energy Efficiency Improvement of Auxiliary Power Equipment in Thermal Power Plant through Operational Optimization. Proc. of IEEE International Conference on Power Electronics, Drives and Energy Systems (PEDES), at National Science Seminar Complex, CSIC, IISc, Bangalore.
Ramakrishnaiah R. (1990). Impact of harmonics and voltage fluctuation in reactive power problems. Electrical India. pp. 25 - 27.
Sawhney A.K. (1990). A course in electrical machine design, Dhanpat Rai and Sons Publications, New Delhi, pp. 331-451.
Say M.G. (1983), The performance and design of alternating current machines, CBS Publishers and Distributors, New Delhi, pp. 64-101.
Mandi RP. 111
Accepted 23 October, 2017
Citation: Mandi RP (2017). Enhancing Energy Efficiency of Distribution Transformers through Energy Conservation Techniques. International Research Journal of Power and Energy Engineering, 3(2): 104-111.