______________
PRISCILLA L. SOUTHWELL is professor of political science and associate dean, College of Arts and Sciences, University of Oregon. ERIC A. LINDGREN is a Ph.D. candidate, Department of Political Science, University of Oregon. RYAN A. SMITH is a Ph.D. candidate, Department of Political Sci-ence, University of Oregon.
The American Review of Politics, Vol. 25, Winter, 2004: 305-320 ©2004 The American Review of Politics
Lifetime Term Limits: The Impact on Four State Legislatures
Priscilla L. Southwell, Eric A. Lindgren, and Ryan A. Smith
This research examines the roll call voting record of state legislators in Arkansas, California, Michigan, and Missouri in order to assess if there are any substantive differences between those legislators who are nearing retirement due to term limits (“last term” legislators) and those legisla-tors who are at an earlier stage of their legislative careers. These are the only four states in the United States that have lifetime term limits in full effect. Binomial logit analysis of key roll call votes suggests that these “last term” legislators stand apart from their other colleagues on certain issues. This characteristic arises from the increased tendency of last-term legislators to defy the party leadership, albeit on a limited number of bills. This “independent streak” of last-term legislators is even more pronounced among Republican legislators, although this effect is not present in the state of California. Therefore, term limits appear to have a modest, but potentially significant effect on the policy preferences of legislators.
The instruction of term limits in certain U.S. state legislatures intro-duces an entirely new context for these state governments, and raises the possibility that these state legislators will no longer be bound to their con-stituencies, parties, or potential campaign contributors in the same manner as in previous sessions. As such, term-limited legislators may exhibit different types of voting behavior than their predecessors because they are freer from the constraints that influence a legislator looking toward his next re-election effort. The purpose of this research is to determine if the voting patterns of last-term legislators differs from that of regular legislators. Are they more or less independent from the party leadership? Do they exhibit different policy preferences? Do such differences occur more frequently in one particular party? In essence, we are asking a basic question: Does term limits make a difference in how legislators vote, particularly during their last-term in office?
Theoretical Considerations
centers primarily on whether term limits will attract a different sort of legis-lator, and therefore affect the demographic, attitudinal, and ideological makeup of future legislatures.2 The second focuses on possible changes in the legislative activities and career patterns of legislators as a result of term limits.3 The third area of inquiry centers on the likely institutional effects of term limits, examining the impact of term limits on the power of party lead-ers, interest groups, and lobbyists, 4 as well as the electoral aspects of term limits.5
Our research falls into the second area of inquiry, as we determine whether there are any behavioral differences between those legislators who are nearing retirement due to term limits (“last term” legislators) and those legislators who are at an earlier stage of their legislative careers. As such, we are zeroing in on the vastly increasing number of “lame ducks” since the imposition of term limits.
The phenomenon of “last term” legislators has not gone unnoticed by both advocates and critics of term limits. Supporters of term limits have argued that the severing of this electoral link will give legislators the free-dom to be a “citizen legislator” or independent statesman, to reflect the broader interests of the state, and to be less constrained by the demands of large campaign contributors (Fiorina 1994; Lott and Bronars 1993; Petracca 1993; Will 1992).
Others are less sanguine about the prospects of such “unchecked” legis-lators. Labeled the “last term problem,” this situation is seen, conversely, as one where the lack of electoral punishments and rewards produces the poten-tial for moral hazard. Such legislators may “shirk,” if they desire to do so, by voting their personal preferences, the wishes of special interest groups, or a future constituency, rather than reflecting the interests and needs of voters in their district (Ferejohn 1993; Hinich and Munger 1997; Ordeshook 1997; Rothenberg and Sanders 2000).
Both of these viewpoints assume that there is a last-term phenomenon, although they differ in their normative assessment of this expected result. Should we expect that last-term legislators would be more likely to cast their votes in manner that would be different from other legislators, perhaps by casting a minority vote when a bill is likely to pass or to vote against the preferences of the party leadership? Or is the null hypothesis true, and neither statesman-like behavior nor shirking will emerge?
Previous Research on Term Limits
two states (California and Maine) had completely replaced the membership of their lower houses, and a majority of legislators in Michigan, Arkansas, and Oregon had left office.6 In Colorado, Florida, Ohio, and Montana, at least one-third of legislators face involuntary retirement. As term limits come into effect in more states, researchers now have the ability to examine individual-level data in order to compare legislators in various stages of their career—in particular, to examine those last-term or “lame duck” legislators who are facing their final legislative session.7 In most of these states, a sub-stantial proportion of legislators are in this situation; in some instances, state senates have one-half of all senators in their last term of service in that body. Previous research on the behavioral aspects of last-term legislators has generally focused on the U.S. Congress. Herrick et al. (1994) found that representatives in the U.S. House who have decided not to seek re-election are less likely to be attentive to their constituency or to the day-to-day busi-ness of the House, but they are more likely to have a successful and more tightly focused legislative agenda. Reed et al. (1998) conclude that term limits would likely have little consequential effect on spending policy in Congress. Zupan’s (1990) time series analysis indicates that retiring mem-bers of Congress tend to shirk more during their last terms, but the amount of shirking in this group is not any larger than the nonretirees. However, Carey’s research (1996) on U.S. Congress and Latin American legislatures suggests that shirking is more common among those who aspire to a state-wide office after the last term.
The adoption of term limits in certain state legislatures now creates an opportunity to examine the last-term phenomenon in the context of the wide-spread involuntary imposition of retirement. Such analysis becomes possible because of the simple, instrumental fact that there are more such legislators that now fall into this “last term” category.
Methodology
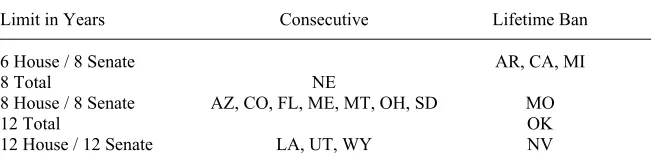
Table 1. Consecutive vs. Lifetime Term Limits
Limit in Years Consecutive Lifetime Ban
6 House / 8 Senate AR, CA, MI
8 Total NE
8 House / 8 Senate AZ, CO, FL, ME, MT, OH, SD MO
12 Total OK
12 House / 12 Senate LA, UT, WY NV
Source: National Conference of State Legislatures, 2003.
Our assumption is that any distinction that may occur because of the last term is much more likely for a legislator that is facing the permanent end of a state legislative career, rather than a brief hiatus in his or her legislative career. This distinction allows the comparison among two types of legis-lators: (1) Last-term Legislators—who are in their last term in office; (2) Regular—those legislators who are in their first or second term of office.
Our purpose is to examine the substantive nature of particular legisla-tion within each state in order to see if last-term legislators voted in a differ-ent manner from regular legislators on marginal or “nonconsensual” bills. Given that a vast majority of proposed legislation passes or fails by a wide margin, or dies in subcommittee, our goal was to identify those bills that evoked a certain amount of controversy or debate with the state legislature, such that the distinctiveness, if any, of last-term legislators would be re-vealed. These bills were selected if passage in one house was by less than a two-thirds vote margin or if the bills were subsequently vetoed by the gover-nor of the state. By this method, twenty-nine “nonconsensual” bills emerged from among these four states. In order to asses the degree of party voting, a comparison was made between each legislator’s vote and that of the party leader in his or her state legislative body across the selected 6-8 roll-call votes per state. This data was obtained by access to the state legislative web-sites for the 2001-2002 legislative sessions (www.accessarkansas.org; www. sen.ca.gov; www.assembly.ca.gov; www.michiganlegislature.org; www. secretary-of-state.org/michigan.htm; www.state.mi.us; www.senate.state. mi.us).
Multivariate Analysis
analysis8 sets regular legislators, as the baseline. The coefficients thus show how last-term legislators differ from regular legislators who are not in their last term of office. This analysis is shown in Tables 2a-2d. The first column of coefficients (Model 1) shows how the roll call votes of last-term legislators differ from the votes of regular legislators. For example, a positive coefficient indicates that last-term legislators were more likely to vote for this particular bill than were regular legislators.
The second column (Model 2) shows the difference between last-term and regular legislators with regard to party loyalty; that is, how likely they were to vote against the preferences of their own party leader. For example, a negative coefficient indicates that last-term legislators were more likely to vote differently from their own party leader in that house than were regular legislators.
These results suggest that last-term legislators differed from regular legislators with regard to voting on certain crucial bills in their respective state legislatures, even after controlling for party membership, campaign contributions, and other demographic characteristics. Only in the state of Michigan are any demographic variables significant, suggesting that last-term legislators in that state were generally older and more likely to include Democrats in their midst.
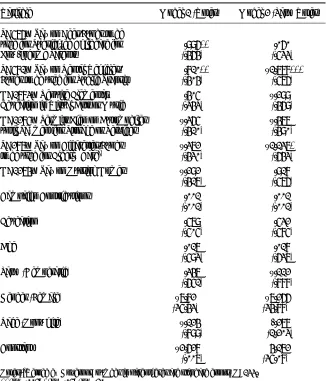
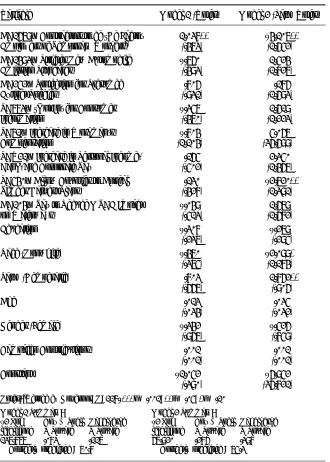
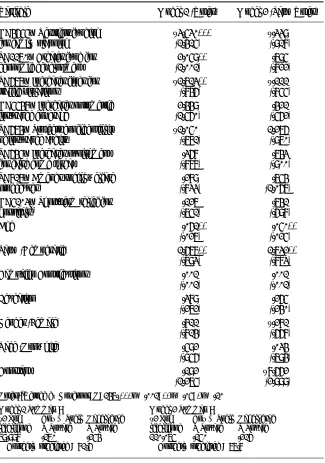
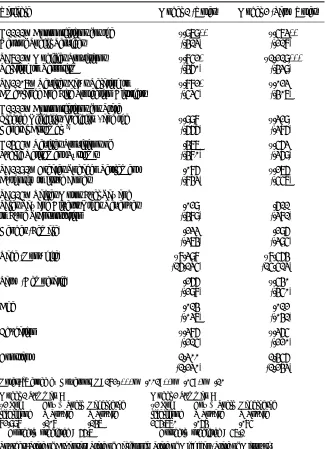
The contrast between the voting behavior of these two groups was sig-nificant on about one-third of these roll call votes. In Arkansas (Table 2a), last-term legislators were more likely to support increased taxes on beer to fund child care as well as supporting a bill to increase the tax on rental cars to provide public transit subsidies. Similarly, in California, (Table 2b) last-term legislators were more likely to vote for legislation that required a con-tractor to be the “employer” of a temporary worker for the purposes of work-men’s compensation and liability. (This bill was subsequently vetoed by the governor of California.) In Michigan, (Table 2c) last-term legislators were
less likely to vote for restrictions in family planning services (primarily pro-hibiting abortion referrals), but more likely to support legislation creating a fund for economic development. Last-term legislators in Missouri (Table 2d) were less likely to vote for anti-terrorism measures, reduced ambulance and fire district coverage, or to approve the budget for the state’s social service agencies. (This last bill was subsequently vetoed by the governor.)
Table 2a-2d. Coefficients from Binomial Logistic Model of Selected Roll Call Votes and Party Line Votes: 2001-2002 Legislative Sessions
Table 2a. State of Arkansas: Comparison of Last-term Legislators and Regular Legislators (2001)
Variable Model 1 (Votes) Model 2 (Party Votes)
SB576—Tax on Beer/Funds to be
used for Subsidized Childcare for .996** .060
Low-Income Parents (.464) (.533)
SB581—Tax on Rental Vehicles/ .810** –1.788***
Funds to be used for Public Transit (.404) (.576)
HB1883—Require Elementary .405 –.299
Education in Visual Arts or Music (.343) (.469)
HB1285—Permits Lien on Automobiles –.365 –.477
until Payment for Storage or Services (.410) (.490)
SB287—Tax on Cigarettes/Funds –.372 –1.137*
to be used for Elderly Carea (.430) (.643)
HB1274—Tax on Nursing Homes –.292 .918
(.417) (.576)
Campaign Contributions .001 .001
(.001) (.001)
Education .579 .532
(.505) (.585)
Age .017 .018
(.593) (.637)
Party (Democratic) .347 –.112
(.651) (.888)
Gender (Female) –7.82 –7.266
(35.43) (34.88)
Race (Nonwhite) –.124 -.278
(.899) (1.203)
Constant –2.628 4.172
(.007) (35.08)
Notes: aVetoed by Governor; number in parentheses are standard errors; N=133.
***p ≤ .001; **p ≤ .05; *p ≤ .10
Model 1 Summary: Model 2 Summary:
Table 2a-2d (continued)
Table 2b. State of California: Comparison of Last-term Legislators and Regular Legislators (2002)
Variable Model 1 (Votes) Model 2 (Party Votes)
AB1679—Contractors to be ‘De Facto’ 1.038** –4.107**
Employers of Temporary Workersa (.473) (1.652)
AB1493—Stricter New Automobile –.760 1.524
Emission Standards (.493) (1.827)
AB252—Protection for Presumed .806 .186
Extinct Species (.931) (1.693)
SB773—‘Opt In’ for Consumer –.357 1.619
Information (.470) (1.223)
SB71—Increase in Workman’s –.804 5.067
Compensation (1.104) (36.699)
SBX21—Increase in Personal Income, .165 2.350
Bank, and Corporate Tax (.502) (1.467)
SB540—Allow Counties to Appeal .130 –2.720**
Timber Harvest Plans (.428) (1.391)
AB104—Tax to Reduce MTBE Impact –.049 1.679
on Waterways (.513) (1.682)
Education –.308 –.279
(.237) (.295)
Race (Nonwhite) –.470 –2.099*
(.375) (1.184)
Party (Democratic) .803 1.862**
(.667) (.906)
Age .013 .035
(.034) (.032)
Gender (Female) –.342 –.526
(.967) (.859)
Campaign Contributions .001 .001
(.001) (.001)
Constant –1.052 –6.952
(.390) (36.821)
Notes: aVetoed by Governor; N=118. ***p ≤ .001; **p ≤ .05; *p ≤ .10
Model 1 Summary: Model 2 Summary:
Table 2a-2d (continued)
Table 2c. State of Michigan: Comparison of Last-term Legislators and Regular Legislators (2002)
Variable Model 1 (Votes) Model 2 (Party Votes)
HB4655—Restricts funding –3.530*** –.339
for family planning (1.415) (.918)
SB1170—Creates fund for 2.059** .795
economic development (1.001) (.822)
SB677—Increases fines for –1.713** –.111
traffic violations (.846) (.855)
HB5548—Increases optometric 2.449 .421
insurance coverage (1.560) (.562)
SB674—Protects confidentiality –1.050 1.276
of insurance audits (.781) (.970)
SB645—Increases punishment .368 .743
for false bomb threat (.877) (.900)
SB817—Amends social welfare .289 .754
procedures (.833) (1.067)
HB5103—Short-term relief for .127 .741
hospitalsa (.751) (.698)
Age .061** .050**
(.027) (.025)
Party (Democratic) 1.677** 1.732**
(.793) (.873)
Campaign Contributions .001 .001
(.001) (.001)
Education .389 .265
(.272) (.240)
Gender (Female) .811 –.281
(.814) (.668)
Race (Nonwhite) .592 .034
(.956) (.794)
Constant .192 –8.662
(1.275) (2.999)
Notes: aVetoed by Governor; N=147. ***p ≤ .001; **p ≤ .05; *p ≤ .10
Model 1 Summary: Model 2 Summary:
Table 2a-2d (continued)
Table 2d. State of Missouri: Comparison of Last-term Legislators and Regular Legislators (2002)
Variable Model 1 (Votes) Model 2 (Party Votes)
H1111—Appropriations for the –.979** –.573**
Dept of Social Services (.413) (.218)
SB712—Modifies Provisions –.852* –1.219***
Relating to Terrorism (.460) (.439)
SB1107—Revises Laws Relating to –.882* –.023
Ambulance and Fire Protection Districts (.535) (.407)
H1112—Appropriations for State
Elected Officials, Judiciary, and the –.998 –.329
General Assemblya (.666) (.386)
H1455—Revises Provisions of .477 –.563
Public Retirement Systems (.480) (.369)
SB1191—Creates Tobacco Settlement .086 –.276
Authority to Issue Bonds (.843) (.557)
SB915—Raises Motor Fuel Tax and
Sales Tax and Diverts Other Revenues .029 .611
to Fund Transportation (.489) (.381)
Gender (Female) .233 .296
(.374) (.395)
Race (Nonwhite) –8.398 –8.564
(16.135) (15.513)
Party (Democratic) .266 –.540
(.298) (.450)
Age .014 .012
(.037) (.041)
Education –.386 –.365
(.215) (.220)
Constant 1.300 1.456
(1.230) (1.243)
Notes: aVetoed by Governor; N=182. ***p ≤ .001; **p ≤ .05; *p ≤ .10
Model 1 Summary: Model 2 Summary:
considered the “de facto” employer of temporary workers was a stance that required many Democrats and Republicans among them to take a stance that opposed the position of their respective party leader.
The main exception is the state of Michigan (Table 2c) where a higher percentage of last-term legislators were Democratic than in other states, but their distinctiveness in voting apparently did not arise from the extent of their party loyalty. The same pattern is true of the last-term legislators in Arkansas who were more likely, as a group, to support a beer tax, and those in Missouri who did not support a revision of the fire and ambulance dis-tricts.
Model 2 also reveals instances where the actual roll call votes of last-term legislators were not significantly different from regular legislators but this group was nonetheless more willing to deviate from the party line in casting their votes. For example, in Arkansas, last-term legislators were less likely to follow their party’s lead in the proposed tax on cigarettes. Similar-ly, in California, last-term legislators were lesslikely to vote with their party leader on the appeal of timber harvest plans.
Non-Party Votes and Partisanship
We also examined whether there was a particular partisan leaning to the non-party votes among last-term legislators. That is, when the votes of these last-term legislators deviated from the party leadership, did they do so in a liberal or conservative direction? Did Democratic or Republican last-term legislators show an equal tendency to vote independently of their respective parties? We are thus testing an interactive hypothesis about the effect of last term status by examining whether it is more prevalent under certain condi-tions related to partisanship.
In general, only for the states of Arkansas and Missouri can we con-clude that there was a partisan component to the greater tendency of last-term legislators to vote differently from their party leadership. In Arkansas, Republican last-term legislators had a mean party line vote score of 3.71 (out of a top score of six, indicating 100% party allegiance) compared to the 5.01 mean score for last-term Democrats. For regular legislators, the mean scores were 4.56 and 5.22, respectively. A similar pattern emerged in Missouri but not in Michigan and California.
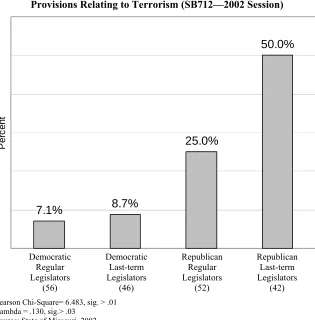
Figure 1. State of Missouri: Non-Party Vote on Bill Modifying Provisions Relating to Terrorism (SB712—2002 Session)
7.1%
8.7%
25.0%
50.0%
P
er
c
ent
Democratic Democratic Republican Republican Regular Last-term Regular Last-term Legislators Legislators Legislators Legislators
(56) (46) (52) (42)
Pearson Chi-Square= 6.483, sig. > .01 Lambda = .130, sig.> .03
Source: State of Missouri, 2002.
Figure 1 shows one such example from the State of Missouri (where six out of the seven roll call votes showed significant differences between Re-publican last-term legislators and all other types of legislators). This par-ticular Republican-sponsored bill strengthened the penalties for “terrorist” activities. These results show that a higher percentage of last-term Republi-can legislators deviated from their party leader in voting against this bill than did regular Republican legislators. Both types of Democratic legislators tended to back their party leader.
Michigan, and none in California. Certainly the amount of Republican Party divisiveness in these states could have arisen because of their “border South” status or simply have been the result of particular conflictual legislative sessions, given that each party controlled one house each. As such, we must be cautious about drawing any general conclusions. However, it is notable that such party friction appears to have manifested itself more clearly in the behavior of last-term legislators of a certain party.
It could be argued that those legislators who were elected prior to the imposition of term limits might vote differently than those who have always faced with the constraints of term limits. A separate analysis, not presented in this research, distinguished between these two types of term-limited legis-lators in the state of Missouri. (The other three states no longer contain such “old time” legislators.) We found no differences in voting behavior or party voting between these two types of term-limited legislators, but both types were distinct from regular legislators. As such, both types of term-limited legislators appear to exhibit some unique behavioral patterns due to the “lame duck” nature of their last session in the legislature.
Summary and Conclusions
This research centers on only four states and examines a subset of the many hundreds of bills introduced in each session. This “snapshot” of legis-lative roll-call votes does ignore other crucial aspects of legislegis-lative behavior such as the drafting, amending, and debating roles. Nonetheless, the policy and partisan distinctiveness of last-term legislators on certain roll call votes is important. Last-term legislators appeared more likely to vote indepen-dently from party leadership on certain key bills, and such behavior was slightly more prevalent among Republicans.
This tendency may represent an interactive effect of both involuntary retirement under term limits and a long legislative career. That is, certain of these high-profile votes may have offered them a chance at a final “swan song,” even if they were voting against their own party. Perhaps, these indi-viduals are living up the “independent statesman” expectations of term limits advocates, or Carey et al.’s (2000) hypothesized “Burkean shift.”
APPENDIX Variable Description
Term Limit Status: 1= Legislator in last term due to term limits; 0 = Other legislator
Roll Call Vote: 1 = yes vote; 0 = no vote
Party Vote: 1 = vote (yes or no) matched vote of respective party leader in one’s legis-lative body (Speaker, House Minority Leader, Senate Majority Leader, or Senate Minor-ity Leader); 0 = otherwise
Party: 1 = Democrat; 0 = Republican
Gender: 1 = Female; 0 = Male
Race: 1 = Nonwhite; 0 = White
Age: Years
Education: 1 = less than high school; 2 = high school diploma; 3 = some college; 4 = B.A or B.S.; 5 = advanced degree
Campaign Contributions: Amount ($) received in previous year (Source: Project Vote Smart [2002] and Follow the Money [2002])
NOTES
1See Farmer, Rausch and Green (2003) for a comprehensive compilation of term
limits research.
2See Brown, Powell, and Wilcox (1995); Carey (1996); Everson (1992); Malbin
and Benjamin (1992); Niemi and Powell (1998); Caress (1999); Carroll and Jenkins (2000); Fund (1992); Petracca (1993); Polsby (1991); Reed and Schansberg (1995); Thomson and Moncrief (1993).
3See Capell (1996); Caress (1996); Carey (1996); Carey, Niemi, and Powell (1998);
Glazer and Wattenberg (1996); Mitchell (1991); Moore and Hibbing (1994); Novak (1993); Petracca (1993); Powell (2000); Reed et al. (1998); Rosenthal (1992); Will (1992).
4See Brady and Rivers (1991); Carey (1996); Carey, Niemi, and Powell (1998);
Francis and Kenny (1997); Franklin and Westin (1998); Gilmour and Rothstein (1994); Gilmour and Rothstein (1996); Grofman and Sutherland (1996); Malbin and Benjamin (1992); Maestas (2000); Mitchell (1991); Moncrief (1999); Squire (1998); Will (1992).
5See Carey, Niemi, and Powell (2002); Daniel and Lott (1997); Francis and Kenny
(1997); Lee (2002); Lowry (1998); Squire (2000).
6Oregon’s term limits were overturned by the State Supreme Court in 2002; term
limits had been in effect since 1992.
7The most comprehensive study to date is a 1995 survey of 3000 state legislators by
Carey, Niemi, and Powell (1998, 2000).
8Because we are trying to distinguish between two types of state legislators,
last-term legislators and regular legislators, it is appropriate to use a binomial logit model. The model to be estimated is:
Log[Prob(Yi = 0)] = a +B1jX1i + …+ BKjXKjfor j =1… J, i =1 … N
In this model, a base category is assigned an arbitrary value of 0, in this case, regular legislators. The categories of legislators are thus numbered [0,1]. The odds of an observa-tion falling into category 1 (last-term legislators) relative to category 0 (regular
assumes that the logarithm of the odds of being in one category relative to another is a
linear function of some set of discriminating variables X1i,…,XKj. See Nownes (1992).
9The other ten bills where significant differences occurred were:
Missouri—Republican last-term legislators were more likely to cast a non-party vote by
voting against 1) Appropriations for the Department of Social Services (H1111); 2) Re-vision of Laws Relating to Ambulance and Fire Protection Districts (SB1107); 3)
Appro-priations for State Elected Officials, Judiciary and the General Assembly(H1112) and
voting for 4) Revision of the public retirement system (H1455) and 5) Raising the motor fuel tax and sales tax for transportation (SB915).
Arkansas—Republican last-term legislators were more likely to cast a non-party vote by
voting for 1) Tax on beer with funds to be used for subsidized childcare (SB576); 2) Tax on rental vehicles with funds to be used for public transit (SB581); 3) Requirement of elementary education in visual arts or music.
Michigan—Republican last-term legislators were more likely to cast a non-party vote by
voting against 1) Protection of confidentiality of insurance audits and by voting for 2) Creation of fund for economic development.
REFERENCES
Benjamin, Gerald. 2000. Review of Term Limits in the State Legislatures. Political
Sci-ence Quarterly 115: 664-665.
Caress, Stanley M. 1999. The Influence of Term Limits on the Electoral Success of
Women. Women & Politics 20:45-63.
Caress, Stanley M. 1996. The Impact of Term Limits on Legislative Behavior: An
Exam-ination of a Transitional Legislature. PS–Political Science & Politics 29:671-676.
Carey, John M. 1996. Term Limits and Legislative Representation. Cambridge:
Cam-bridge University Press.
Carey, John M., Richard G. Niemi, and Lynda Powell. 1998. The Effects of Term Limits
on State Legislatures. Legislative Studies Quarterly 23:271-300.
Carey, John M., Richard G. Niemi, and Lynda Powell. 2000. Term Limits in the State
Legislatures. Ann Arbor: University of Michigan.
Carroll, Susan, and Krista Jenkins. 2000. Increasing Diversity or More of the Same? Term Limits and the Representation of Women, Minorities, and Minority Women in State Legislatures. Presented at the annual meeting of the American Political Sci-ence Association, San Francisco, CA.
Daniel, Kermit, and John R. Lott, Jr. 1997. Term Limits and Electoral Competitiveness:
Evidence from California’s State Legislative Races. Public Choice 90:165-184.
Everson, David H. 1992. The Impact of Term Limitations on the States: Cutting the
Underbrush or Chopping Down the Tall Timber? In Limiting Legislative Terms,
eds. G. Benjamin and M.J. Malbin. Washington, DC: Congressional Quarterly Press.
Farmer, R.D., J.D. Rausch, J.C. Green, eds. 2003. The Test of Time: Coping with
Legisla-tive Term Limits. Lanham, MD: Lexington Books.
Ferejohn, J.A. 1993. The Spatial Model and Elections. In Information, Participation, and
Choice: An Economic Theory of Democracy in Perspective, ed. B. Grofman. Ann Arbor: University of Michigan Press.
Fiorina, Morris D. 1994. Divided Government in the States: A By-Product of Legislative
Follow the Money. 2002. www.followthemoney.org.
Foster, Douglas. 1994. The Lame-Duck State. State Legislatures 20:32-38.
Francis, Wayne L., and Lawrence W. Kenny. 1997. Equilibrium Projections of the Con-sequences of Term Limits upon Expected Tenure, Institutional Turnover, and
Membership Experience. Journal of Politics 59:240-252.
Franklin, D., and T. Westin. 1998. Predicting the Institutional Effects of Term Limits.
Public Choice 96:381-393.
Gilmour, John B., and Paul Rothstein. 1994. Term Limitation in a Dynamic Model of
Partisan Balance. American Journal of Political Science 38:770-796.
Gilmour, J.B., and P. Rothstein. 1996 A Dynamic Model of Loss, Retirement, and Tenure
in the House of Representatives. Journal of Politics 58:54-68.
Glazer, Amihai, and Martin Wattenberg. 1996. How Will Term Limits Affect Legislative
Work? In Legislative Term Limits: Public Choice Perspectives, ed. B. Grofman.
Boston: Kluwer.
Green, Jay P. 1995. Term Limits: A Measure of Our Ignorance. Social Science Quarterly
76:717-719.
Herrick, Rebekah, Michael K. Moore, and John R. Hibbing. 1994. Unfastening the Elec-toral Connection: The Behavior of U.S. Representatives When Reelection Is No
Longer a Factor. Journal of Politics 56: 214-227.
Hinich, Melvin J., and Michael C. Munger. 1997. Analytical Politics. Cambridge:
Cam-bridge University Press.
Lee, Kangoh. 2002. An Analysis of Welfare Effects of Legislative Term Limits. Public
Choice 110:245-260.
Lott, John R. Jr., and Stephen G. Bronars. 1993. Time Series Evidence on Shirking in the
U.S. House of Representatives. Public Choice 76:125-149.
Lowry, Robert C., James E. Alt, and Karen E. Ferree. 1998. Fiscal Policy Outcomes and
Electoral Accountability in American States. American Political Science Review
92:759-774.
Maestas, Cherie. 2000. Professional Legislatures and Ambitious Politicians: Policy
Responsiveness of State Institutions. Legislative Studies Quarterly 25:663-690.
Malbin, Michael J., and Gerald Benjamin. 1992. Legislatures after Term Limits. In
Limiting Legislative Terms, eds. G. Benjamin and M.J. Malbin. Washington, DC: Congressional Quarterly Press.
Moncrief, Gary F. 1999. Recruitment and Retention in U.S. Legislatures. Legislative
Studies Quarterly 24:173-208
National Conference of State Legislatures. 2003. http://www.ncsl.org/programs/legman/ about/termlimit.htm.
Nownes, Anthony J. 1992. Primaries, General Elections, and Voter Turnout: A
Multi-nomial Logit Model of the Decision to Vote. American Politics Quarterly
20:205-226.
Opheim, Cynthia. 1994. The Effect of U.S. State Legislative Term Limits Revisited.
Legislative Studies Quarterly 19:49-59.
Oppenheimer, Bruce I. 1995. House Term Limits: A Distorted Picture. Social Science
Quarterly 76:725-729.
Ordeshook, Peter. 1997. The Spatial Analysis of Elections and Committees: Four
Decades of Research. In Perspectives on Public Choice: A Handbook, ed. D.
Mueller. Cambridge: Cambridge University Press.
Petracca, Mark P. 1993. A New Defense of State-Imposed Congressional Limits. PS:
Powell, Richard J. 2000. The Impact of Term Limits on the Candidacy Decisions of State
Legislators in US House Elections. Legislative Studies Quarterly 25:645-661.
Project Vote Smart. 2002. http://www.vote-smart.org.
Reed, W. Robert, and D. Eric Schansberg. 1995. The House under Term Limits: What
Would It Look Like? Social Science Quarterly 76:699-716.
Reed, W. Robert, D. Eric Schansberg, J. Wilbanks, and Z. Zhen. 1998. The Relationship between Congressional Spending and Tenure with an Application to Term Limits.
Public Choice 94:85-104.
Rothenberg, Lawrence S., and Michael S. Sanders. 2000. Severing the Electoral
Connec-tion: Shirking in the Contemporary Congress. American Journal of Political
Sci-ence 44:316-325.
Squire, Peverill. 1998. Membership Turnover and the Efficient Processing of Legislation.
Legislative Studies Quarterly 23:23-32.
Squire, Peverill. 2000. Uncontested Seats in State Legislative Elections. Legislative
Stud-ies Quarterly 25:131-146.
State of Arkansas. 2002. http://www.accessarkansas.org.
State of California. 2002. http://www.sen.ca.gov; http://www.assembly.ca.gov.
State of Michigan. 2002. http://www.michiganlegislature.org; http://www.secretary-of-state.org/michigan.htm.
State of Missouri. 2002. http://www.state.mi.us; http://www.senate.state.mi.us.
Thompson, Joel A., and Gary F. Moncrief. 1993. The Implications of Term Limits for
Women and Minorities: Some Evidence from the States. Social Science Quarterly
74:300-309.
Tien, Charles. 2001. Representation, Voluntary Retirement, and Shirking in the Last
Term. Public Choice 106 97:117-130.
Will, George F. 1992. Restoration: Congress, Term Limits, and the Recovery of
Deliber-ative Democracy. New York, Free Press.
Zupan, Mark. 1990. The Last Term Problem in Politics: Do Congressional
Representa-tives Not Subject to a Reelection Constraint Alter Their Voting Behavior? Public