Educational & Social Considerations in Spouse Selection:
Preferences of People with and Without Special Needs
Dr. Muhammad Javed Aftab,
PhD Special Education, Department of Special Education, University of the Punjab, Lahore
Adeela Saqib,
M.Phil Special EducationSenior Special Education Teacher, Government of the Punjab, Lahore
Abstract: This research study intends to explore the educational and social considerations of spouse selection preferences of people with and without special needs. This study was quantitative in its nature and survey research design was used. The population of the study was the students from four universities in Lahore city. Sample of the study delimited to four Universities, University of the Sargodha Lahore Campus University of the Punjab, University of Lahore & University of the Gujarat Lahore campus Total 98 students were selected through convenient sampling. Researchers have used self-developed questionnaire for data collection. Researchers have personally collected the data. Descriptive and inferential statistical procedures were used to analyze the data. Findings of this study reveals that youngsters prefer to marry in the age of 21-25 years with the age difference of 4-6 years of their spouses. Educational considerations, personality traits and same religious background were the top preferred features of the spouse selection criteria. People with special needs prefer the spouse selection considering the above characteristics plus of disability of the same nature. People without special needs not prefer the spouse with disability. There is significant difference in the spouse selection preferences between the gender and disability status of the respondents. In Pakistan, there is no comprehensive study about the preferences in spouse selection of males and females so there is need to more work on broad level in terms of spouse selection preferences.
Keywords:Educational considerations, Social considerations, Spouse selection, Special needs people
I. Introduction
Society is the title of mutual contracts and this arise from the contracts of the two persons. When the two persons come to be in mutual contracts then the society formation starts. It then known as the sign of vigorous societies that they are all the time permitted for the freedom of choice to their spouse. This permission of free choice provided the strong social strengths to that specific society (Brown, 2009).
It is too much interesting to observe the individual specifically for their choice. Spouse selection is very important decision of each and every life in the every individual. Mate personal wellbeing and self-satisfaction are extremely affected by the qualities of one’s mate and life partner. Through marriage two individuals mutually bound to live together for the rest of their whole lives. Matrimonial relations are distinguished from any other kind of relationship in this world. Matrimonial relationship often widens our associations with the social world around us and enhances our emotional attachments with the spouse, family, and friends and with the siblings (Abdullah, 2011).
In Matrimonial relationship the couple confronts with many things and both have responsibilities to amicably manage the situations and made decisions and choices about reproduction with, choosing of, and continue their married life with spouse. The parameters of a good spouse are determined by their physical attributes and personal characteristics. The height, weight, face and body are the prime factors which help us in making judgment and selection of the spouse. With respect to males, economics status contributes. Matrimonial data shows that female preference towards the old age as compared to them. The reason begins this older spouse had enough time to assemble resources, and older spouse also have more dominant (Buss, 1989).
familial transmission of genetic and environmental risks for disease and on the maintenance and distribution of social behavior because assortative mating increases both the parent-offspring correlation and the population variance for any trait on which assortment is based (Eysenck, 1979; Jencks et al., 1972).
However, by far the largest spousal correlations are reported for variables that influence, or depend on, social behavior and organization, including educational attainment, religious behavior and political preference (Kalmijn, 1998; Martin et al., 1986). Raza & Hanif (1999) reported that Pakistan is the country of the people where the individuals have no fully permitted regarding the choice of the life partner due to the rigid behavior, caste, creed and the religious sector in Pakistan. This is the first ever study which is specifically designed to find out the preferences of the individuals regarding the selection of the life partner. The present study was conducted to see educational & social considerations in spouse selection preferences of normal and people with special needs.
Following were the objectives of the study: 1) to explore spouse selection preferences of normal people, 2) to explore spouse selection preferences of people with special needs, 3) To compare the spouse selection preferences between people with and without special needs, 4) to compare the spouse selection preferences between male and females and 5) to differentiate the spouse selection preferences between the people on the basis of academic qualification.
Following research questions were designed for this research study included 1) what are spouse selection preferences of normal people?, 2) what are spouse selection preferences of people with special needs?, 3) what are the comparison in spouse selection preferences between people with and without special needs?, 4) what are the comparisons in spouse selection preferences between male and females? And 5) what are the differences in spouse selection preferences on the basis of academic qualification?
II. Literature Review
Selection of the spouse never been compromised in the society and social state of matters in Pakistan. Most of the research studies mentioned that life partner selection much more imperative decision in the life of the individual. According of the different researcher’s life partner selection is not similar throughout the globe. It is varying from society to society, culture to culture and as per norm of the society. Health factors, educational factors, cultural factors, social factors, psychological factors, physical shape, body shape, genetic factors, religion, clothing style, occupation, beauty are usually the focuses for mate selection (Dodge, Lansford, & Price, 2003).
Spouse selection criteria and factors which, are affecting this process is not universal. Physical beauty is a very important factor for the mate selection, which is also not same throughout the globe. Low and affection of the individual is also important factor.
Abraham (2000) reported that in the ancient civilizations of the Africa plump and huge bodies are attractive in the north Europe. The notion of the physical beauty also changes with the passage of time. This composition of the impression of beauty of the life partner selection is different in different societies. Due to the different variation in the culture, caste, and ethnicity, dissimilar crowds have diverse norms and standards in this regards. But in thing is very important due to the latest advancement in the academic institutions some global norms have been developed among the literate youth whatever they caste, sector and language.
Whatsoever, we have deliberated so far was a prologue and precede to this title. That is to say, whom might we select as a life partner? With what kind of characteristics, individualities, criterions and principles, so that we may lead to a flourishing life with each other, and be the reason of one and another's comfort, improvement, and accomplishment? This is the actual stimulating and target of our communication and the discussion. All our detections in these titles and discussions is that the youth (girls and boys) may select as a spouses in a way to be identical, compatible and comparative to each other, and unadventurously dialogue they must go self-possessed well. If this condition is acquired and protected, and this co-ordination and stability is comprehended, then the other difficulties and matters are comfortably resolved. If they do not do blunder at this moment passage and crossing, then the next stages would be very comfortable.
We can say confidently and courageously that many of the problems which seem in the family life” are due to the information that the boy and the girl have made a blunder here and have not nominated a spouse well harmonized to themselves. Many spouses have been seen to be strapped into a state of depression and annihilation due to an disproportion and lack of homogeneousness. Most of the problems, disagreements, and engagements in the selection of the wrong spouse as per their preferences.
Basically, there are the two types of the specification, qualities, abilities and standards that should be encounter while selection of the spouse/mate.
(a) what are the fundamentals and pillars definitely required for a successful life.
(b) Those which are the conditions of attaining completion, and are necessary for the betterment and welfare of life and are mostly relevant and dependent upon the taste, style and the status of a person.
Belizaire & Fuertes (2011) mentioned that family relationships have a great impact on the matrimonial life and the selection of spouse preferably. To comprehend individuals of first-generation migrants, it is compulsory to realize them within their families. One can infer from the preceding factual analysis that first-generation immigrants are family oriented individuals. The Haitian immigrants in the United States reportedly rely on family support to survive the stressful experience they face in the host society). They are also very much attached to their culture, and tend to pass their cultural heritage, beliefs, and values onto their children born in the United States (Nicolas, 2009). Family relationships and second-generation immigrants.
Haller, Portes, and Lynch (2011) reported that as of 2008, there were 39.9 million foreign-born persons in the United States, which represented 13% of the population. Kasinitz (2008), based on a cross-sectional sample of both generation and comparable native minority persons found that, on average, second-generation youths are doing better, educationally and occupationally, than their minority counterparts and had advanced significantly ahead of their parents’ generation. In light of those studies, second-generation immigrants experience less stress adapting to the host culture, and are more likely to succeed than their first-generation counterparts.
Yoo and Kim (2010) conducted the different research studies related to the beliefs and attitudes among the second-generation migrants and their results discovered a relationship between blood relation who interested for their children and the children who later on provided social support to their aging parents.
This research study indicated a negative correlation between the second generation children and their parents. Yoo and Kim (2010) also discussed that relations provided societal maintenance meaningful that at some stage in their personal life development, they would obtain societal support. That’s why it is negative association between the children and their parents. Haitians wherever they are living, they have a similar cultural philosophies and family beliefs and they assume their adult children to take them into their houses.
Haneef, Khaliq and Fahad (2014) reported that Pakistan is the country of the people where the individuals have no fully permitted regarding the choice of the life partner due to the rigid behavior, caste, creed and the religious sectors in Pakistan. This is the first ever study which is specifically designed to find out the preferences of the individuals regarding the selection of the life partner.
III. Research Methodology
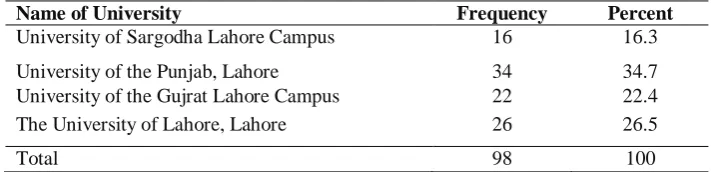
The study was aimed to analyze the spouse selection preferences of people with and without special needs. The main purpose of the study was to explore the educational and social considerations in spouse selection people with and without special needs. Therefore, descriptive research method was preferred as the investigation method for this study. The students with and without special needs studying in different departments in public universities of the Lahore city constitute the population of the research study. Researchers have purposively selected 98 students as the sample of the study. Out of these 98, fifty students without disabilities and forty-eight students with special needs from four well reputed universities of Lahore city namely University of Sargodha Lahore campus, University of Punjab Lahore, University of Gujrat Lahore campus & University of Lahore. The age range of the respondents were from 18 to 38 years. 71.4% respondents were between 22 to 25 years of age, 51% of the respondents were male and the 48% of the respondents were female, 19.4% of the respondents were bachelor degree, 67.3% of the respondents were master degree, 12.2% of the respondents were post graduate and the 1% of the respondents having the other academic qualification. 85.7% of the respondents were single, 6.1% of the respondents were engaged, 4.1% of the respondents were looking for mate and the 2% of the respondents were married in this study, 32.7% of the respondents were physically handicapped, and 17.3% of the respondents were visually impaired and the 50% of the respondents were without special needs.
Table 1. Sample distribution of the number of respondents from universities
Name of University Frequency Percent
University of Sargodha Lahore Campus 16 16.3
University of the Punjab, Lahore 34 34.7
University of the Gujrat Lahore Campus 22 22.4
The University of Lahore, Lahore 26 26.5
Instrumentation
Researchers have used self-made close ended questionnaire for the purpose of data collection. Researchers have divided it in three sections. First section is consisted on demographic information like name, age, gender, religion, profession, qualification, marital status, status of disability and institute etc. Second section comprises on five sub divisions as education, physical & mental health, financial prospects, society or social consideration and personality traits and these factors consisted on 45 factors of spouse selection. These factors were developed on four Likert scale 4 = indispensable, 3 = Important, but not, indispensable 2 = Desirable but not very important, 1 = Irrelevant unimportant. Third part was consisted on four questions with 2-point check list “yes” and “no”. The same questionnaire was used for all selected respondents.
Validation of the Research Tool
After finalizing the items and structure of questions in the questionnaire, It was sent to the experts of the field for its validation. Necessary modifications and adaptations were made in it.
Reliability of Research Instrument
Reliability analysis of the research instrument was found, with the Cronbach’s alpha whose value 0.79, this is above 0.7, and it indicates this research instrument has enough internal consistency reliability.
Data Collection
The researchers used the questionnaire as research tool to find out the educational and social consideration of spouse selection preferences of people with and without special needs. The researcher personally visited the sampled universities and collected the data through questionnaire from special and normal students of different departments from four universities in Lahore. Researchers themselves gave all the necessary instructions regarding the research topic and tool to respondents for fill up the questionnaire. Some respondents of different universities who are visually impaired was filled the questionnaires in soft form because they can easily read the content of tool through software’s which are used for blind people. The researchers send the questionnaire through e-mail; they filled with responses and send back to researchers.
Data Analysis
Data collected through questionnaire were first coded given by values to variables like most of the demographic information coded with value “1” and “2”. Second part of questionnaire scale coded according to given values 4 = indispensable, 3 = Important, but not indispensable 2 = Desirable but not very important, 1 = Irrelevant unimportant. Third part has four (04) questions with two points checklist “yes” and “no “and coded with “2” and “1”.
Data were entered in to the computer by using Statistical Package for Social Sciences (SPSS) and then analyzed. The study was designed to analyze the educational and social considerations in spouse selection preferences of normal and people with special needs. Two types of statistics descriptive and inferential were used to analyze the data. Frequency distribution of the responses was used to analyze the opinions of the respondents. Descriptive statistics was also used in terms of mean, standard deviation and range for the analysis of the opinion of the respondents. Independent sample t-test was used to find out the differences among the respondents on the basis of gender, employment status, educational background and age in the study.
Data Analysis, Interpretation and Findings
The study was designed to analyze the educational and social considerations in spouse selection preferences of normal and people with special needs. Two types of statistics descriptive and inferential were used to analyze the data. Frequency distribution of the responses was used to analyze the opinions of the respondents. Descriptive statistics was also used in terms of mean, standard deviation, and range for the analysis of the opinion of the respondents. Independent sample t-test was applied to find out the differences among the respondents on the basis of gender, employment status, educational background and age.
Table 2: Whom would you prefer to be older?
Marital Status Frequency Percent
Self 51 52
Spouse 47 48
Total 98 100
Table 3: At what you will prefer to be marry?
Age (Years) Frequency Percent
15-20 Years 4 4.1
21-25 Years 52 53.1
26-30Years 36 36.7
31-35 Years 6 6.1
Total 98 100
Table 3 shows that 4.1% of the respondents responded 15-20 years, 53.1% of the respondents responded 21-25 years, 36.7% of the respondents responded 26-30 years and the 6.1% of the respondents responded 31-35 years to the statement “at what age you will prefer to be married”.
Table 4: What age difference would you prefer between you and your spouse?
Years Frequency Percent
1-3 Years 43 43.9
4-6 Years 44 44.9
7-9 Years 7 7.1
10-12 Years 4 4.1
Total 98 100
Table 4 shows that 43.9% of the respondents responded to 1-3 years, 44.9% of the respondents responded 4-6 years, 7.1% of the respondents responded 7-9 years and 4.1% of the respondents responded 10-12years to the statement “what age difference would you prefer between you and your spouse”.
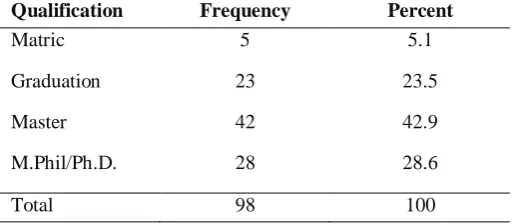
Table 5: What qualification would you prefer for your spouse?
Qualification Frequency Percent
Matric 5 5.1
Graduation 23 23.5
Master 42 42.9
M.Phil/Ph.D. 28 28.6
Total 98 100
Table 5 shows that 5.1% of the respondents responded matric, 23.5% of the respondents responded graduation, 42.9% of the respondents responded master degree, 28.6% of the respondents responded M.Phil. /PhD.
Table 6: Educational Considerations for spouse selection
Sr. No. Item Indispensable f (%) Important f (%) Desirable f (%) Irrelevant f (%) Total f (%)
Overall
Educational Considerations for spouse selection
37(38.27%) 33(34%) 20(20.2%) 8(7.46%) 98(100%)
2 Similar Educational
background 27(27.6%) 32(32.7%) 30(30.6%) 10(9.2%) 98(100%)
3 Same profession 25(25.5%) 15(15.3%) 37(37.7%) 21(21.4%) 98(100%)
4 Intelligent 50(51%) 34(34.7%) 12(12.2%) 2(2%) 98(100%)
5 Well aware about
educational prospects 31(31.6%) 40(40.9%) 23(23.5%) 4(4.1%) 98(100%)
6
Well aware about information
technology ( Cell, pc, social media)
33(33.7%) 46(46.9%) 12(12.2%) 7(7.1%) 98(100%)
Table 6 describes that 38.27% of the respondents responded indispensable, 34% responded important, 20.2% responded desirable and 7.46% responded irrelevant to the educational characteristics of spouse. Above table also shows that60.2% of the respondents responded indispensable to the statement “educated”, 32.7% of the respondents responded important to the statement “similar educational background”, 37.7% of the respondents responded desirable to the statement “same profession”, 51% of the respondents responded indispensable to the statement “intelligent”, 40.9 % of the respondents responded important to the statement “well aware about educational prospects”, and 46.9% of the respondents responded important to the statement “well aware about information technology (cell, PC)”.
Table 7: Physical & Mental Health
Sr. No. Item Indispensable f(%)
Important f(%)
Desirable f(%)
Irrelevant f(%)
Total f(%)
Overall
Physical & Mental Health
34(34.6%) 43(44%) 17(17.6%) 4(4%) 98(100%)
1 Good
looking 42(42.9%) 44(44.9%) 10(10.2%) 2(2%) 98(100%)
2 Physically
attractive 37(37.8%) 45(45.9%) 15(15.3%) 1(1%) 98(100%)
3 Groom
personality 38(38.8%) 48(49%) 12(12.2%) 0(0%) 98(100%)
4 Good
heredity 31(31.6%) 43(43.8%) 20(20.4%) 4(4.1%) 98(100%)
5 Heighted 27(27.6%) 42(42.9%) 20(20.4%) 9(9.2%) 98(100%)
6 Faire color 23(23.5%) 45(45.9%) 24(24.5%) 6(6.1%) 98(100%)
7 Emotional
stability 38(38.8%) 36(36.7%) 20(20.4%) 4(4.1%) 98(100%)
Table 7 shows that 34.6% of the respondents responded indispensable, 44% responded important, 17.6% responded desirable, and 4% responded irrelevant to the physical and mental health characteristics of the spouse. Above table also shows that 44.9% of the respondents responded important to the statement “good looking”, 45.9% of the respondents responded important to the statement “physically attractive”, 49% of the respondents responded important to the statement “groom personality”, 43.8% of the respondents responded important to the statement “good heredity”, 42.9% of the respondents responded important to the statement “heighted”, 45.9% of the respondents responded important to the statement “fair color” and 38.8% of the respondents responded indispensable to the statement “emotional stability”.
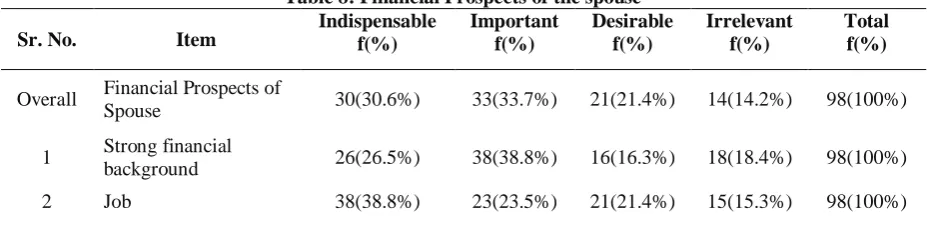
Table 8: Financial Prospects of the spouse
Sr. No. Item Indispensable f(%) Important f(%) Desirable f(%) Irrelevant f(%) Total f(%)
Overall Financial Prospects of
Spouse 30(30.6%) 33(33.7%) 21(21.4%) 14(14.2%) 98(100%)
1 Strong financial
background 26(26.5%) 38(38.8%) 16(16.3%) 18(18.4%) 98(100%)
3 Own business 19(19.3%) 33(33.7%) 26(26.5%) 20(20.4%) 98(100%)
4 Similar social status 23(23.5%) 32(32.7%) 27(27.6%) 16(16.3%) 98(100%)
5 Ambitious
( motivated) 29(29.6%) 36(36.7%) 27(27.6%) 6(6.1%) 98(100%)
6 Industrious
(hardworking) 45(45.9%) 35(35.7%) 11(11.2%) 7(7.1%) 98(100%)
Table 8 shows that 30.6% of the respondents responded indispensable, 33.7% responded important, 21.4% responded desirable, and 14.2% responded irrelevant to the financial prospects of the spouse. Above table also shows that 38.8% of the respondents responded important to the statement “strong financial background”, 38.8% of the respondents responded indispensable to the statement “job”, 33.7% of the respondents responded important to the statement “own business”, 32.7% of the respondents responded important to the statement “similar social status”, 36.7% of the respondents responded important to the statement “ambitious (motivated)” and 45.9% of the respondents responded indispensable to the statement “industrious (hardworking).
Table 9: Society or Social Considerations
Sr. No. Item Indispensable f(%)
Important f(%)
Desirable f(%)
Irrelevant f(%)
Total f(%)
Overall Society or Social
Considerations 32(32.2%) 20(20.3%) 19(19.2%) 27(27.5%) 98(100%)
1 Similar religious
background 62(63.2%) 22(22.4%) 7(7.1%) 7(7.1%) 98(100%)
2 Similar political
background 23(23.4%) 15(15.3%) 29(29.6%) 31(31.6%) 98(100%)
3 Same area 19(19.4%) 15(15.3%) 29(29.6%) 35(35.7%) 98(100%)
4 Same city 18(18.4%) 18(18.4%) 25(25.5%) 37(37.8%) 98(100%)
5 Same sector 22(22.4%) 11(11.2%) 27(27.6%) 38(38.8%) 98(100%)
6 Same cast 32(32.6%) 19(19.4%) 11(11.2%) 36(36.7%) 98(100%)
7 Same country 29(29.6%) 23(23.5%) 23(23.5%) 23(23.5%) 98(100%)
8 Similar cultural
background 33(33.7%) 38(38.8%) 15(15.3%) 12(12.2%) 98(100%)
9 Noble family 55(56.1%) 29(29.6%) 4(4.1%) 10(10.2%) 98(100%)
Table 9 shows that 32.2% of the respondents responded indispensable, 20.3% responded important, 19.2% responded desirable, and 27.5% responded irrelevant to the society and social consideration for the selection of the spouse. Above table also shows that 63.2% of the respondents responded indispensable to the statement “similar religious background”, 31.6% of the respondents responded irrelevant to the statement “similar political background”, 35.7% of the respondents responded irrelevant to the statement “same area”, 37.8% of the respondents responded irrelevant to the statement “same city”, 38.8% of the respondents responded irrelevant to the statement “same sector”, 29.6% of the respondents responded indispensable to “same country”, 38.8% of the respondents responded important to the statement “similar cultural background” and 56.1% of the respondents responded indispensable to the statement “noble family”.
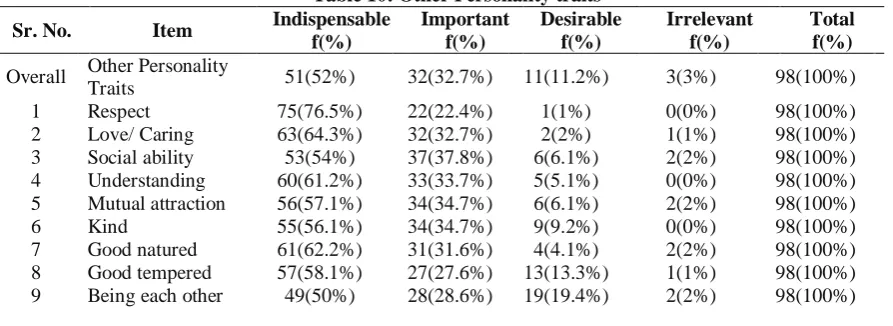
Table 10: Other Personality traits
Sr. No. Item Indispensable f(%)
Important f(%)
Desirable f(%)
Irrelevant f(%)
Total f(%)
Overall Other Personality
Traits 51(52%) 32(32.7%) 11(11.2%) 3(3%) 98(100%)
1 Respect 75(76.5%) 22(22.4%) 1(1%) 0(0%) 98(100%)
2 Love/ Caring 63(64.3%) 32(32.7%) 2(2%) 1(1%) 98(100%)
3 Social ability 53(54%) 37(37.8%) 6(6.1%) 2(2%) 98(100%)
4 Understanding 60(61.2%) 33(33.7%) 5(5.1%) 0(0%) 98(100%)
5 Mutual attraction 56(57.1%) 34(34.7%) 6(6.1%) 2(2%) 98(100%)
6 Kind 55(56.1%) 34(34.7%) 9(9.2%) 0(0%) 98(100%)
7 Good natured 61(62.2%) 31(31.6%) 4(4.1%) 2(2%) 98(100%)
8 Good tempered 57(58.1%) 27(27.6%) 13(13.3%) 1(1%) 98(100%)
match
10 Trustworthy 63(64.3%) 29(29.6%) 5(5.1%) 1(1%) 98(100%)
11 Handsome 38(38.8%) 44(44.9%) 14(14.3%) 2(2%) 98(100%)
12 Neatness 48(49%) 38(38.8%) 7(7.1%) 5(5.1%) 98(100%)
13 Good cook 35(35.7%) 23(23.5%) 29(29.6%) 11(11.2%) 98(100%)
14 Easygoing 35(35.7%) 39(39.8%) 19(19.4%) 5(5.1%) 98(100%)
15 Creative & artistic 34(34.7%) 26(26.5%) 28(28.6%) 10(10.2%) 98(100%)
16 Good
housekeeper 37(37.8%) 32(32.7%) 18(18.4%) 10(10.2%) 98(100%)
17 Desire for home
& children 56(57.1%) 30(30.6%) 10(10.2%) 2(2%) 98(100%)
Table 10 shows that 52% of the respondents responded indispensable, 32.7% responded important, 11.2% responded desirable and 3% responded to the general preferences for the selection of the spouse. Above table also shows that 76.5% of the respondents responded indispensable to the statement “respect”, 64.3% of the respondents responded indispensable to the statement “love/caring”, 54% of the respondents responded indispensable to the statement “social ability”, 60.1% of the respondents responded indispensable to the statement “understanding”, 57.1% of the respondents responded indispensable to the statement “mutual attraction”, 56.7% of the respondents responded indispensable to the statement “kind”, 62% of the respondents responded indispensable to the statement “good natured”, 58.1% of the respondents responded indispensable to the statement “good tempered being each other” and 64.3% of the respondents responded indispensable to the statement “trustworthy”. Table 4.20 shows that 44.9% of the respondents responded important to the statement “handsome”, 49% of the respondents responded indispensable to the statement “neatness”, 35.7% of the respondents responded indispensable to the statement “good cook”, 35.7% of the respondents responded indispensable to the statement “easy going”, 34.7% of the respondents responded indispensable to the statement “creative & artistic”, 37.8% of the respondents responded indispensable to the statement “good housekeeper” and 57.1% of the respondents responded indispensable to the statement “desire for home and children”.
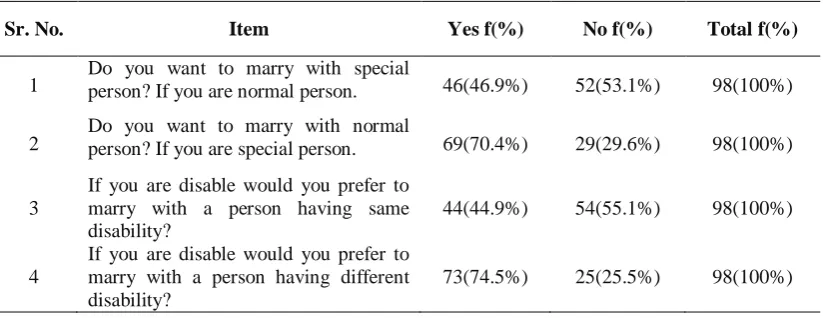
Table 11: Frequency distribution of the responses Part III
Sr. No. Item Yes f(%) No f(%) Total f(%)
1 Do you want to marry with special person? If you are normal person. 46(46.9%) 52(53.1%) 98(100%)
2 Do you want to marry with normal person? If you are special person. 69(70.4%) 29(29.6%) 98(100%)
3
If you are disable would you prefer to marry with a person having same disability?
44(44.9%) 54(55.1%) 98(100%)
4
If you are disable would you prefer to marry with a person having different disability?
73(74.5%) 25(25.5%) 98(100%)
Table 11 shows that 53.1% of the respondents responded negative to the statement “do you want to marry with special person? If you are normal person”, 70.4% of the respondents responded yes to the statement “do you want to marry with normal person? If you are special person”, 55.1% of the respondents responded no to the statement “if you are disable would you prefer to marry with a person having same disability”, and 74.5% of the respondents responded yes to the statement “if you are disable would you prefer to marry with a person having different disability”.
Table 12: Descriptive analysis of the responses in respect of educational Considerations
Sr. No. Item N Mean (M) S.D Range
1 Educated 98 3.53 .645 3
2 Similar Educational
background 98 2.80 .943 3
3 Same profession 98 2.46 1.10 3
4 Intelligent 98 3.31 .78 3
educational prospects
6
Well aware about information technology ( Cell, pc, social media)
98 3.06 .864 3
Table 12 shows that mean for the educated, similar education background, same profession, intelligent, well aware about educational prospects, and well aware about the information technology was 3.53, 2.80, 2.46, 3.31, 3 and 3.05 respectively. Above table also shows that standard deviation for the educated, similar education background, same profession, intelligent, well aware about educational prospects, and well aware about the information technology was 0.645, 0.943, 1.10, 78, 0.863 and 0s.864 respectively.
Table 13: Descriptive analysis of the responses Physical & Mental Health
Sr. No. Item N Mean (M) S.D Range
1 Good looking 98 3.29 0.732 3
2 Physically
attractive 98 3.17 .0728 3
3 Groom
personality 98 3.27 0.670 2
4 Good
heredity 98 3.03 0.839 3
5 Heighted 98 2.89 0.918 3
6 Faire color 98 2.87 0.845 3
7 Emotional
stability 98 3.09 0.867 3
Table 13 shows that the mean for good looking, physically attractive, groom personality, good heredity, heighted, faire color and emotional stability was 3.29, 3.17, 3.27, 3.03, 2.89, 2.87 and 3.09 respectively. Above table also shows that the standard deviation for good looking, physically attractive, groom personality, good heredity, heighted, faire color and emotional stability was 0.732, 0.728, 0.670, 0.839, 0.918, 0.845 and 0.867 respectively.
Table 14: Descriptive analysis of the responses Financial Prospects
Sr. No. Item N Mean (M) S.D Range
1 Strong financial background 98 2.73 1.056 3
2 Job 98 2.87 1.105 3
3 Own business 98 2.49 1.016 3
4 Similar social status 98 2.59 1.005 3
5 Ambitious
( motivated) 98 2.89 0.900 3
6 Industrious (hardworking) 98 3.20 0.909 3
Table 14 shows that the mean for strong financial background, job, own business similar social status, ambitious (motivated), and industrious (hardworking) was 2.73, 2.87, 2.49, 2.59, 2.89 and 3.20 respectively. Above table also shows that the standard deviation for strong financial background, job, own business similar social status, ambitious(motivated), and industrious (hardworking) was 1.056, 1.105, 1.016, 1.005, 0.900 and 0.909 respectively.
Table 15: Descriptive analysis of the responses Society or Social Considerations
Sr. No. Item N Mean (M) S.D Range
1 Similar religious
background 98 3.41 0.913 3
2 Similar political
background 98 2.24 1.138 3
3 Same area 98 2.16 1.15 3
5 Same sector 98 2.14 1.15 3
6 Same cast 98 2.45 1.28 3
7 Same country 98 2.56 1.14 3
8 Similar cultural
background 98 2.94 0.993 3
9 Noble family 98 3.32 0.959 3
Table 15 shows that the mean for similar religious background, similar political background, same area, same city, same sector, same cast, same country, similar cultural background, and noble family was 3.41, 2.24, 2.16, 2.17, 2.14, 2.45, 2.56, 2.94, and 3.32 respectively. Above table also shows that the standard deviation for similar religious background, similar political background, same area, same city, same sector, same cast, same country, similar cultural background, and noble family was 0.913, 1.138, 1.15, 1.13, 1.28, 1.14, 0.993 and 0.959 respectively.
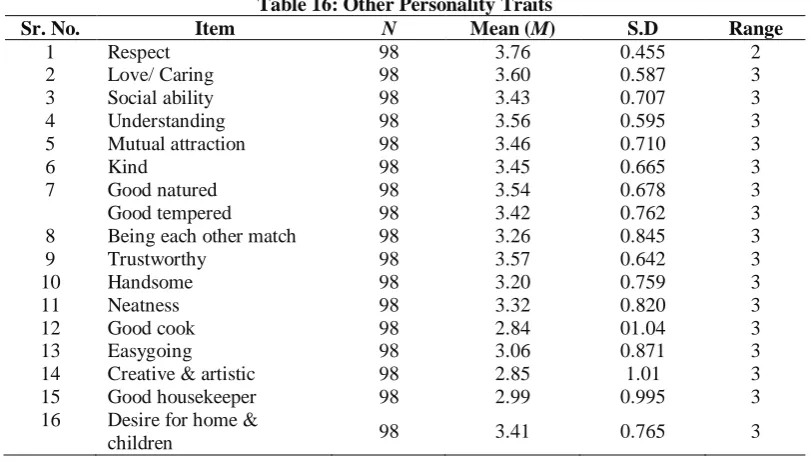
Table 16: Other Personality Traits
Sr. No. Item N Mean (M) S.D Range
1 Respect 98 3.76 0.455 2
2 Love/ Caring 98 3.60 0.587 3
3 Social ability 98 3.43 0.707 3
4 Understanding 98 3.56 0.595 3
5 Mutual attraction 98 3.46 0.710 3
6 Kind 98 3.45 0.665 3
7 Good natured 98 3.54 0.678 3
Good tempered 98 3.42 0.762 3
8 Being each other match 98 3.26 0.845 3
9 Trustworthy 98 3.57 0.642 3
10 Handsome 98 3.20 0.759 3
11 Neatness 98 3.32 0.820 3
12 Good cook 98 2.84 01.04 3
13 Easygoing 98 3.06 0.871 3
14 Creative & artistic 98 2.85 1.01 3
15 Good housekeeper 98 2.99 0.995 3
16 Desire for home &
children 98 3.41 0.765 3
Table 16 shows that the mean for respect, love/ caring, social ability, understanding, mutual attraction, kind, good natured, good tempered, being each other match, trustworthy, handsome, neatness, good cook, easygoing, creative & artistic, good housekeeper and desire for home & children was 3.76, 3.60, 3.43, 3.56, 3.46, 3.45, 3.54, 3.42, 3.26, 3.57, 3.20, 3.32, 2.84, 3.06, 2.85, 2.99, and 3.41 respectively. Above table also shows that the standard deviation for respect, love/ caring, social ability, understanding, mutual attraction, kind, good natured, good tempered, being each other match, trustworthy, handsome, neatness, good cook, easygoing, creative & artistic, good housekeeper and desire for home & children was0.455, 0.587, 0.707, 0.595, 0.710, 0.665, 0.678, 0.762, 0.845, 0.642, .759, .820, 1.04, 0.871, 1.01, 0.995 and.765 respectively.
Table 17: Frequency distribution of the responses
Sr. No. Item N Mean (M) S.D Range
1 Do you want to marry with special person? If you are normal person. 98 1.51 .503 1
2 Do you want to marry with normal person? If you are special person. 98 1.32 .470 1
3 If you are disable would you prefer to marry with a person having same disability? 98 1.51 .503 1
Table 17 shows that mean for do you want to marry with special person? if you are normal person, do you want to marry with normal person? if you are special person, if you are disable would you prefer to marry with a person having same disability and if you are disable would you prefer to marry with a person having different disability was 1.51, 1.32, 1.51, and 1.72 respectively. Above table also shows that the standard deviation for do you want to marry with special person? if you are normal person, do you want to marry with normal person? if you are special person, if you are disable would you prefer to marry with a person having same disability you are disable would you prefer to marry with a person having different disability was 0.503, 0.470, 0.503 and 0.454 respectively.
Table 18: Comparison of selection of the respondents towards the spouse selection on the basis of gender
Gender N M df t Sig
Male 51 153.58 96 2.43 0.017
Female 47 143.44 95.32
*P < .05 Level of Significance
Table 18 shows that there is a significant difference in the spouse selection criteria on the basis of gender. It can be concluded that the male respondents are more conscious in the selection of spouse.
Table 19: Comparison of selection of the respondents towards the spouse selection on the basis of status of the respondents
Gender N M df t Sig
Student 94 21.15 96 0.189 0.850
Employee 4 24.89 3.19 0.163
*P <0 .05 Level of Significance
Table 19 shows that there is no significant difference in the spouse selection criteria on the basis of the status of the respondents. It can be concluded that there is no difference in the selection of spouse whatever the status they are recently.
Table 20: Comparison of selection of the respondents towards the spouse selection on the basis of Academic Qualification
Gender N M df t Sig
Bachelor 19 156 83 1.65 0.103
Post Graduate 66 147.48 31.58 1.74
*P <0.05 Level of Significance
Table 20 shows that there is no significant difference in the spouse selection criteria on the basis of academic qualification of the respondents. The results show that people with different qualifications have same preferences for spouse selection.
Table 21: Comparison of selection of the respondents towards the spouse selection on the basis of age of the respondents
Gender N M df t Sig
15-30 15 151.86 83 0.661 0.511
30 and above 70 148.05 23.58 0.745
*P <0 .05 Level of Significance
Table 22: Comparison of selection of the respondents towards the spouse selection on the basis of disability status of the respondents
Gender N M df t Sig
Normal 49 144.24 s96 -2.132 0.036
With Special Needs 49 153.20 84 -2.132
*P <0 .05 Level of Significance
Table 22 shows that there is significant difference in the spouse selection preferences on the basis of disability status the respondents. The results show that considerations of males and females are different from each other for their spouses.
Conclusions
Following conclusions were drawn on the basis of findings:
The purpose of this study was to examine the educational and social considerations of spouse selection preferences of students with and without special needs. Findings of this study reveals that youngster prefer to marry in the age of 21-25 years with the age difference of 4-6 years of its spouse. This study concluded that academic qualification, similar educational background, same profession, well awarded about educational prospectus and level of intelligence was the preferred ingredient of the spouse Selection criteria.
Good looking, groom personality, physically attractive, good heredity, heighted, fair color and the emotional stability was the top preferred features of the spouse selection criteria. Financial prospects were considered very important in the selection of life partners in terms of strong financial background, job, own business, ambitious (motivated), industrious. Social and religious components of the process of selection of the life partner had much more important for the youngsters in the form of similar religious background, similar political background, same area, same city, same country, same sector, similar cultural background and noble family. Personality traits consideration had much more important for the youngster like respect, love caring, social ability, understanding, mutual attraction, kind, good natured, trust worthy, handsome, neatness, creative & artistic and desire for home and children.
People with special needs prefer the spouse selection considering the above characteristics plus of disability of the same nature. Normal people not prefer the spouse with the disability. There is significant difference in the spouse selection preferences between the gender and disability status of the respondents. Male are more conscious regarding the selection of the life partner as compared to the female whereas, on the other hand people with special needs more conscious because of their disability so that the compatibility can be make sure in the type of disability. There is no significant difference in the spouse selection preferences due to the difference in academic qualification, difference in age and the status of the people.
Recommendations
Following recommendations were drawn on the basis of conclusions:
1. This study reveals that there should not be any specific criteria for spouse selection. The special persons should not be degraded in this regard by considering them a living human they should be preferred as normal ones are.
2. Academic qualification, similar educational background should be considered important but is should be biasness free and ethical level of morality in consideration of spouse selection in the case of special need persons.
3. During the selection of the life partner youngster should have to make sure enough all the potentials before made the final decision rather than just looking the high socio-economic status and the apparent beauty either special of normal ones.
4. People who are providing the services in this area like marriage bureau workers (spouse selection) please they should have to follow these important ethical considerations preferences during the selection of spouse either in the case of special persona or normal one.
5. Curriculum developer should include the curriculum about this aspect of spouse selection either special person or normal at college and university level and should also include the hidden curriculum about spouse selection considering important aspects of morality.
REFRENCES
[1.] Abdullah H.S., Li L.P., David A.P.V., Gender differences in mate selection criteria among Malaysian
undergraduate students, SARJANA, 26(2), 33-50, 2011.
[2.] Abraham, R. (2000). The role of job controls as a moderator of emotional dissonance and emotional intelligence outcome relationships. The Journal of Psychology, 134 (2), 169-184.
[3.] Ackerman, P. L. (2009). Personality and intelligence. In P. J. Corr & G. Matthews (Eds.), The Cambridge handbook of personality psychology (pp. 162-174).New York: Cambridge University Press.
[4.] Aprillia, K., & Ritandiyono. (2007). Relationship between the emotional intelligence and aggressive behavior in adolescent. Gunadarma University.
[5.] Arbuckle, J. L. (2006). Amos 7.0 User's Guide. Chicago: SPSS Bailey, K. D. (1987). Methods of social research. New York: Free Press.
[6.] Bastiaens, L. J. (2006). Youth aggression: Economic impact, causes, prevention, and treatment. Retrieved from http://www.psychiatrictimes.com/articles/youth- aggression-economic- impact-causes-prevention-and-treatment
[7.] Barry, T. D. (2004). Aggression in adolescents: Strategies for parents and educators. Retrieved from http://www.nasponline.org/resources/principals/nasp_aggression.pdf
[8.] Bierman, A., Fazio, E. M., & Milkie, M. A. (2006). A multifaceted approach to the mental health advantage of the married: Assessing how explanations vary by outcome measure and unmarried group. Journal of
Family Issues, 27, 554- 582.
[9.] Blair, J., Mitchell, D., & Blair, K. (2005). The psychopath: Emotion and the brain. Oxford, UK: Blackwell.
[10.] Blow, A. J., & Hartnett, K. (2005). Infidelity in committed relationships II: A substantive review. Journal of Marital and Family Therapy, 31(2), 233–277.
[11.] Bradbury, T. N., Fincham, F. D., & Beach, S. R. H. (2000). Research on the nature and determinants of marital satisfaction: A decade in review. Journal of Marriage and the Family, 62(4), 964–980.
[12.] Brown, The Marriage Problem: How to Choose? Parabola, 45(2), 2009.
[13.] Borgerhoff Mulder, M. (1987). On cultural and reproductive success: Kipsigis evidence. American Anthropologist, 88, 617–634.
[14.] Buss, D.M. (1989). Sex differences in human mate preferences: Evolutionary hypotheses tested in 37 cultures. Behavioral and Brain Sciences, 12, 1-49.
[15.] Buss, D. (2013). Mate Preferences Questionnaire. Measurement Instrument Database for the Social
[16.] Canabal, M. E. (1990). An economic approach to marital dissolution in Puerto Rico. Journal of Marriage and the Family, 52, 515-530.
[17.] Capaldi, D. M., & Patterson, G. R. (1994). Interrelated influences of contextual factors on antisocial
behavior in childhood and adolescence for males. New York: Springer Publishing Company
[18.] Choi, S. (2010). The effects of fatherhood experiences on men's psychological wellbeing. Dissertation Abstracts International Section A, 71.
[19.] Ciarrochi, J, 2001. Measuring emotional intelligence in adolescents. Personality and Individual Differences, 7, 1105-1119.
[20.] DeNeve, K.M., & Cooper, H. (1998). The happy personality: A meta-analysis of 137 personality traits and subjective well-being. Psychological Bulletin, 124, 197– 229.
[21.] Craig, I. W. (2007). The importance of stress and genetic variation in human aggression. Retrieved from http://www.bioforensics.com/conference07/DNA_and_behavior/Aggression_Review.pdf
[23.] Cornwell, R.E., &Perrett, D.I. (2008). Sexy sons and sexy daughters: the influence of parents’ facial
characteristics on offspring. Behavior.76, 1843–1853.
[24.] Cronk, L. (1991). Wealth, status and reproductive success among the Mukogodo. American Anthropologist, 93, 345–360.
[25.] Csatho, A., Bereczkei, T. (2003). Effect of males' status and facial attractiveness on direct childcare. Journal of Cultural and Evolutionary Psychology, 1(2), 123-130.
[26.] Daly, M., & Wilson, M. (1991). A reply to Gelles: Stepchildren are disproportionately abused, and diverse forms of violence can share causal factors. Human Nature, 2, 419-426.
[27.] Eysenck HJ. (1979). The structure and measurement of intelligence. New York: Springer-Verlag.
[28.] Agrawal A, Heath AC, Grant JD, Pergadia ML, Statham DJ, Bucholz KK, Martin NG, Madden PAF. (2006). Assortative mating for cigarette smoking and alcohol consumption in female Australian twins and their spouses. Behav Genet 36: 553-566.
[29.] Eaves LJ, Heath AC, Martin NG, Maes HH, Neale MC, Kendler KS, Kirk KM, Corey LA. (1999).