http://www.sciencepublishinggroup.com/j/hss doi: 10.11648/j.hss.20180601.13
ISSN: 2330-8176 (Print); ISSN: 2330-8184 (Online)
Study on Population Structure Change and Policy
Development Based on Leslie Model
Wang Ping, Wang Jing
*School of Management, Xi’an University of Science and Technology, Xi’an, China
Email address:
*
Corresponding author
To cite this article:
Wang Ping, Wang Jing. Study on Population Structure Change and Policy Development Based on Leslie Model. Humanities and Social Sciences. Vol. 6, No. 1, 2018, pp. 12-18. doi: 10.11648/j.hss.20180601.13
Received: January 16, 2018; Accepted: January 31, 2018; Published: March 22, 2018
Abstract:
With the overall-two-child policy been fully opened, as the important influence factor of economic development and social life, population structure is more worthy of study. In order to get the more intuitive result of the policy for relief the China's ageing population, this paper uses the Leslie model to predict the future population and the age structure change. Based on census data of Henan province, this paper divided the people's fertility wishes into high, medium and low, proposed four kinds of fertility strategies, and qualitative analysis the total fertility rate and birth population sex ratio of three different fertility wishes. Firstly, this paper predicts the total population size and the age structure under different fertility strategies during 2011-2050. Secondly, based on the total population, the elderly population coefficient and the total population dependency ratio, this paper analyzed the optimal fertility strategy under different fertility wishes. Finally, the conclusion is as follows, when the fertility wishes is low, medium and high respectively, the fertility strategies should be chosen as IV, III and II respectively, that is to say, in the early period, a woman had less than two children and later each woman had 2.1 children, which fully accords with the concept of population sustainable development.Keywords:
Population Structure, Population Policy, Leslie Model, Elderly Population Coefficient1. Introduction
As a large population country, China's population characteristics mainly include large population base, low cultural quality, accelerated aging process, high sex ratio at birth, and low urbanization rate. [1] Therefore, the population issue has drawn great attention, and it is mainly reflected in the demographic structure and population policies. In order to solve the population problem in our country, the party and government have formulated a series of population policies. In the 1980s, in order to control the population growth strictly, China began to implement the Family Planning policy. [2]In this context, the birth rate of our country dropped from 35.54 ‰ in 1970 to 11.52 ‰ in 2010; the natural growth rate dropped from 27.93 ‰ in 1970 to 4.95 ‰ in 2010. [3] Under the background of a large population base in our country, this policy has effectively contained the problem of excessive population growth. However, due to the first drop in the total labor force
population in China in 2012 and the problem of aging in recent years, the party and the government have formulated the policy of "Two Children Alone" and have developed into a policy of "Full Two Children."[4]
reach 24.89% and the recuperation ratio of the elderly will reach about 40%in 2050; and some measures which against population aging are also proposed. [8] The above models only predict the total population, but can’t directly, comprehensively and systematically analyze the age structure of the population in the future, and there are still problems such as being monotonous, inflexible and having a limited scope of application. These purely theoretical models which are not related to reality closely can’t adapt to changes in population policies because their model parameters are not easy to adjust. Therefore, it is very necessary to establish a targeted and practical population prediction model.
Because the Leslie model is based on the matrix, it can be predicted and analyzed from the perspective of demographic structure such as age, gender and urban-rural differences, and the model parameters can be flexibly adjusted with the change of policies. Based on Leslie's population structure change model, this paper focuses on the advantages and disadvantages of the four kinds of birth-control policies under the three kinds of fertility aspirations, taking the population of Henan Province as an example. And concluded that when the fertility will be low, medium and high, the strategy should be selected four, three, two. In other words, considering the sustainable development of the population in the present period, the implementation of the Second Child Birth policy is ideal, which is consistent with the result obtained by Meng Lingguo by PDE model.
2. Methods Introduction
The Leslie model is a discrete population projection matrix model which based on age and sex. This model was first proposed by Leslie, an Australian scholar in 1945. It predicts the change of the total population, at the same time, it reflects the change of the population age structure and gender structure. [9]The Leslie model represents a new level of innovation in population projections relative to the Malthusian and logistic models, which only predict a change in the population.
2.1. Explanation of Related Parameters
(1) Age-specific fertility rate (ASFR):
It reflects the fertility levels of women of childbearing age in all age groups and is the ratio of the number of children born to women of childbearing age to the total population of women of childbearing age in the corresponding age group during a given period of time. [10]
(2) Total fertility rate (TFR):
It is an indicator of the fertility rate adjusted by age and sex, which is the sum of the age-specific fertility rates of all women of child-bearing age for a given period of time. When the statistical time length is one year and the age group is 5 years old, the total fertility rate is equal to the product of the sum of the age-specific fertility rate and the group distance. [11]
(3) Age-specific death rate (ASDR):
It refers to the average mortality rate per 1,000 people of a
certain age or age group over a given period of time. [12]
2.2. Leslie Model Theory
The Leslie model first Discrepancy of population age and study time respectively. In the meantime, the distribution vector of female population by age group is
1 2
( ) [ ( ), ( ),..., ( )]m
x t = x t x t x t ; the age-specific fertility rate in the first age group is b ti( ); the death rate of this age group is
1
( ) i
d t , the corresponding survival rate is s ti( )1= −1 d ti( )1 (the last one in the subscript: 1 for women, 2 for men.).[13] In a stable environment, fertility and mortality generally do not change over time, but as this paper analyzes the demographic structure that varies with the birth policy and fertility, the age-specific fertility of this article varies with time change. Usually, b ti( )1 and d ti( ) all can be obtained directly from the sources of statistics, and have the following properties:
0, 1, 2,3.. i
b ≥ i= and at least one bi>0 ; 0< ≤si 1,i=1, 2, 3.... The Leslie population prediction model discussed in this paper joins the sex ratio at birth. Correspondingly, the proportion of female newborns born in t year is ( )w t , then the proportion of male newborns born in the
t
year is 1- ( )w t . [14]The changing law of the female populationx ti( )is obtained from two basic relations:
the
number of female population in the first age group in period t+1 is the sum of the number of childbearing women of childbearing age in each age group; the number of female population in age group i+1 for period1
t+ is equal to the number of population surviving in age
group. [15]This shows that, the number of female population in the first year of age group t+1 is:
1 1
1
( 1) ( ) ( ) ( ) m
i i
i
x t b t w t x t
= + =
∑
And the number of women in the i age group of the t year is:
...
2
,
1
,
0
;
1
...
2
,
1
,
0
)...
(
)
(
)
1
(
11
+
=
=
−
=
+
t
s
t
x
t
i
m
t
x
i i iThus we obtain the Leslie matrix of women: the Leslie matrix consisting of the birth ratebi
,
the proportion of womenin the newborn wand the female's survival rate si is
:
= − − 0 ... 0 0 ... ... ... ... ... 0 0 ... 0 0 0 ... 0 ... 1 2 1 1 2 1 m m m s s s wb wb wb wb L
The t+1 year's female population can be reduced to ( 1) ( )
of female population in t+1 year can be predicted to be:
...
2
,
1
),
0
(
)
(
t
=
L
x
t
=
x
tThen, this paper calculate the number of men of all ages, the 1
t+ year of the first age group male population
∑
= − = + m i i i t wt y tb t
y
1 2
1( 1) ( ) (1 ()) ()
The t+1 year of the i age group male population
.... 2 , 1 , 0 ; 1 ... 2 , 1 , 0 )... ( ) ( ) 1 ( 2
1 + = = − =
+ t s t y t i m t
yi i i
Therefore, we can calculate the age-specific demographic structure of population at different age groups, such as population coefficient, population dependency ratio and elderly dependency ratio, and analyze their changes over time.
3. Population Analysis of Henan Province
3.1. Data Source
As one of the most populous provinces among the most populous countries, Henan's population changes occupy a certain place in China. This paper selects the data of Henan Province from the Statistical Yearbook, and obtains the optimal fertility strategies through the analysis of the total population, the population factor of the elderly and the dependency ratio under different strategies of the three kinds of birth intention. And to a certain extent, this paper explains the feasibility of the policy of full opening up two children issued by the 18th Party Congress.
3.2. Leslie Model Parameters Set
(1) Determine birth pattern
According to the data of age-specific fertility in Henan Province from 2011 to 2014, we can see that the graphs generally show a left-normal distribution. Therefore, we use the log-normal distribution function to fit the data of annual fertility.
According to the relationship between the total fertility rate
and the age-specific fertility rate, the expression of the age-specific fertility rate of women of reproductive age is set as
b( )x =B g x* ( )
Where
B
is the total fertility rate, g x( ) is the specific fertility pattern, b x( ) is the age-specific fertility rate of women, x is the reproductive age of women of childbearing age, the value range of x is 15≤ ≤x 49,
the fertility pattern represented by the mathematical form of a lognormal distribution function is) ) 3 ( 2 )) 2 ( ) (log( exp( (1) ) ( 2 2 p p x Bx p x
g = • − −
Where p(1)
,
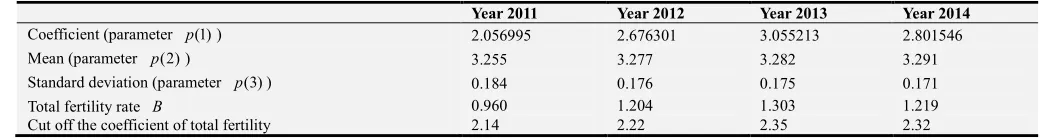
p(2) and p(3) are the parameters to be estimated, p(1)is the coefficient, p(2) is the expectation, and (3)p is the standard deviation.This paper use the four-year data to calculate the parameter values as shown in Table 1, and then perform the paired-sample test and the goodness-of-fit test on the mean respectively. The results show that fitting the age-specific fertility rate with log-normal distribution is effectively, the log-normal distribution can be used to fit the future age-specific fertility rate of women. And the coefficient of 2014 and the coefficient of determination of the goodness of fit test are both the largest, therefore, the parameters of 2014 are selected to simulate the future adolescent fertility patterns of women of childbearing age. Obtain fertility patterns mathematical expressions: ) 0.058 ) 291 . 3 ) (log( exp( 2.802 ) ( ) ( 2 − − • = • = x x x g B x b
Where b x( ) is the future need to predict the sub-age specific fertility;
B
is the total fertility rate, which is related to the future birth control policy; x is the reproductive age of childbearing women, the value range is 15≤ ≤x 49.
Table 1. Fits the age-specific fertility parameters for 2011-2014 using log-normal distribution.
Year 2011 Year 2012 Year 2013 Year 2014
Coefficient (parameter p(1)) 2.056995 2.676301 3.055213 2.801546
Mean (parameter p(2)) 3.255 3.277 3.282 3.291
Standard deviation (parameter p(3)) 0.184 0.176 0.175 0.171
Total fertility rate B 0.960 1.204 1.303 1.219
Cut off the coefficient of total fertility 2.14 2.22 2.35 2.32
(2) Determine age-specific mortality
The comparison of birth, death and natural growth rates from 1978 to 2014 in Henan province shows that the death rate in Henan Province fluctuated around a straight line between 5.76 and 7.02 with smaller amplitude than the birth rate and the natural growth rate. Assuming no major changes (such as earthquakes and catastrophic infectious diseases), this paper use the age-specific mortality of the 2010 Henan Census data
to replace the age-specific mortality in future population projections.
(3) Determine birth sex ratio
115.60 and 118.46 respectively. And in 2003, the birth sex ratio in Henan province reached a new historical high of 119.29. The Sixth-census data, though not continuously rising, was as high as 117.77 and remained around 117 in 2011-2013. After 2013, the birth sex ratio was still high, which about 10 points above the upper limit of normal. In the long-term forecast, under the current policy of population birth, this paper sets the initial birth sex ratio as 117.
3.3. Four Kinds of Fertility Strategies and Total Fertility Rate Settings
Population development is regulated by population policy in China. This paper systematically discusses the following four fertility strategies which based on the development of China's population.
(1) Strategy I: Implement One-child policy all the time
As Henan Province has been implementing the Strict One-child policy from 1978 to 2013, the total fertility rate is unlikely to change in the short term. Compared with the total
fertility rate of 2010-2014, 2010 is higher than other years. So for strategy I, this paper set the total fertility rate as the average of the total fertility rates from 2010-2013,
B
= 1.192.(2) Strategy II: Implement One-child policy before 2013 and implement Two-child policy during 2013-2050.
According to the survey and statistical analysis, the average number of children of childbearing age in Henan Province is 2.08. Song Jian pointed out in Population Control Theory that from 1990 to now, the average fertility rate has dropped and stayed at 1.5; and from 2040 to 2050, the average fertility rate increased from 1.5 to 2.04, then at the end of the next century (referring to the 21st century), the population of the country can basically be stabilized at the level of 700 million. [15] Based on the implementation effect of this policy in 2014, this paper finds no significant change in the birth rate of the population relative to the primary birth policy. With reference to the above survey report, this paper formulated the total fertility rate of Henan Province under the fertility strategies at low and high respectively, as shown in Table 2.
Table 2. Set the total fertility rate under Strategy II.
Fertility wishes 2011-2014 2015-2024 2025-2029 2030-2039 2040-2050
low 1.192 1.192 1.192 1.5 1.5
Medium 1.192 1.5 1.5 1.5 1.5
High 1.5 1.5 1.5 1.5 1.5
(3) Strategy III: Implement One-child policy before 2013, implement Two-child policy during 2013-2015 and implement Overall two-child policy after 2015
On October 29, 2015, the Fifth Plenary Session of the Eighteenth Central Committee of the Communist Party of China decided that China should comprehensively implement its policy of giving birth to two children by a couple. On January 5, 2016, the Central Government issued a proclamation that the two children are born without any
approval and are arranged by the family at home. This paper analysis shows that if the Overall-Two-child can be fully implemented nationwide, the total fertility rate can be maintained at 2.1, in line with the human replacement level. Since there is no investigation report for this policy at present, this paper make some changes according to the policy of Two-children alone, and formulate the total fertility rates under low, medium and high fertility strategies, as shown in Table 3 respectively.
Table 3. Set the total fertility rate under Strategy III.
Fertility wishes 2011-2014 2015-2019 2020-2024 2025-2039 2040-2050
low 1.192 1.192 1.5 1.5 2.1
Medium 1.5 1.5 1.5 2.1 2.1
High 2.1 2.1 2.1 2.1 2.1
(4) Strategy IV: Implement One-child policy before 2013, implement Two-child policy during 2013-2015, implement Overall two-child policy during 2015-2020 and implement Three-child policy after 2020
Since this policy is not implemented at present, this paper make some adjustments based on the Overall-Two-child
policy. Here, reference III assumes that when China implements a more lenient population policy than the Overall-Two-child, the total fertility rate is set to 2.5. This paper proposes that the total fertility rates under low, medium and high fertility strategies, as shown in Table 4 respectively.
Table 4. Set the total fertility rate under Strategy IV.
Fertility wishes 2011-2019 2020-2024 2025-2029 2030-2039 2040-2050
low 1.5 1.5 1.5 2.1 2.1
Medium 1.5 2.1 2.1 2.1 2.5
High 2.1 2.1 2.5 2.5 2.5
3.4. Results and Analysis
One of the goals of population control is to try to reduce the coefficient of the elderly population under the premise of
population direction, and chooses the three parameters of the total population, the elderly population coefficient and the total dependency ratio of the population as the index to select the optimal strategy under different fertility wishes.
(1) Comparison, analysis and selection of population strategies under Low-fertility wishes
According to the analysis of the total population, the population size of strategy I and strategy II declines too fast, they are not easy to meet the needs of social and economic development, these two strategies are not desirable. The strategies III and IV are optional and the population peak can be controlled at within 100 million, the size of the population will not be far away from the existing population scale by 2050, making it easy to maintain social and economic stability.
In terms of the control of the aging trend alone, neither strategy I nor strategy II is advisable because the elderly population coefficient under this strategy has been on the upswing until 2050, and the forecast period has not been extended until 2075. Strategy III and strategy IV relatively better control of the elderly population coefficient, of which strategy IV have more stable elderly population factor before 2050, and can be controlled within 0.22.
From the perspective of the changing trend of the dependency coefficient alone, strategies I, II and III are not advisable because after extending the forecasting period to 2075, this paper find that the population dependency ratio is stable in the short term, but the upward trend has been observed in the long term, and the peak Reached about 0.72, which is not in line with the needs of reality in Henan Province. Strategy IV is the optimal program, although the overall population dependency ratio of the program in the previous stage higher than the other three strategies, but the dependency ratio coefficient has been able to control within 0.6, the immense potential within the society is exerted in the latter.
To sum up, when the willingness to social childbirth is low, it is wise to choose Strategy IV, and the total fertility rate during the fourth strategy period will remain at the level of human replacement. Prediction of population age structure with low fertility willingness under strategy IV: the population coefficient of children and adolescents will continue to decline slowly, reaching 0.1575 in 2050; the overall population coefficient of young and middle aged will show a downward trend, reaching 0.635 in 2050; the overall elderly population factor is on the rise, with 0.2064 in 2050; population dependency showed an upward trend from the previous period, reaching a maximum of 0.5936 in 2045 and a downward trend in the latter part of the year; the dependency ratio of the elderly has continued to rise until 2040, reaching a maximum of 0.3291 by 2040, and then showing a slow downward trend.
(2) Comparison, analysis and selection of population strategies under Medium-fertility wishes
According to the total population analysis, the population size of strategy I and strategy II declines too fast, they are not easy to meet the needs of social and economic development, these two strategies are not desirable; strategy III is optimal, the peak population can be controlled within 100 million, and
the population size before 2050 will not be far away from the existing population scale and will be easy to maintain the social and economic stability. The strategic IV’s population is too large and has remained at over 100 million for several decades, enormous pressure is exerted on education and housing, which will seriously affect economic development and social life.
Just from the control of the trend of aging, the same as the level of low-fertility, the trend of aging is inevitable. Strategy I and strategy II are both undesirable because the population factor of the elderly under these strategies have been rising until 2050, and the prediction of the elderly population coefficient will not decrease until 2075; Strategies III and IV’s elderly population coefficient can be better controlled, but the reduction of the population factor for the elderly in strategy IV comes at the expense of increasing the total fertility rate, therefore, strategy III is more feasible.
From the perspective of the change of dependency coefficient, strategy III is alternative. Strategies I, II and IV are not desirable, because the forecast period extended to 2075 and found that the dependency ratio in the short term stable, but in the long term it has been showing an upward trend, the peak reached 0.72, which is not meet the needs of reality in Henan Province. Strategy III, while having a higher total dependency ratio in the previous period than strategy I or II, but its dependency ratio can maintain within 0.6, the immense potential inherent in society is exerted in the second half of the year, bringing the population dependency back to normal.
To sum up, when the childbearing will is medium, choosing strategy III is wise, and the total fertility rate at the end of strategy three remains at the level of human replacement. Population age structure forecast under the fertility wishes of Strategy III: the population coefficient of children and adolescents has been declining to 0.16 in 2050; the population coefficient of young and middle aged population did not change much until 2025, but began to decline in 2026 and reached the minimum in 2040 The value of 0.6249, followed by a slow upward trend in 2050 to 0.6376. The coefficient of the elderly population showed an upward trend in the early period, rising from 0.085 in 2011 to 0.20 in 2040 and remained at 0.20 in the next ten years. The population dependency ratio showed an upward trend but a downward trend before 2025, an upward trend after 2025 and a maximum value of 0.5975 in 2040, after which it has been on a downward trend. The dependency ratio of the elderly has continued to rise until 2040, reaching a maximum of 0.3265 by 2040, and then showing a downward trend.
(3) Comparison, analysis and selection of population strategies under High-fertility wishes
2050, which is easy to maintain social and economic stability. Strategy III’s population size is too large and has remained at more than 100 million for several decades, which is tremendous pressure on education and housing.
In terms of the control of the trend of aging alone, strategy I’s elderly population coefficient continued to rise and the aging process intensified. Although strategy III and strategy IV can control the coefficient of the elderly population within 0.2, but it is at the expense of a large population base. By comparison, Strategy II can lower the elderly population coefficient while controlling the total population.
From the perspective of the change of dependency coefficient, strategy II is alternative. Strategy I’s total dependency is small and no longer rising in the short term, but it is rising too fast and the peak value is too large in the long-term trend. Strategy III is due to the upward trend in the latter part of the dependency ratio did not ease. Strategy IV dependency ratio has exceeded 0.6 since 2015, bringing too much pressure for parenting.
To sum up, when the social fertility wishes is high, it is wise to choose strategy II, and the total fertility rate has remained at 1.5. Population age structure forecast under the fertility wishes of Strategy II: the population factor of children and adolescents will drop from 0.21 in 2011 to 0.12 in 2050; the population coefficient of young and middle aged will remain at around 0.70 before 2030 and will be around 0.657 after 2040; the overall population coefficient continued to rise from 0.085 to 0.22 and tended to be flat after 2040; the population dependency ratio reached a minimum of 0.41 in 2026, a maximum of 0.52 in 2041 and 0.5165 in 2050; the dependency ratio of the elderly in Reaching a maximum of 0.3343 in 2050.
4. Conclusion
Through the study of population data in Henan Province, this paper concludes: under the Low-fertility wishes, opening an all-round three children by 2020 (strategy IV) is the best choice; under the Medium-fertility wishes, overall-two-child policy (strategy III) is the best choice; under the High-fertility wishes, two-child-alone policy (strategy II) is the best choice. In China, due to the imbalanced development in different regions and the large differences in educational level, people's wishes for childbearing are not on the same level. And, in order to reach the low birthrate in developed countries, there may be a long way to go. The management of the population and the formulation of population policies are all indispensable in China. In today's China, people's fertility will be at medium level. At this time, it is quite feasible to implement a overall-two-child population policy. In the future, China can even govern the population in different regions so as to more accurately adjust the population structure in various regions and ease the current situation of an aging population.
Based on the population data of Henan Province, this paper analyzes the population strategies of all kinds of fertility
wishes in detail, which can better simulate the actual situation and has higher feasibility.
Acknowledgements
Fund Project: National Social Science Fund Project “A Study on the Dynamic Evolution of Family Structure and Intergenerational Support for Rural Elderly People” (17BRK020); National Social Science Fund Project “Follow-up Study on the Intergenerational Relationship between the Elderly and Children, Grandsons in Rural China” (14CRK003); National Natural Science Foundation of China “A Study on the Dynamic Evolution of Livelihoods and Welfare of Rural Elderly and Family Support Policies” (71573207).
References
[1] Wang Yanan, Zhong Funing. Changes in Birth Rate of China Population and Prediction since 1990 [J/OL]. Population and Economy [2017-12-27].
http://kns.cnki.net/kcms/detail/11.1115. F.20170306.1051.002.html.
[2] Meng Lingguo, Li Chaoling, Hu Guang. Prediction of China's Population Structure Based on PDE Model [J]. Chinese Journal of Population, Resources and Environment, 2014, 24 (02): 132-141.
[3] Jiang Yu, Quan Mengzhen. China's population structure, pension insurance and household consumption [J]. Economic Survey, 2018 (01): 1-12 [2017-12-27]. https: //doi.org/10.15931 /j.cnki.1006-1096.20171129.018.
[4] Han Xiaoqing. Leslie model of China's future population strategy simulation [D]. Dongbei University of Finance and Economics, 2012.
[5] Song Jian, Ding Jun, Wang Fuyuan. Effects of the Comprehensive Two-child Policy on Spatial Structure of Population and Regional Population in China [J]. Progress in Geography, 2016, 35 (11): 1305-1316.
[6] Ren Qiang, Huang Jiting. Prediction and Analysis of China's Population Development Based on Leslie Model [J]. Journal of Mathematics, 2010, 40 (23): 101-106.
[7] Meng Lingguo. A Review on Leslie Model [D]. Northeast Normal University, 2009.
[8] Zhang Yanhua, Xu Yikai, Li Zhuoming. Study on the Impacts of "All-Round Two-Tire" Policy Based on Error Correction Model and Leslie Model [J]. Human Resource Management, 2017 (06): 304-307.
[9] Yu Tingting, Song Yuxiang, Hou Feilong, Li Qiuyu. Study on the Population Structure Factors of Economic Growth in Northeast China [J]. Economic Geography: 1-9 [2017-12-27]. http: //kns.cnki.net/kcms /detail/43.1126. K.20161019.0838.004.html.
[11] Liu Ye, Wu Sheng, Wu Xingjiao, Zhou Haihe, Liu Yingli, Zhang Jing. Analysis of the Influence of the Comprehensive Two-child Policy on the Population Structure Based on Leslie Model [J], Software, 2017, 38 (08): 145-150.
[12] Guo Shenshen. Study on the Influence of Population Structure Change in Henan Province on Economic Development [D]. Henan University, 2015.
[13] Lin Hongkang, Xie Xiangdong. Qualitative Analysis of a Class of Leslie Models [J]. Mathematical Research, 1997 (03): 308-311.
[14] Wang Haoming. Empirical Study on the Adjustment of China's Population Total Fertility, Demographic Dividend and Reproductive Policy [D]. Liaoning University, 2016.