SHIV SHAKTI
International Journal of in Multidisciplinary and
Academic Research (SSIJMAR)
Vol. 3, No. 5, October 2014 (ISSN 2278 – 5973)
Once Over Attribute Disparity in Private Sector Banks –with Special Reference to TMB
Mr. G.SHIVA
ASSISTANT PROFESSOR, DEPARTMENT OF COMMERCE
RATHINAM COLLEGE OF ARTS AND SCIENCE COIMBATORE TAMILNADU
INDIA
Impact Factor = 3.133 (Scientific Journal Impact Factor Value for 2012 by Inno Space Scientific Journal Impact Factor)
Indexing:
1. INTRODUCTION OF THE STUDY
1.1SERVICES MARKETING
We term marketing a function by which a marketer plans, promote and deliver goods
and services to the customer or clients. In the marketing of services, the providers are
supposed to influence and satisfy the customer or users. An institution or an individual may
act as a provider who requires professional‟s excellence to influence the impulses of
prospects and to transform the developed country them into actual customers. When we buy
service offered by a service generating organization in a true sense we buy the time,
knowledge, skill or resources. The application of marketing principles in the services sector is
the main thing in the services marketing.
We cannot deny the fact that the concept services marketing has gained prominence
very recently. The emergency of a number of service generating organizations in almost all
the areas engineered a strong foundation for the development of services marketing,
especially in the developed countries of the west which could get a place in the developing
countries like ours in the due course. The end of the decade 1950‟s paved avenues for
services marketing since a number of financial institutions and to be more specific the
insurance companies realized the instrumentality of the quality of services in making the
environmental conditions conducive. The services generating organizations like banking
organizations, insurance companies and others felt that application of marketing principles in
the service management would initiate qualitative transformation which would simplify their
task if increasing the market share and establishing leadership.
The perception of service marketing focuses on selling the services in the best
interest of user/ customers. It is concerned with the scientific and planed management of
services which makes possible a fair synchronization of the interests of providers as well as
the users. With a change in the perception of management, we witnessed multi- faceted
changes which necessitate an analogous change in the concept of services marketing. The
compelled to assign due weight age to the interests of society in the face of the holistic
concept of management.
Marketing a service is meant marketing something intangible. It is marketing a
promise. It is more selling you. We can‟t deny the fact that selling of promises complicates
the task of marketers since they find it difficult to identify the stage or time where the
services degenerating or where the promises fall. Of late, we consider marketing customer
satisfaction engineering. There is no doubt in it that the organizational goals like making
profits, establishing a leadership, innovating marketing resources are found significant but the
focal point is the user‟s satisfaction. In the marketing of services, we go through a number of
problems directly or indirectly influencing the business index. The problems like market
segmentation, marketing information system, behavioral management re studied minutely
which simplify the task of formulating a sound mix for marketing, such as product mix,
promotion mix, price mix and the place mix. It is important to mention that we find “People “an important mix of marketing services.
Marketing is also defines as a managerial process by which the products are matched
with market and through which the consumer is enabled to use or enjoy the product. In the
present definition, the product is an all inclusive term which includes services as well as
physical goods. It is also said about marketing that is the managerial process by which
products are innovated. Modern management regards marketing and production an
interdependent subsystem. It is against this back ground that in the marketing management, a
number of problems are discussed, such as personal selling advertisement, publicity, sales
promotion, pricing, placement and management of marketing people. The combination of
marketing controllable used to market a product or a service is often described as the
marketing mix. In addition, the marketing management is also responsible of the continual
adjustment of marketing controllable used to market tangible or intangible. A Life Insurance
company which basically sells the service of protection expects its marketing staff to provide
information about the potential buyer or the prospects and the kind or types of insurance
services they need and want. They are also supposed to provide channels through which the
nature of service offered and participate in the determination of prices that would be
acceptable to the potential buyers and yield profits to the company. Whether the service is
Dancing instruction, travel advice or hair style, marketing is found responsible for the inward
flow of income to the organization.
The aforesaid facts make it clear that marketing is a vital function in both profit and
nonprofit making organization. Traditionally, we study marketing only from the view point of
profit seeking institution but recently we have the marketing type problem of even the
nonprofit making organization like educational institutions, hospitals, politically and socially
organized or so. Of late evince are interested in studying the marketing problems of service
generating organization. The banks making available to the customers the savings and
investments facilities the insurance companies sharing the risk of insured persons, the
transport organizations offering to their customers quality, safe and economic services, the
tourist organization, the hotels, the communication organizations and many others are found
studying the problems of marketing with the motto of satisfying the customers, sub serving
the social interest and enriching their potentials to face the challenges and threats in the
market. By and large almost all the service generating organization are found participating
marketing for accomplishing the organizational goals.
In view of the above, we observe the following key points regarding the concept or
perception of service marketing:
It is a managerial process of managing the services.
It is an organized effort for providing a sound foundation for the development of an organization.
It is a social process helping an organization to understand the emerging social problems and to take part in social transformation process to justify its existence in
the society
Service Quality is a comparison of expectations with performance. A business with
high service quality will meet customer needs whilst remaining economically competitive.
Improved service quality may increase economic competitiveness. This aim may be achieved
by understanding and improving operational processes; identifying problems quickly and
Systematically; establishing valid and reliable service performance measures and measuring
customer satisfaction and other performance outcomes.
1.2.1 DEFINITION
From the viewpoint of business administration, service quality is an achievement
in customer service. It reflects at each service encounter. Customers form service
expectations from past experiences, word of mouth and advertisement. In general, Customers
compare perceived service with expected service in which if the former falls short of the
latter the customers are disappointed. The accurate measurement of an objective aspect of
customer service requires the use of carefully predefined criteria.
The measurement of subjective aspects of customer service depends on the
conformity of the expected benefit with the perceived result. This in turns depends upon the
customer's expectation in terms of service, they might receive and the service provider's
ability and talent to present this expected service. Successful Companies add benefits to their
offering that not only satisfy the customers but also surprise and delight them. Delighting
customers is a matter of exceeding their expectations.
Pre-defined objective criteria may be unattainable in practice, in which case, the best
possible achievable result becomes the ideal. The objective ideal may still be poor, in
subjective terms. Service quality can be related to service potential (for example, worker's
qualifications); service process (for example, the quickness of service) and service result
(customer satisfaction).
1.2.2 DIMENSIONS OF SERVICE QUALITY
A customer's expectation of a particular service is determined by factors such as
recommendations, personal needs and past experiences. The expected service and the
perceived service sometimes may not be equal, thus leaving a gap. Ten determinants that may
Competence is the possession of the required skills and knowledge to perform the
service. For example, there may be competence in the knowledge and skill of contact
personnel, knowledge and skill of operational support personnel and research capabilities of
the organization.
Courtesy is the consideration for the customer's property and a clean and neat
appearance of contact personnel, manifesting as politeness, respect, and friendliness.
Credibility is the factors such as trustworthiness, belief and honesty. It involves
having the customer's best interests at prime position. It may be influenced by company
name, company reputation and the personal characteristics of the contact personnel.
Security is the customer feeling free from danger, risk or doubt including physical
safety, financial security and confidentiality.
Access is approachability and ease of contact. For example, convenient office
operation hours and locations.
Communication means both informing customers in a language they are able to
understand and also listening to customers. A company may need to adjust its language for
the varying needs of its customers. Information might include for example, explanation of the
service and its cost, the relationship between services and costs and assurances as to the way
any problems are effectively managed.
Knowing the customer means making an effort to understand the customer's
individual needs, providing individualized attention, recognizing the customer when they
arrive and so on. This in turn helps in delighting the customers i.e. rising above the
expectations of the customer.
Tangibles are the physical evidence of the service, for instance, the appearance of the
physical facilities, tools and equipment used to provide the service; the appearance of
personnel and communication materials and the presence of other customers in the service
Reliability is the ability to perform the promised service in a dependable and accurate
manner. The service is performed correctly on the first occasion, the accounting is correct,
records are up to date and schedules are kept.
Responsiveness is to the readiness and willingness of employees to help customers in providing prompt timely services, for example, mailing a transaction slip immediately or
setting up appointments quickly.
Later, the determinants were reduced to Five: tangibles; reliability; responsiveness; service
assurance and empathy.
1.3 SERVICE QUALITY GAP:
Service quality gap is the difference between the service quality expected by the customer of the bank and the customers' perception of the service delivered by the bank to them. The difference between the perceived score assigned by the customer and the service
1.3.1 SERVQUAL MODEL OR GAP MODEL:
The service quality model or the „GAP model‟ developed by a group of
authors-Parasuraman, Zeithaml and Berry at Texas and North Carolina in 1985 , highlights the
main requirements for delivering high service quality. It identifies five „gaps‟ that cause
unsuccessful delivery. Customers generally have a tendency to compare the service they
'experience' with the service they „expect‟. If the experience does not match the expectation ,
there arises a gap.
GAP 1:
Gap between consumer expectation and management perception: This gap arises
when the management does not correctly perceive what the customers want. For instance –
hospital administrators may think patients want better food, but patients may be more
concerned with the responsiveness of the nurse.
GAP 2:
Gap between management perception and service quality specification : Here the
management might correctly perceive what the customer wants ,but may not set a
performance standard. An example here would be that hospital administrators may tell the
nurse to respond to a request „fast‟ , but may not specify „how fast‟.
GAP 3:
Gap between service quality specification and service delivery: This gap may arise
owing to the service personnel. The reasons being poor training, incapability or unwillingness
GAP 4:
Gap between service delivery and external communication: Consumer
expectations are highly influenced by statements made by company representatives and
advertisements. The gap arises when these assumed expectations are not fulfilled at the time
of delivery of the service. For example – The hospital printed on the brochure may have clean
and furnished rooms, but in reality it may be poorly maintained – in this case the patient‟s
expectations are not met.
GAP 5:
Gap between expected service and experienced service: This gap arises when the
consumer misinterprets the service quality. The physician may keep visiting the patient to
show and ensure care, but the patient may interpret this as an indication that something is
really wrong.
1.4 Conceptual Framework
Service quality has been defined by various experts in various ways. Asubonteng et al. (1996) defines it as: 'Service Quality is the difference between customers' expectations for service performance prior to the service encounter and their perceptions of the service received.' According to Gefan (2002) 'Service quality is the subjective comparison that customers make between the quality of service that they want to receive and what they actually get.' Parasuraman et al. (1985, 1988) says, 'Service quality is determined by the differences between customer's expectations of services provider's performance and their evaluation of the services they received.'
1.5 Banking Services
In the group of service generating industries, we find banking services occupying a
place of outstanding significance. We can‟t deny the fact that with the development of
economic activities, the banking sector could emerge as an industry. The public as wells as
the private sector has been found owning, managing and controlling the banking services. It
technologies in almost all the sectors and the developed countries activated the process of
promoting the technology–driven, user-friendly services.
A number of information technologies got important place in the management of
banking services. In the past, the banking sector did not get any attraction in the Indian
economy because of the low level of economic activities and the meager business prospects.
Of late the business prospects are bright, the trade and commerce has been found getting a
conducive environment, the development-oriented activities are motivated, the welfare
oriented programmes are given due weightage, the international trade has been found gaining
popularity and these positive developments in the economic world have engineered a sound
foundation for the development of banking industry.
It is against this background that we find different types of banks serving the different
segments of the Indian economy. In the Indian banking industry, the contours of development
underwent radical changes especially after the first phase of nationalization of commercial
banks way back in 1969. The nationalization was with the motto of raising the contributions
of public sector commercial banks to the development and welfare heads but they failed in
doing such. The job security to bank employees and domination of trade unions paved the
avenues for degeneration in the quality of customer services.
The process of degeneration reached to its peak which developed a bias and the
customers in general are found dissatisfied with the services of the public sector commercial
banks. Meanwhile, the foreign banks and a few of the private banks got an opportunity to
display their excellence and with the support of high-performing bank employees and
technology-driven services; they got success in establishing and edge over the services of
public sector banks. Of course, the regulation of the Reserve Bank of India demotivated the
private sector banks and especially the foreign banks while expanding their networks which
have minimized the intensity of competition; however they have been successful in building
and projecting a positive image. It is in this context that we talk about the application of
Of late, the policy makers have realized gravity of the problems since they appear
interested in discussing and deliberating upon the problems of customer services even in the
boardrooms. With the increasing level of customer expectations, it is essential that to be more
specific the public sector commercial banks innovate strategies and promote
technology-driven, user-friendly services to increase the market share vis-à-vis to project a positive
image. This makes a strong advocacy in favour of bank marketing since its application in a
right fashion would answer to a number of unsolved questions.
1.5.1 BANKING SERVICE AND PRODUCTS:
The services and products offered by banks in their various roles can be summarized as follows:
ROLE SERVICES PRODUCTS
Payment System Constituent
A. Payment and Remittance
1. Cheque
2. Payorder/Bankers cheque 3. Demand Draft
4. Multi City Cheques (Anywhere banking) 5. Elecronic Fund Transfer 6. Debit Card
7. Credit Card 8. Charge Crad 9. Travel Card B. Collection 1. Transfer
2. Local Clearing 3. ECS or Electronic
Clearing System; Credit ECS, Debit ECS
4. Cheque Collection 5. National Clearing 6. CMS-Cash Management
Intermediary
D. Deposit Current Accounts Savings Account Fixed Deposits Recurring Deposits E. Loan 1. Retail loans
* Housing or mortgage * Vehicle loans
* Consumer Durable * Personal loans
* Loan against shares * Loan against fixed deposit
* Personal overdrafts * Credit cards- it is a hybrid product and is predominantly a payment product. 2. Business Credit a. 1. Term Loans 2. Leasing b. Working capital facilities
* Overdraft * Cash Credit * Packing Credit * Demand loan/ Line of Credit
* Business card or Credit for business transaction
c. Trade Finance
* Cheques purchase * Bill purchase * Bill discount
* Letter of credit(LC) * Bill negotiation * Guarantees
Financial Services
public issues)
G. Collection 1. Taxes 2. Utility Bills
H. DeMAT DeMAT Share account
I.Safe Keeping 1. Safe deposit vault 2. Safe Custody
J.Advisory Investment advices
1.6 PRIVATE BANKS:
Private Banks are banks owned by either an individual or a general partner(s) with
limited partner(s). These private banks are not incorporated. In any such case, the creditors
can look to both the "entirety of the bank's assets" as well as the entirety of the
sole-proprietor's/general-partners' assets. These banks have their long tradition in Switzerland,
dating back to at least the revocation of the Edict of Nantes (1685). Private Banks also have a
long tradition in the UK where C. Hoare & Co. has been in business since 1672.
There were many private banks in Europe, but most have now become incorporated
companies, so the term is rarely true any more. Today, the term "private bank" can also refer
to the financial institution specializing in financial advice and services for high net worth
individuals "Private banks" can also refer to non-government owned banks in general, in
contrast to government-owned (or nationalized) banks, which were prevalent
in communist, socialist and some social democratic states in the 20th century.
1.6.1 PRIVATE SECTOR BANKS IN INDIA
All those banks where greater parts of stake or equity are held by the private
shareholders and not by government are called "private-sector banks". These are the major
players in the banking sector as well as in expansion of the business activities in India. The
tools and techniques to handle the complexities are a result of the evolutionary process over
two centuries. They have a highly developed organizational structure and are professionally
managed. Thus they have grown faster and stronger since past few years.
Private-sector banks have been functioning in India since the very beginning of
the banking system. Initially, during 1921, the private banks like Bank of Bengal, Bank of
Bombay and Bank of Madras were in service, which all together formed Imperial Bank of
India. Reserve Bank of India (RBI) came in picture in 1935 and became the centre of every
other bank taking away all the responsibilities and functions of Imperial bank. Between 1969
and 1980 there was rapid increase in the number of branches of the private banks. In April
1980, they accounted for nearly 17.5 percent of bank branches in India. In 1980, after 6 more
banks were nationalized, about 10 percent of the bank branches were those of private-sector
banks. The share of the private bank branches stayed nearly same between 1980 and
2000.Then from the early 1990s, RBI's liberalization policy came in picture and with this the
government gave licenses to a few private banks, which came to be known as new
private-sector banks.
Two categories of the private-sector banks: "Old" and "New".
The old private-sector banks have been operating since a long time and may be
referred to those banks, which are in operation from before 1991 and all those banks that
have commenced there business after 1991 are called as new private-sector banks. Housing
Development Finance Corporation Limited was the first private bank in India to receive
license from RBI as a part of the RBI's liberalization policy of the banking sector, to set up a
bank in the private-sector banks in India
Old Private sector Banks
The banks, which were not nationalized at the time of bank nationalization that took
place during 1969 and 1980, are known to be the old private-sector banks. These were not
nationalized, because of their small size and regional focus. Most of the old private-sector
banks are closely held by certain communities their operations are mostly restricted to the
areas in and around their place of origin. Their Board of directors mainly consists of locally
these banks is that, they lean heavily on service and technology and as such, they are likely to
attract more business in days to come with the restructuring of the industry round the corner.
List of Old Private sector Banks in India:
Name of the Bank Year of establishment
1.Bank of Punjab 1943
2.Catholic Syrian Bank 1920
3.City Union Bank 1904
4.Dhanlaxmi Bank 1927
5.Federal Bank 1931
6.ING Vysya Bank 1930
7. Jammu and Kashmir 1938
8.Karnataka Bank 1924
9.Karur Vysysa Bank 1916
10.Lakshmi Vilas Bank 1926
11.Nainital Bank 1912
12.Ratnakar Bank 1943
13.SBI Commercial and
International Bank
1955
14.South Indian Bank 1929
15.Tamil Nadu Mercantile Bank
Ltd
1921
New Private sector Banks
The banks, which came in operation after 1991, with the introduction of economic
reforms and financial sector reforms are called "new private-sector banks". Banking
regulation act was then amended in 1993, which permitted the entry of new private-sector
banks in the Indian Banking sector. However, there were certain criteria set for the
establishment of the new private-sector banks, some of those criteria being:
1. The bank should have a minimum net worth of Rs. 200 crores.
2. The promoters holding should be a minimum of 25% of the paid-up capital.
Within 3 years of the starting of the operations, the bank should offer shares to public and
their net worth must increased to 300 crores
List of new private sector banks in India:
Name of the Bank Year of establishment
1.AXIS(earlier UTI Bank) 1994
2.Bank of Punjab(actually an old generation
private bank since it was not founded under
post-1993 new bank licensing regime)
1989
3.Centurion Bank Limited(Merged Bank of
Punjab in late 2005 to become Centurion
Bank of Punjab, acquired by HDFC Bank
Ltd. in 2008)
1994
4. Development Credit Bank (Converted
from Co-operative Bank, now DCB Bank
Ltd.)
5. HDFC Bank 1994
6. ICICI 1996
7.IndsInd Bank 1994
8. Kotak Mahindra Bank 2003
9.Yes Bank 2005
10.Times Bank (Merged with HDFC Bank
Limited)
11.Global Trust bank ( Merged with
Oriental Bank of Commerce)
12.IDBI Bank Limited(reverse merged with
parent IDBI, as of now IDBI bank)
LIST OF PRIVATE BANKS IN COIMBATORE CITY
1. Axis Bank
2. Catholic Syrian Bank
3. City Union Bank
4. Development Credit Bank
5. Dhanlaxmi Bank
6. Federal Bank
7. HDFC Bank
8. ICICI Bank
9. Karnataka Bank
10. IndusInd Bank
12. Jammu and Kashmir Bank
13. Karur Vysysa Bank
14. Kotak Mahindra Bank
15. Lakshmi Vilas Bank
16. Saraswat Bank
17. South India Bank
18. Sourashtra Bank
19. Tamil Mercantile Bank Limited
20. Yes bank
1.7 TAMILNAD MERCANTILE BANK:
Tamilnad Mercantile Bank Limited (TMB) is a bank head-quartered in
Tuticorin in Tamil Nadu, India. TMB was founded in 1921 as the Nadar Bank, but changed
its name to Tamilnad Mercantile Bank in November 1962 to widen its appeal beyond
the Nadar community. For the financial year 2009-2010, the bank reported a net profit
of 184.53 crores. The bank currently has 310 full fledged branches all over India, nine
regional offices and 11 Extension Counters, two Mobile Banking branches, 6 central
processing centres, two Currency Chests and 403 Automated Teller Machines. TMB has
plans to open branches in Colombo, Singapore and Malaysia to serve the Tamil community
living in those countries. It is one of the few Indian Banks to have an steady Growth Rate of
25%, for the past 4 years.
Genesis & Growth
The history of Tamilnad Mercantile Bank dates back to 1921.The thought of
establishing a bank for the Nadar business community was first proposed at the annual
registered on 11 May 1921 as Nadar Bank Limited under the Indian Companies Act, 1913.
M.V.Shanmugavel Nadar was elected as the first Chairman on 4 November 1921. The bank
was opened to the public by T.V.Balagurusamy Nadar on 11 November 1921 in Ana
Mavanna Building at South Raja Street; Tuticorin The bank was registered on May 11, 1921
as "The Nadar Bank Ltd". By 1947 the bank had only four branches: Tuticorin,
Virudhunagar, Madurai and Sivakasi. The bank had opened a branch at Colombo in 1937 but
had closed it in 1939.The bank opened its first branch in India but outside the state of Tamil
Nadu in 1976 at Bangalore.
The first new fully computerized branch opened at WGC Road, Tuticorin on 9
December 1984. The bank had established its first currency chest in 1993 at Madurai and has
industrial finance branches at Coimbatore, Chennai and Secunderabad. The Bank has
launched its ATM Card on 11 November 2003.TMB have tie-up arrangements with IDBI
Bank 108 locations and HDFC Bank 462 locations gives an effective branch network of 794.
Customer Service
Tamilnad Mercantile Bank Ltd. focused its attention on the customers from the very
beginning and the bank is known for its personalized service. The teams of management and
staff members of the bank are having the practice of meeting people from various walks of
life and hear their requirements on a regular basis.
Serving the Rural
The bank has had a vision of extending banking service to common people of rural
areas, hitherto neglected, with all humility. The bank dotted more and more non-metro
centers with its branches thereby extending its service area in range, variety and magnitude.
Out of 308 branches, 263 branches are located at rural, semi urban & urban (non-metro)
centers
Tamilnad Mercantile Bank Ltd concentrated its efforts to meet the genuine
requirements of various sectors of the economy and advanced to the needy sectors of the
society. The bank has taken it as a challenge to participate in various Government sponsored
schemes and extended its support in uplifting the downtrodden in the society. The bank has
taken up, the assistance to various industrial and export sectors, as a thrust area and granted
loans to the needy clients. The level of advances which stood at Rs. 52 Lakhs in the year
1962 has spurted to above Rs. 10,871 Crores now. The bank has a sound portfolio of
advances consisting a wide basket of retail finance. The bank as a matter of policy grants
advances to retail segments consisting of retail traders and business enterprises.
Koushiki Choudhury (2007)1 in his study suggests that customers distinguish four
dimensions of service quality in the case of the retail banking industry in India, namely,
attitude, competence, tangibles and convenience. Identifying the underlying dimensions of
the service quality construct in the Indian retail banking industry is the first step in the
definition and hence provision of quality service. The paper has drawn upon the findings of
the service quality dimensions to contend the initiatives that bank managers can take to
enhance their employees' skills and attitudes and instill a customer-service culture.
Sandip Gosh Hasra and BL Srivastava (2009)2 in their study indicated that the bank
should pay attention to these dimension of service quality and pay more attention to
dimension of assurance-empathy to increase loyalty to a company, willingness to pay,
customer commitment and customer trust.
Sudesh (2007)3 revealed that poor service quality in public sector banks is mainly
because of deficiency in tangibility, lack of responsiveness and empathy. Private sector
banks, on the other hand, were found to be more reformed in this regards. Above all, the
foreign banks were relatively close to the expectations of their customers with regard to
various dimensions of service quality. Further, the study revealed that there existed service
1
KoushikiChoudhury (2007), Journal of Asia-Pacific Business, Volume 8, Issue 4 December
2007 , pp 21 – 38.
2Sandip Ghosh Hazra and Kailash BL Srivastava (2009) “Impact of service quality on
customer loyalty,commitment and trust in the Indian banking sector” ICFAI Journal of
Marketing Management, vol .3 Nos3&4, pp. 75-95.
3
Sudesh (2007) “Service quality in banks-A study in Haryana and Chandigarh”, NICE
quality variation across demographic variables and suggested that management of banks
should pay attention to potential failure points and should be responsive to customer
problems.
Joshua A J and Moli.P.Koshi(2005)4 in their study on „Expectation and perception of
service quality in old and new generation banks‟, observed that the performance of the new
generation banks across all the service quality dimensions are better than those of old
generation banks.
Al-Fazwan (2005)5 in his study found that the bank should concentrate on
accessibility dimension. He stated that the particular bank should take maximum efforts to
raise the level of services to meet out the customer expectations.
(Zeithamland Bitner 1996:117)6. Service quality is recognized as a multidimensional
construct. While the number of dimensions often varies from researcher to researcher, there is some consensus that service quality consists of three primary aspects: outcome quality, interaction quality, and physical service environment quality (Rust and Oliver 1994; Brady and Cronin 2001). Outcome quality refers to the customer's assessment of the core service which is the prime motivating factor for obtaining the services (e.g. hair cut, money received from ATM).
4Joshua A J, V Moli, P. Koshi (2005), “Expectation and perception of service quality in old
and new generation banks”, Indian Journal of Marketing,vol.37(3), pp. 18.
5
Al Fazwan- Indian Journal of Commerce & Management Studies ISSN – 2229-5674
6
3. RESEARCH OBJECTIVES AND METHODOLOGY
3.1 OBJECTIVES
The objective of the study is to find out the service quality gap that exists in the
private sector bank (TamilNad Mercantile Bank) while providing services to their
customer.
To find out the reason for the gap between standard quality and actual quality of
service delivered.
To identify the areas that needs to be improved by the bank to deliver superior quality
of service.
To analyze the existing problems and to evaluate suggestions for further
improvements in quality level of services.
3.2 SCOPE OF THE STUDY:
Considering the limitations of the study, a further study may be conducted with large
number of banks both private as well as public sector banks and the survey can be conducted
with large number of samples done at multiple locations. It may also take into consideration
not only the service quality gap prevailing at present but also from the view point of customer
satisfaction. The study may also be undertaken even at the level of international banking.
3.3 USEFULNESS OF THE STUDY:
Besides the above mentioned issues, advantages of service quality are other factors
encouraging the bank to present quality services. The study also indicates the factors that are
to be considered by the bank as to improve their level of quality in delivering the service. It
enables them to identify the reason for their weak performance and hence enabling them to
evaluate the same and take necessary initiatives to improve. It also provides the bank, a
chance to understand the customer needs and try to bridge the gap between the expectation
3.4 LIMITATIONS OF THE STUDY:
The study is limited to private sector bank with particular reference to Tamilnad
Mercantile Bank.
The study is confined only to Indian scenario, with Coimbatore city as the focal point
and to a specific branch.
Time limit is another constraint. Few numbers of respondents.
Customer expectations and Customer Perceptions are subjective and are in a state of
constant flux and change.
The findings therefore can be generalized to a given period, a pre-defined market, and
economic scenarios.
A longitudinal study could probably overcome or alleviate this limitation.
Geo-demographic could have a great deal of influence on the customer expectations and
perceptions.
It is also not amiss to mention here that the zone of tolerance could vary from one
customer to another. This variation has not been assessed in the current study.
3.5 METHODOLOGY
In this research the researcher studies the service quality gap of private bank in
Coimbatore city and by obtaining the opinion of the customers. Therefore this study is
descriptive in nature since it describes the opinion of the respondents (customers). Simple
random sampling is used to select the respondents. Data were collected from 90 respondents
by a well structure questionnaire was prepared covering the demographical profile of the
private bank customers and question covering, various attributes and factors related to
RATER dimensions of service quality containing constructs . Likert 5 point scales ranging
from strongly agree to strongly disagree were used to obtain the opinion on the expected
service quality. Similarly Likert 5 point scale ranging from extremely satisfied to extremely
dissatisfied was used to evaluate the opinion towards the perceived service quality. The
questionnaires were distributed to the customers who are the account holders of Tamilnad
As the population frame could not be properly defined during the period of collection
of data with regard to the customers. The respondent customers whom the research met
accidentally were included in the sample. Hence the sampling technique used in this study is
non-probability sampling. Hence the respondents were selected on the basis of convenience
sampling. Chi-square tests and percentage analysis have been employed to study between the
identified independent variables and the dependent variables such as quality gap.
PERCENTAGE ANALYSIS:
In this project percentage analysis was used. The percentage method is used to know
the accurate percentages of the data collected. It is simple to graph out through the
percentages.
The following formula is used to calculate it,
No of respondent
Percentage analysis = x 100
Total no. of respondents
From the above formula, we can get percentages of the data given by the respondents.
CHI-SQUARE TEST:
In this project chi-square test is used. This is an analysis of technique which analyzed
the stated data in this project. It analysis the assumed data and calculated in the study. The
chi-square test is an important test amongst the several tests of significant developed by
statistical. Chi- square, symbolically written as x2, is a statistical measure used in the context
of sampling analysis for comparing a variance to a theoretical variance.
Formula,
(O-E) 2
2=
E
O = Observed Frequency
CORRELATION:
Correlation analysis deals with the association between two or more variables. It does
not tell anything about cause and effect relationship.
Correlation is classified in two types as
Positive correlation and
Negative correlation
SPEARMAN Correlation method, it otherwise known as Rank correlation. It is defined by
the symbol „r‟. Formula,
6∑di2
r = 1- n(n2-1)
Correlation value shall always lie between +1 and -1. When r = 1, it shows there is perfect
position correlation between variables. When r = 0, there is no correlation.
ANOVA:
ANOVA is to test for differences among the means of the populations by examining
the amount of variation within each of these samples, relative to the amount of variation
between samples. In terms o variation within the given population, it is assumed that the
values of (Xij) differ from the mean of this population only because of random effects i.e.,
there are influences on (Xij) which are unexplainable, whereas in examining difference
between populations we assume that the difference between the mean of the jth population
and the grand mean is attributable to what is called a „specific factor‟ or what is technically
described as treatment effect.
STEPS INVOLVED IN ANOVA:
Calculate the ratio of F,
F= between column variants
within column variants
Compare the calculated value of F with the table value of F for the degrees of freedom
at certain critical level.
3.6 SOURCES OF DATA:
3.6.1 Secondary Sources
Information has been gathered from various journals like Guruvayur Institute of
Management Journal, Journal of Marketing, Vikalpa, Management Review, and Journal of
Marketing Research, The researcher has also referred to various websites that have previous
research studies and empirical investigations. Research carried out by, and by Morgan
Stanley along with Pantaloon‟s annual reports forms the basis of secondary data.
3.6.2 Primary Sources
A structured questionnaire was constructed taking into account SERVQUAL
dimensions such as Tangibles, Reliability, Responsiveness, Assurance, Empathy, other
dimensions like Customers perceptions of how the banks are taking initiative in providing
good services to customer and also to assess Customer Satisfaction. The method employed
4. DATA ANALYSIS AND INTERPRETATION
CLASSIFICATION OF RESPONDENTS ACCORDING TO THEIR GENDER:
The following table shows the classification of the respondents according to their gender such
as male and female.
TABLE: 4.1
TABLE SHOWING THE GENDER OF THE RESPONDENTS
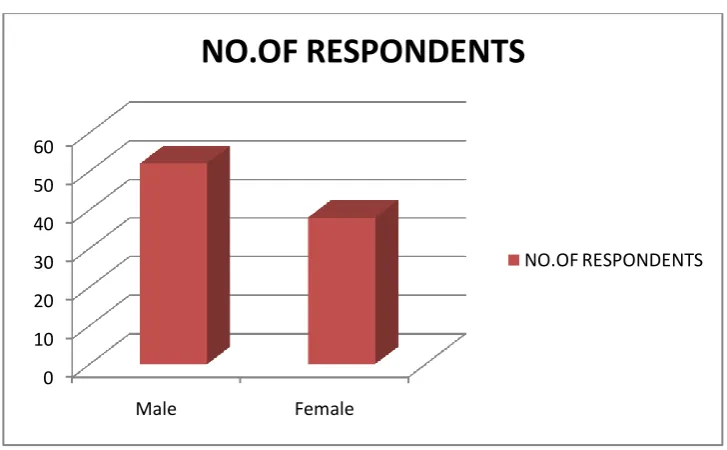
The above table shows the Gender of respondents, 57.8 percentage of the respondents
are male and 42.2 percentage of the respondents are female. This shows that the male
customers are in large in number to female relating to having a bank account.
CHART: 4.1
0 10 20 30 40 50 60
Male Female
NO.OF RESPONDENTS
NO.OF RESPONDENTS
S,NO GENDER NO.OF RESPONDENTS PERCENTAGE
1 Male 52 57.8
2 Female 38 42.2
CLASSIFICATION OF RESPONDENTS ACCORDING TO THEIR AGE
The respondents are classified on the basis of their age as below 20, 21-40, 41-60 and above
61.
TABLE: 4.2
TABLE SHOWING THE AGE OF THE RESPONDENTS
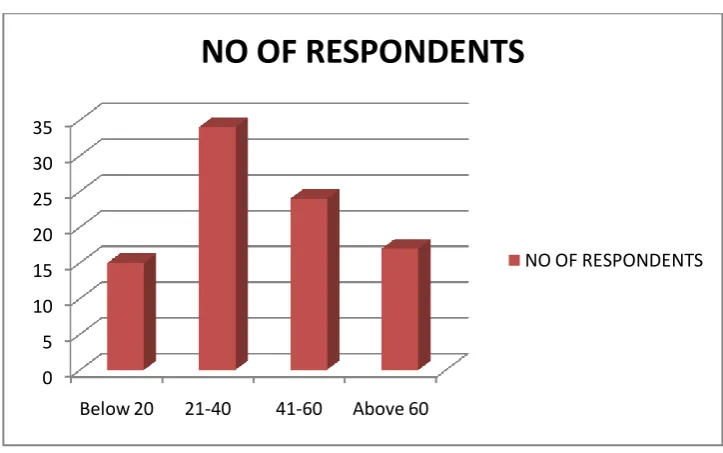
The above table shows the age of respondents, 16.7 percentage of the respondents
belong to the age group of below 20 years, 37.8 percentage belong to the age group between
21 and 40 years, 26.7 percentage of the respondents belong to the age group between 41 and
60 years and 18.9 percentage belong to the age group of above 61& above years. Therefore
the people between the age group of 21-40 preferred the banking services than other age
group people.
CHART: 4.2
0 5 10 15 20 25 30 35
Below 20 21-40 41-60 Above 60
NO OF RESPONDENTS
NO OF RESPONDENTS
S.NO AGE NO OF RESPONDENTS PERCENTAGE
1 Below 20 15 16.7
2 21-40 34 37.8
3 41-60 24 26.7
4 Above 60 17 18.9
CLASSIFICATION OF RESPONDENTS ACCORDING TO THEIR EDUCATION
The respondents are classified on the basis of their education as illiterate, HSC and graduate.
TABLE: 4.3
TABLE SHOWING THE EDUCATION QUALIFICATION OF THE RESPONDENTS
S.NO QUALIFICATION NO.OF RESPONDENTS PERCENTAGE
1 Illiterate 19 21.1
2 HSC 31 34.4
3 Graduate 40 44.4
Total 90 100
The above table shows the education qualification of respondents.21.1 percentage of
the respondents are illiterate, 34.4 percentage are with the education qualification of higher
secondary level. 44.4 percentage of the respondents are with the education qualification as
graduate.
CHART: 4.3
0 5 10 15 20 25 30 35 40
Illiterate HSC Graduate
NO.OF RESPONDENTS
CLASSIFICATION OF RESPONDENTS ACCORDING TO THEIR OCCUPATION The respondents are classified on the basis of their occupation as salaried person, business, professional, students and retired persons.
TABLE: 4.4
TABLE SHOWING THE OCCUPATION OF THE RESPONDENTS
S.NO OCCUPATION NO. OF RESPONDENTS PERCENTAGE
1 Salaried person 29 32.2
2 Business 22 24.4
3 Professional 14 15.6
4 Students 13 14.4
5 Retired person 12 13.3
Total 90 100
The above table shows the occupation of respondents, 32.2 percentage of the
respondents are salaried person, while 24.4 percentage of the respondents are doing business.
The professional respondents are of 15.6 percentage, 14.4 percentage of the respondents
belong to student category, while 13.3 percentage are of retired persons. The banking services
are much preferred by salaried respondents.
CHART: 4.4
NO. OF RESPONDENTS
CLASSIFICATION OF RESPONDENTS ACCORDING TO THEIR MONTHLY
INCOME
The respondents are classified on the basis of their monthly income as below 10000,
10001-25000, 25001- 50000, 50001-100000 and above 100000.
TABLE: 4.5
TABLE SHOWING THE MONTLY INCOME OF THE RESPONDENTS
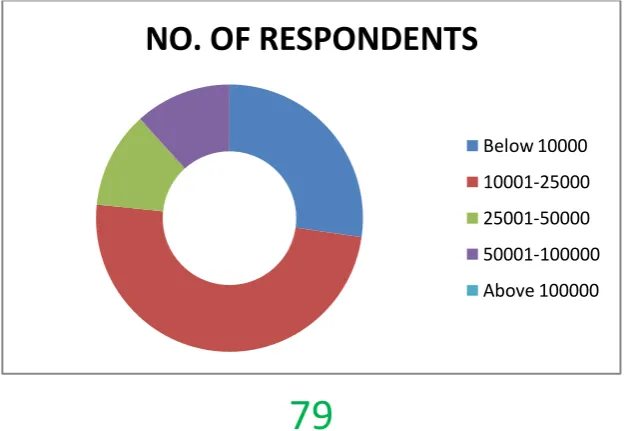
The above table shows the monthly income of respondents.27.3 percentage of the
respondents belongs to the income bracket of below 10000, 49.4 percentage were from
income group of 10001-25000. 11.7 percentage of the respondents belong to the income
bracket of 25001-50000, 11.7 percentage of the respondents fell under the income group of
between 50001-100000.14.4 percentage of the respondents fell under none of the category. It
can be concluded that most of the respondents in private sector banks belong to the income
group of between 10001-25000.
CHART: 4.5
NO. OF RESPONDENTS
Below 10000 10001-25000 25001-50000 50001-100000 Above 100000
S.NO INCOME NO. OF RESPONDENTS PERCENTAGE
1 Below 10000 21 27.3 2 10001-25000 38 49.4 3 25001-50000 9 11.7 4 50001-100000 9 11.7
5 Above 100000 0 0
CLASSIFICATION OF RESPONDENTS ACCORDING TO THE NATURE OF ACCOUNT
The respondents are classified on the basis of the nature of account that they have with the bank. The accounts are current account, fixed, savings, recurring and loan accounts.
TABLE: 4.6
TABLE SHOWING THE NATURE OF ACCOUNT OF THE RESOPONDENTS
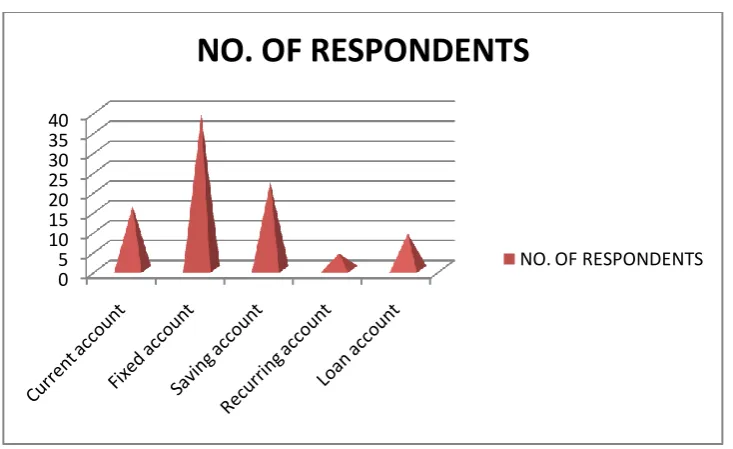
The above table shows the nature of account held by the respondents, 17.8 percentage
of the respondents have current account, 43.3 percentage of the respondents hold fixed
account, 24.4 percentage have savings account, 4.4 percentage of the respondents hold
recurring and the rest 10 percentage of the respondents have loan account in the bank. Here
most of the respondents hold fixed deposit account.
CHART: 4.6
0 5 10 15 20 25 30 35 40
NO. OF RESPONDENTS
NO. OF RESPONDENTS
S.NO NATURE OF ACCOUNT NO. OF RESPONDENTS PERCENTAGE
1 Current account 16 17.8 2 Fixed account 39 43.3 3 Saving account 22 24.4 4 Recurring account 4 4.4
5 Loan account 9 10
CLASSIFICATION OF RESPONDENTS ACCORDING TO THE REASON FOR MAINTAING THE ACCOUNT
The respondents are classified on the basis of the reason for maintaining the account.
TABLE: 4.7
TABLE SHOWING THE REASON FOR MAINTAINING THE ACCOUNT
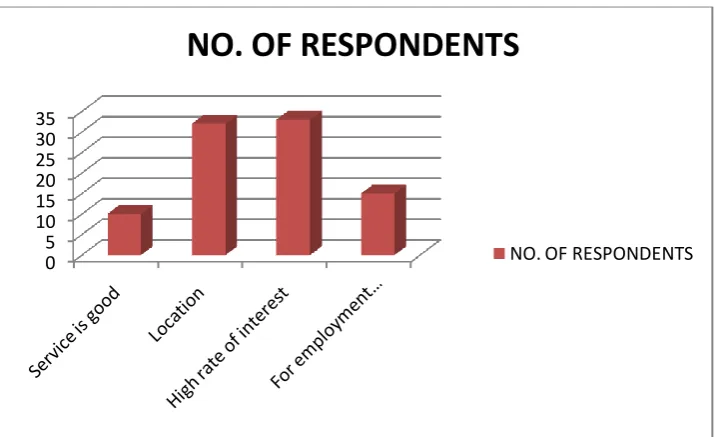
S.NO REASON FOR MAINTAINING THE ACCOUNT NO. OF RESPONDENTS PERCENTAGE
1 Service is good 10 11.1
2 Location 32 35.6
3 High rate of interest 33 36.7 4 For employment purpose 15 16.7
Total 90 100
The above table shows the reason for which the customers are maintaining the
account. 11.1 percentage of the respondents have said the reason that the service is good,
35.6 percentage have said location is the reason, 36.7 percentage have said high rate of
interest and16.7 for employment purpose.
CHART: 4.7
0 5 10 15 20 25 30 35
NO. OF RESPONDENTS
CLASSIFICATION OF RESPONDENTS ACCORDING TO THEIR AWARENESS The respondents are classified on the basis of the awareness among them.
TABLE: 4.8
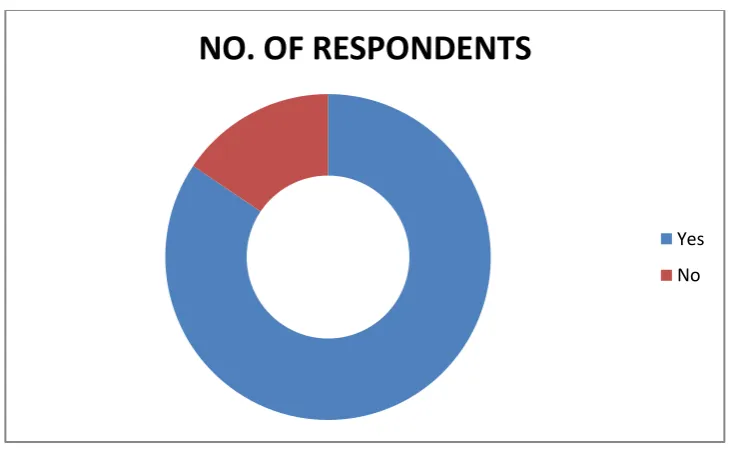
TABLE SHOWING THE AWARENESS OF THE RESPONDENTS
S.NO AWARENESS NO. OF RESPONDENTS PERCENTAGE
1 Yes 76 84.4
2 No 14 15.6
Total 90 100
The above table shows how many customers are aware of the services provided by the
bank. 84.4 percentage of the respondents are fully aware about the services offered while
15.6 percentage of the respondents have said that they are unaware.
CHART: 4.8
NO. OF RESPONDENTS
CLASSIFICATION OF RESPONDENTS OF HOW THEY COME TO KNOW ABOUT THE SERVICES
The respondents are classified on the basis of the source.
TABLE: 4.9
TABLES SHOWING THE SOURCE THROUGH WHICH THE RESPONDENTS CAME TO KNOW ABOUT THE SERVICES
S.NO SOURCE NO. OF RESPONDENTS PERCENTAGE
1 Magazine 18 20
2 News paper 41 45.6
3 Internet 4 4.4
4 Friend 24 26.7
5 Financial advisor 3 3.3
Total 90 100
The above table shows how the customers came to know about the various services
provided by the bank.20 percentage of the respondents have said that they came to know
through Magazine while 45.6 percentage of the respondents have said that they came to know
through Newspaper and 4.4 percentage through Internet, 26.7 percentage through Friends and
the remaining 3.3 through Financial advisor
CHART: 4.9
NO. OF RESPONDENTS
Magazine News paper Internet Friend
CLASSIFICATION OF RESPONDENTS ACCORDING TO THE SERVICES THEY PREFER
The respondents are classified on the basis of the services they prefer.
TABLE: 4.10
TABLE SHOWING THE SERVICES THE RESPONDENTS PREFER
S.NO PREFERENCE NO.OF RESPONDENTS PERCENTAGE
1
Transfer fund
online 8 8.9
2 Withdrawals 24 26.7
3 Deposits 55 61.1
4 Share payments 3 3.3
Total 90 100
The above table shows the services preferred by the customers. 8.9percentage of the respondents prefer transfer fund online, 26.7 percentage prefer withdrawals, 61.1 percentage prefer deposits, 3.3 percentage of the respondents prefer share payments.
CHART: 4.10
0 10 20 30 40 50 60
NO.OF RESPONDENTS
CLASSIFICATION OF RESPONDENTS ACCORDING TO THE FACILITIES USED The respondents are classified on the basis of the facilities they use.
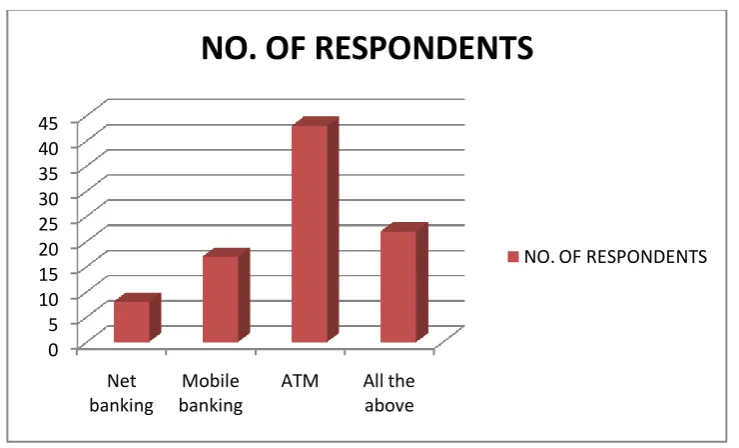
TABLE: 4.11
TABLE SHOWING THE FACILITIES USED BY RESPONDENTS
The above table shows the facilities used by the customers.8.9 percentage of the
respondents use net banking,18.9 percentage of the respondents use mobile banking,47.8
percentage use ATM and 24.4 of them use all the above.
CHART: 4.11
0 5 10 15 20 25 30 35 40 45
Net banking
Mobile banking
ATM All the above
NO. OF RESPONDENTS
NO. OF RESPONDENTS
S.NO FACILITIES USED NO. OF RESPONDENTS PERCENTAGE
1 Net banking 8 8.9 2 Mobile banking 17 18.9
3 ATM 43 47.8
4 All the above 22 24.4
CLASSIFICATION OF RESPONDENTS ACCORDING TO THEIR ABILITY TO USE THE FACILITIES WITHOUT ANY REFERENCE
The respondents are classified on the basis their ability to use the facilities without any reference.
TABLE: 4.12
TABLE SHOWING THE RESPONDENTS ABILITY TO USE THE FACILITIES WITHOUT ANY REFRENCE
S.NO ABILITY TO USE NO. OF RESPONDENTS PERCENTAGE
1 Yes 78 86.7
2 No 12 13.3
Total 90 100
The above table shows the percentage of respondents who have said that they can use
the facilities without any reference.86.7percentage of the respondents have said yes. 13.3
percentages of the respondents have said no.
CHART: 4.12
NO. OF RESPONDENTS
CLASSIFICATION OF RESPONDENTS AS TO WHETHER IS THERE ANY STAFF WITH WHOM THEY CAN CONSULT FOR HELP
The respondents are classified on the basis of the staff whom they consult for help
TABLE: 4.13
TABLE SHOWING THE RESPONDENTS AS TO WHETHER THE STAFF WITH
WHOM THEY CAN CONSULT FOR HELP
S.NO CONSULT HELP NO. OF RESPONDENTS PERCENTAGE
1 Yes 7 4.6
2 No 5 3.3
Total 12 7.9
The above table shows the percentage of respondents who have said that they can ask
for help.92.2percentage of the respondents have not selected any of the options.4.6
percentage of the respondents have said yes and 3.3 percentage of the respondents have said
no.
CHART: 4.13
NO. OF RESPONDENTS
Yes No
100
CLASSIFICATION OF RESPONDENTS ON THE BASIS OF THEIR VIEWS ON THE BANK OFFICIALS AS TO WHETHER THEY MAKE IMPROVEMENTS The respondents are classified on the basis of their views about the improvements made by the bank officials.
TABLE: 14.4
TABLE SHOWING RESPONDENTS VIEWS ON THE IMPROVEMENTS MADE BY
THE BANK OFFICALS
The above table shows the percentage of respondents who have given their views as
to whether the bank officials make improvement in service.11.1 percentage of the
respondents have strongly agreed,30 have agreed,40 have said it as neutral,13.3 have
disagreed and 5.6 percentage have strongly disagreed.
CHART: 4.14
0 5 10 15 20 25 30 35 40
NO.OF RESPONDENTS
NO.OF
RESPONDDENTS
S.NO IMPROVEMENTS NO.OF RESPONDDENTS PERCENTAGE
1 Strongly agree 10 11.1
2 Agree 27 30
3 Neutral 36 40
4 Disagree 12 13.3
5 Strongly disagree 5 5.6
CLASSIFICATION OF RESPONDENTS ON THE BASIS OF THEIR OPINION ON STAFF EFFICIENCY
The respondents are classified on the basis of their opinion on staff efficiency
TABLE: 4.15
TABLE SHOWING THE RESPONDENTS OPINION ON THE STAFF EFFICIENCY
The above table shows the percentage of respondents who have given their opinion on
staff efficiency, 22.2 percentage of the respondents have said very prompt, 46.7 have said
prompt, 31.1 have said it as slow.
CHART: 4.15
NO. OF RESPONDENTS
Very prompt Prompt Slow
S.NO OPINION NO. OF RESPONDENTS PERCENTAGE
1 Very prompt 20 22.2
2 Prompt 42 46.7
3 Slow 28 31.1
CLASSIFICATION OF RESPONDENTS ON THE BASIS OF THEIR OPINION ON CUSTOMER SERVICE DEPARTMENT
The respondents are classified on the basis of their opinion on the customer service department.
TABLE: 4.16
TABLE SHOWING THE RESPONDENTS OPINION ON THE CUSTOMER
SERVICE DEPARTMENT
S.NO OPINION NO. OF RESPONDENTS PERCENTAGE
1 Very much satisfied 8 8.9
2 Satisfied 28 31.1
3 Average 30 33.3
4 Dissatisfied 14 15.6 5 Very much dissatisfied 10 11.1
Total 90 100
The above table shows the percentage of respondents who have given their opinion on
customer service department,8.9 percentage of the respondents have said very much
satisfied,31.1 have said satisfied ,33.3 have said it as average, 15.6 have said as dissatisfied
and 11.1 percentage have said it as very much dissatisfied.
CHART: 4.16
0 5 10 15 20 25 30
NO. OF RESPONDENTS
CLASSIFICATION OF RESPONDENTS AS TO WHETHER THEY WILL SWITCH TO COMPETITOR BANK THAT OFFERS MORE BENEFIT
The respondents are classified on the basis whether they will switch to competitor bank that offers more benefit.
TABLE: 4.17
TABLE SHOWING THE RESPONDENTS WHO WILL SWITCH TO
COMPETITOR BANK
S.NO SWITCH TO NO. OF RESPONDENTS PERCENTAGE
1 Strongly agree 29 32.2
2 Agree 21 23.3
3 Neutral 18 20
4 Disagree 12 13.3
5 Strongly disagree 10 11.1
Total 90 100
The above table shows the percentage of respondents who have said that
they will switch to competitor bank that offers them more benefits.32.2 percentage of the
respondents have strongly agreed,23.2 have agreed,20 have said neutral, 13.3 have disagreed
and 11.1 percentage have strongly disagreed.
CHART: 4.17
0 5 10 15 20 25 30
NO. OF RESPONDENTS
CLASSIFICATION OF RESPONDENTS ACCORDING TO THE PARAMETERS THAT ARE IMPORTANT TO THEM
The respondents are classified on the basis of the parameters that are important to them
TABLE: 4.18
TABLE SHOWING THE RESPONDENTS PARAMETERS THAT ARE
IMPORTANT TO THEM
S.NO PARAMETERS NO. OF RESPONDENTS PERCENTAGE
1 Good care by banker 15 16.7 2 Brand/image of the bank 13 14.4 3 Price and fees of products and services 21 23.3 4 Safety and security 25 27.8 5 Wide range of products and services 16 17.8
Total 90 100
The above table shows the percentage of respondents who have said that the following
parameters are important to them.16.7 percentage of the respondents have said good care by
the banker, 14.4 have said brand/image of the bank is important to them, 23.3 have said price
and fees of the products and services, 27.8 have said safety and security and 17.8 percentage
have said wide range of products and services.
CHART: 4.18
0 5 10 15 20 25
NO. OF RESPONDENTS
CLASSIFICATION OF RESPONDENTS ACCORDING TO THE DEGREE OF SATISFACTION
The respondents are classified on the basis of the degrees of satisfaction.
TABLE: 4.19
TABLE SHOWING THE RESPONDENTS DEGREE OF SATISFACTION
S.NO DEGREE OF SATISFACTION NO. OF RESPONDENTS PERCENTAGE
1 Excellent 10 11.1
2 Very good 29 32.2
3 Good 27 30
4 Average 12 13.3
5 Poor 12 13.3
Total 90 100
The above table shows the percentage of respondents according to the degree of
satisfaction which they have received.11.1 percentage of the respondents have received
excellent satisfaction, 32.2 have received very good satisfaction, 30 have received good
satisfaction, 13.3 have received average satisfaction and 13.3 percentage are poorly satisfied.
CHART: 4.19
NO. OF RESPONDENTS
CLASSIFICATION OF RESPONDENTS ACCORDING TO THEIR OPINION ON COST OF SERVICE
The respondents are classified on the basis of their opinion on the cost of service.
TABLE: 4.20
TABLE SHOWING THE RESPONDENTS OPINION ON THE COST OF SERVICE
S.NO OPINION NO. OF RESPONDENTS PERCENTAGE
1 High 25 27.8
2 Economical 35 38.9
3 Normal 26 28.9
4 Moderate 4 4.4
Total 90 100
The above table shows the percentage of respondents according to their opinion on
cost of service.27.8 percentage of the respondents have received its high,38.9 have said as
economical,28.9 have said normal, 4.4 have said moderate.
CHART: 4.20
0 5 10 15 20 25 30 35
NO. OF RESPONDENTS
DIFFERENCE BETWEEN NATURE OF ACCOUNT AND REASON FOR
MAINTAINING THE ACCOUNT
H0- There is no significant relationship between Nature of account and reason for
maintaining the bank account.
H1 - There is a significant relationship between Nature of account and reason for maintaining
the bank account.
TABLE NO: 4.21
Nature of account*Reason Cross tabulation
Chi-square Test
Calculated value= 38.926
Degrees of freedom= (R-1) (C-1)
Reason
Service is
Good
Location High rate of
Interest
For Employment
Purpose
Total
Nature of
Account
Current
a/c
5 6 0 5 16
Fixed a/c 2 10 21 6 39
Savings
a/c
0 7 12 3 22
Recurring
a/c
0 3 0 1 4
Loan a/c 3 6 0 0 9
Total 10 32 33 15 90
Value Df
= (5-1) (4-1) = 12.
Table value= 21.026
INTERPRETATION
The calculated value 38.926 is greater than the table value 21.026, hence we reject the
hypothesis. So we conclude that there is a significant relationship between Nature of account
DIFFERENCE BETWEEN CUSTOMER SERVICE DEPARTMENT AND
ADDRESSED PROPERLY
H0- There is no significant relationship between customer service department and complaints
addressed properly.
H1 - There is a significant relationship between customer service department and complaints
addressed properly.
TABLE NO: 4.22
Customer service department* Addressed properly Cross tabulation
Chi-square Test
Calculated value= 61.515
Addressed Properly Total
Strongly
Agree
Agree Neutral Disagree Strongly
disagree
Customer
Service
Department
Very much
satisfied
0 4 4 0 0 8
Satisfied 3 14 11 0 0 28
Average 2 11 17 0 0 30
Dissatisfied 0 1 4 3 6 14
Very much
dissatisfied
0 1 2 4 3 10
Total 5 31 38 7 9 90
Degrees of freedom= (R-1) (C-1)
= (5-1) (5-1) = 16.
Table value= 26.296
INTERPRETATION
The calculated value 61.515 is greater than the table value 26.296, hence we
reject the hypothesis. So we conclude that there is a significant relationship between customer
CORRELAION BETWEEN FACILITIES AND DEGREES OF SATISFACTION
H0- Facilities provided by the bank is positively correlated with the degrees of satisfaction.
H1 - Facilities provided by the bank is negatively correlated with the degrees of satisfaction.
TABLE NO: 4.23
Source:*complied from primary data
INTERPRETATION
The correlation between the facilities provided and the degrees of satisfaction is .076
which shows a positive correlation between the variable studied. Stastically their relationship
holds a positive relationship. Therefore it could be concluded that the customers who use the
facilities provided by the bank are highly satisfied. Alternative hypothesis is rejected and null
hypothesis is accepted.
Correlations
Facilities
Degree of satisfaction
Facilities Pearson Correlation 1 .076
Sig. (2-tailed) .478
N 90 90
Degree of satisfaction
Pearson Correlation .076 1
Sig. (2-tailed) .478
CORRELAION BETWEEN IMPROVEMENT AND BANKING PROBLEMS
H0- The improvement made by the bank officials is positively correlated with banking
problems and issues addressed by the bank staff.
H1 - The improvement made by the bank officials is negatively correlated with banking
problems and issues addressed by the bank staff.
TABLE NO: 4.24
Source:*complied from primary data
The correlation between the improvement made by the bank officials and the banking
problems and issues addressed by the bank staff is .460 which shows a positive correlation
between the variable studied. Stastically their relationship holds a positive relationship.
Therefore it could be concluded that the banking problems and issues are being considered by
the bank officials and thus the improvements are made. Alternative hypothesis is rejected and
null hypothesis is accepted.
Correlations
Improvement
Banking Problems
Improvement Pearson Correlation 1 .460
Sig. (2-tailed) .000
N 90 90
Banking Problems Pearson Correlation .460 1
Sig. (2-tailed) .000