MapFactory – Towards a mapping design pattern for big
geospatial data
Victoria Rautenbach,
aSerena Coetzee
aa Centre for Geoinformation Science, Department of Geography, Geoinformatics and Meteorology, University of Pretoria, Pretoria, South Africa
Abstract: With big geospatial data emerging, cartographers and geographic information scientists have to find new ways of dealing with the volume, variety, velocity, and veracity (4Vs) of the data. This requires the development of tools that allow processing, filtering, analysing, and visualising of big data through multidisciplinary collaboration. In this paper, we present the MapFactory design pattern that will be used for the creation of different maps according to the (input) design specification for big geospatial data. The design specification is based on elements from ISO19115-1:2014 Geographic information -- Metadata -- Part 1: Fundamentals that would guide the design and development of the map or set of maps to be produced. The results of the exploratory research suggest that the MapFactory design pattern will help with software reuse and communication. The MapFactory design pattern will aid software developers to build the tools that are required to automate map making with big geospatial data. The resulting maps would assist cartographers and others to make sense of big geospatial data.
Keywords: Cartography, Map design, Design pattern, Big data, Standardisation
1.
Introduction
Today, ever increasing volumes of data are generated continuously by a large variety of sensors, including smartphones, social media users, global positioning systems (GPSs) and radio-frequency identification (RFID) tags. This results in huge volumes of complex datasets that have become known as ‘big data’. The following characteristics distinguish big data from other data: volume, variety, velocity, and veracity (4Vs) (Saha and Srivastava 2014; Tsou 2015; Ward and Barker 2013). Big data presents challenges for the storing, analysis, visualisation and presentation of data using traditional tools and processes designed for much smaller datasets. In many cases, big data includes a direct or indirect reference to a location on the Earth which is referred to as ‘big geospatial data’. Cartographers and geographic information scientists have to find new ways of dealing with the 4Vs of big geospatial data. At the same time, the variety characteristic of big data calls for tools that allow processing, filtering, analysing, and visualising of big data through multidisciplinary collaborations (Tsou 2015).
Traditionally, methods and tools developed for cartography and geographic information systems (GIS) were developed for individuals and not for collaborative work (MacEachren 2001). However, with technological advances, such as distributed systems, Web 2.0 and cloud computing, tools for collaborative cartography have emerged and gained popularity. Additionally, tools that automate the mapping process, for example, automating the creation of a map to visualise big data, are becoming more apparent. In related work, Rautenbach et al. (2013) developed and evaluated ThematicWS, a web service that
orchestrating implementations of Open Geospatial Consortium (OGC) standard web services.
Software design patterns arose, amongst others, from architects who argued that judging the beauty of a building is not only a matter of taste; they argued that the quality of the design can also be objectively assessed. This idea was transferred to software design in the 1990s (Shalloway and Trott 2004) and many software design patterns have been described since then. Each pattern describes the commonalities in the features of the problem to be solved. The patterns allow developers to design software in terms of patterns: patterns are identified and specific solutions are created based on these patterns. It is important to note that even if the pattern is used repeatedly to solve a common problem, the outcome, the building or software artifact, may be totally different. Among the benefits attributed to studying software design patterns are that design patterns provide a higher perspective on analysis and design, and design patterns improve communication and individual learning. The research presented in this paper transfers the idea of design patterns to map design.
2.
Background
2.1 Cartographic design process
Cartography is generally defined as the science and art of making maps. Before the 1960s, cartography was focused on manufacturing of maps (Kraak and Ormeling 2003). Due to advancements in computer science and more focus on communication science, cartography is now seen as conveying spatial information by means of a map (Kraak and Ormeling 2003; MacEachren 1995). Cartography encapsulates all the tools and processes involved in the production of all types of maps (Bolstad 2012; Slocum et al. 2009). Tyner (2010) extends the definition to include the design, compilation, construction, projection, reproduction, use, and distribution of the map.
The primary aim of cartography is to communicate geospatial information by means of a map. In order to achieve this aim, the intended audience, information to be communicated, and area of interest need to be identified (Bolstad 2012; Kraak and Ormeling 2003; Slocum et al. 2009; Tyner 2010). These aspects affect other cartographic design decisions, such as the type of map, scale and symbols. In recent years, the volumes of geospatial data have increased rapidly, and developing suitable tools and methods for using and interpreting these volumes of data has become ever more important. The type of map selected to represent the information contributes to, and aids in, the interpretation of the map and is thus an important consideration in cartographic design for big geospatial data (Rita et al. 2010).
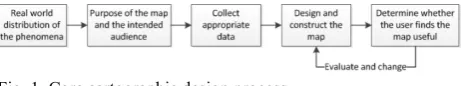
Fig. 1. Core cartographic design process
Fig. 1 shows the core cartographic design process adapted from various researchers (MacEachren 1995; Slocum et al. 2009; Tyner 2010). The process is generally represented in a linear fashion (even though some parts of the process may happen in parallel) and designed with an individual cartographer in mind. Although two or more processes can occur in parallel, this representation of the cartographic design process does not show the parallelism. This can be contributed to the fact that mapmaking used to be a manual and paper-based process, where any changes to a hardcopy map implied starting the process anew. Additionally, the core process does not include enough information to be a step-by-step guidance for non-cartographers, such as environmental scientists or civil engineers, involved in map-making. Similarly, the process does not contain enough details for computer scientists to allow them to design software tools for the automation of the process.
2.2 Software design patterns
Shalloway and Trott (2004) defines a pattern as “a solution to a problem in a context”. A design pattern describes a reusable solution for a problem that occurs commonly (Lasater 2010; Shalloway and Trott 2004). In software engineering, design patterns are developed by
examining solutions to common problems in existing software, and best practices developed by programmers. Additionally, design patterns also illustrate the advantages of object-orientated programming. Thus, simply stated design patterns are tools to improve code and allow for reusability. Design patterns are generally grouped into the following types: creational, behavioural and structural patterns. Creational patterns are useful when multiple instances of an object need to be rendered, stored or duplicated. Behavioural patterns facilitate communication between classes and perform algorithmic calculations. Lastly, structural patterns enable the modification of the structure of the code.
Design patterns have been used successfully for information visualisation. Heer and Agrawala (2006) stated that design patterns are a useful means of capturing tested design solutions and allow for the reuse of these solutions. According to them, despite a diversity of software architectures supporting information visualisation, it is often difficult to identify, evaluate, and re-apply the design solutions implemented within such frameworks. To overcome this, they described successful solutions as design patterns. These abstract descriptions of interacting software components could then be customized to solve design problems within a particular context. Stolte et al. (2002) used design patterns to design multiscale visualisations of general relational databases. Chen (2004) described visualisation design patterns with the aim of improving development productivity and usage effectiveness in dynamic, analytical data visualisation. The patterns summarize many common practices and techniques used in the process of dynamic, analytical data visualisation.
Based on these examples of using design patterns for information visualisation, it holds that design patterns could also be useful for geovisualisation, i.e. for map making. This paper ventures into this new territory by describing MapFactory, a creational design pattern for map design.
2.3 Overview of International Organization for Standardization (ISO) standards in the field of geographic information
The international organization for standardization (ISO) was founded in 1947 and has since become the world’s largest developer of voluntary standards covering all aspects of technology and business (http://www.iso.org). The technical committee within the ISO for standardisation in the field of geographic information, ISO/TC 211 Geographic information/Geomatics was established in 1994 (http://www.isotc211.org).
Metadata provides a mechanism to locate and understand geospatial data and services.
A data product specification is closely related to the metadata standard (refer to Fig. 2). ISO 19131 Geographic information - Data product specification describes requirements of geographic data products, based upon concepts defined in other standards in the ISO geographic information suite of standards (ISO 19131:2007). The standard can be used to define a detailed description of a dataset or dataset series together with additional information that will enable it to be created, supplied to and used by another party.
Fig. 2. Relationship of data product specification to metadata (ISO 19131:2007)
3.
MapFactory, a mapping design pattern for
big geospatial data
In this section, we follow the method proposed by Shalloway and Trott (2004) for describing a design pattern. In 3.1, the concepts (commonalities) and concrete implementations (variabilities) in the problem domain (map making) are identified. Entities in the problem domain that are not included in these concepts (e.g., some one-of-a-kind maps) are identified. Then, after the concept for the required functionality (automated map making) has been identified, the interfaces for the abstractions that encapsulate this are specified in 3.2. 3.1 Commonalities and variabilities in the cartographic design process
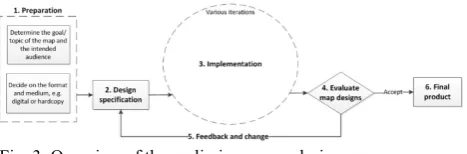
The cartographic design process described in this section draws on cartography and geographic information standards. Fig. 3 provides an overview of the cartographic design process that consists of the following main steps (adapted from Kraak and Ormeling, 2003): 1) preparation, 2) design specification, 3) implementation, 4) evaluate map design, 5) feedback and changes if required, and 6) the final product. This depiction of the process presents commonalities in the map design process and does not specify the details of implementation steps, such as analysing the data or selecting colour schemas. These details depend on the specific type of map, i.e. the details are variabilities. Fig. 4 provides a more detailed depiction of the map design process.
Fig. 3. Overview of the preliminary map design process Referring to Fig. 3, each of the main steps are discussed regarding their potential to be automated for map design and map making.
1) Preparation (requires user intervention):
The preparation requires user intervention, as the cartographer or designer will need to establish the
intent or message of the map that needs to be developed. This is the most important step of the process, as this determines all design and implementation choices that follow. To ensure increased collaboration between the team members, techniques such as design thinking or the agile approach could be employed. With design thinking, the focus is on exploring the problem in more detail while conceptualising radical solutions that build on the strengths of the diverse team (Dorst 2011; Lindberg et al. 2011). The agile approach is more focused on fast incremental delivery of the final product, which is achieved through short sprints to implement certain aspects of the final product (Lindberg et al. 2011) 2) Design specification (requires user intervention, but a
standard template for the specification is possible): For the design specification, ISO 19131, Geographic information - Data product specification, could be used. Additionally, elements from both the metadata standard (ISO19115-1:2014), the portrayal standard (ISO 19117:2012), OGC styled layer descriptor (Open Geospatial Consortium 2007), and OGC symbol encoding (Open Geospatial Consortium 2006) can be used to describe the map design.
A map has a number of characteristics, and for the design specification template, each of these characteristics should be evaluated to determine if the characteristic is mandatory for describing a map. For example, the data source and bounding box of the area of interest would be mandatory characteristics in any map design specification and should therefore be included in the template. Mapping or matching these characteristics to metadata elements in ISO 19115-1:2014 facilitates a map design specification that can be used in software applications.
3) Implementation (automated with minimal user intervention):
The implementation of the design specification can be automated using the mapping design pattern, MapFactory, described in 3.2.
4) Evaluate map design (requires user intervention): The proposed mapping design pattern produces a map configured by parameters specifying certain design aspects, such as the colour scheme. The map is then evaluated by the user (i.e. cartographer or designer) to ensure that all the requirements are met and that the map successfully communicates the intended message. The latter is a subjective assessment requiring human intervention.
5) Feedback and change (requires user intervention): If the map produced in step 4 (evaluate map design) turns out to be insufficient or inappropriate, changes to the design specification can be made and the automated process of map making (step 3) is then repeated. 6) Final product:
cartographic design process ends and the map is the final product.
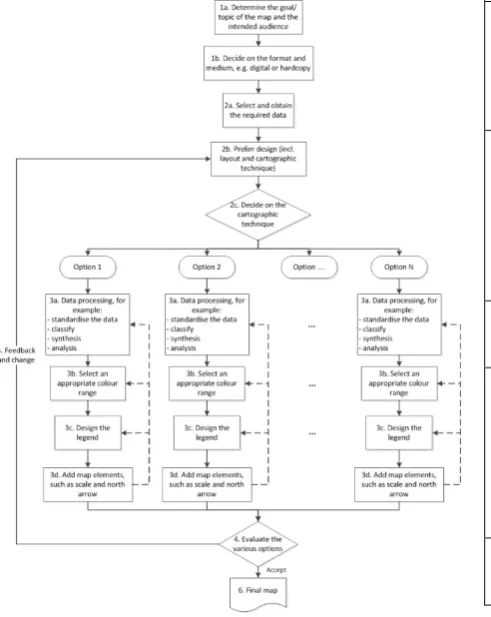
The description of this process shows that there is commonality in the order of steps and in the design specification (step 2). The implementation (step 3) depends on the input or configuration parameters in the design specification; depending on these, different kinds of maps have to be produced, of which each may involve different methods and algorithms. Due to human intervention, step 1 (preparation), step 4 (evaluation) and step 5 (feedback and change) require much variability.
Fig. 4. Detailed cartographic design process. Adapted from Tyner (2010) and Rautenbach et al. (2013)
3.2 Towards a mapping design pattern
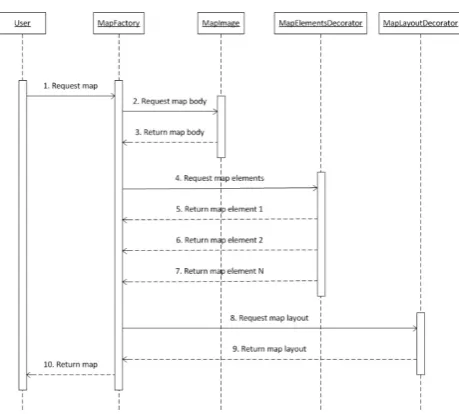
In this section, the mapping design pattern is presented at a high level of abstraction, making use of a sequence diagram and a class diagram in the Unified Modelling Language (UML). Refer to Fig. 5 and Fig. 6. MapFactory is a domain-specific creational design pattern based on the Factory pattern and the Decorator pattern. The MapFactory pattern will be used for the creation of different maps according to the (input) design specification.
The Factory pattern was selected as is creates a template of a specific class, in this case the map, that is customised according to the specified requirements, in this case the map design specification. This pattern was extended with the Decorator pattern that allows client-specific dynamic objects to be added to the map. Refer to Table 1 for an overview of the proposed mapping design pattern.
The MapFactory design pattern makes it possible to separate the content (big geospatial data) from the presentation (map). The MapImage class generates the map image, while the MapElementsDecorator class adds map elements, such as the scale bar or legend, to the map. A MapElement class will be required for each map element to be generated. The map image and map elements are then combined and arranged in a map layout that is generated by the MapLayoutDecorator class.
Item Description
Pattern name MapFactory
Intent Create a map from big geospatial data Problem Maps are generally created by repeating the
same steps numerous times until a desired design solution is obtained. This process can be time consuming and user interaction intensive. With the design pattern, some steps in the process can be automated. Solution The proposed MapFactory design pattern,
allows the user to develop a standard design specification that will then be used to produce a series of maps. From this series, the final product can be selected or changes can be made to the original design specification until a desired design solution is developed.
Participants and
collaborators
MapImage, MapElementsDecorator,
MapLayoutDecorator
Consequences The proposed MapFactory design pattern reduces user intervention in the process. Although this is useful for non-cartographers, it might not be welcomed by cartographers, who view map-making as an art. However, the automation also makes it possible to design tools for big geospatial data.
Implementation The MapFactory design pattern instantiates a map that consists of a map layout, map image and various map elements.
Table 1. Overview of the MapFactory design pattern
Fig. 6. Sequence diagram of the mapping design pattern
4.
Conclusions
In this paper, we provided a first high level description of MapFactory, a mapping design pattern. The MapFactory design pattern is based on commonalities (e.g. characteristics that describe a map design) and variabilities (different types of maps and map symbology) in the problem domain of map making. It makes use of two existing design patterns, Factory and Decorator. Based on examples of the usefulness of design patterns for information visualisation, we decided to explore the use of design patterns for geovisualisation, i.e. for map making. The results of the exploratory research presented in this paper show that the high level description of the mapping design pattern helps with reuse and communication: reusing the Factory and Decorator design patterns avoids ‘reinventing the wheel’ when designing software to automate map making. ‘Converting’ the cartographic design process described by cartographers into a mapping design pattern that can be understood and used by software developers, facilitates communication between cartographers and software developers. The mapping design pattern helps software developers to understand what map making entails, so that they are in a position to develop tools for automating map making from big geospatial data. The MapFactory design pattern develops the map or set of maps according to a design specification based on elements from the metadata standard (ISO19115-1:2014), the portrayal standard (ISO 19117:2012), OGC styled layer descriptor (Open Geospatial Consortium 2007), and OGC symbol encoding (Open Geospatial Consortium 2006) standards. Mapping or matching the map characteristics to the metadata elements in ISO 19115-1:2014 facilitates a map design specification that can be used in software applications to automate map making for big geospatial data.
In future work, we plan to refine the MapFactory design pattern, amongst others, for different kinds of maps, such as choropleth or proportional symbol maps. Furthermore, the design pattern needs to be verified by implementing
software according to the design patterns. A suitably refined and verified mapping design pattern will help software developers to build the tools that are required to automate map making with big geospatial data, thus allowing cartographers and others to make sense of big geospatial data.
5.
References
Bolstad, P. (2012). GIS Fundamentals: A First text on Geographic Information Systems (4th ed.). St. White Bear, United States of America: Eider Press.
Chen, H. (2004). Towards Design Patterns for Dynamic Analytical Data Visualization. Proceedings of SPIE Visualization and Data Analysis, 18 January 2004, San Jose, United States of America.
Dorst, K. (2011). The core of “design thinking” and its application. Design Studies, 32(6), 521–532.
Heer, J., & Agrawala, M. (2006). Software Design Patterns for Information Visualization. IEEE Transactions on visualization and computer graphics, 12(5), 853–860.
Kraak, M-J., & Ormeling, F. (2003). Cartography: visualization of geospatial data. Essex, England: Pearson Education.
Lasater, C. G. (2010). Design patterns. Texas: United States of America: Jones and Bartlett Learning.
Lindberg, T., Meinel, C., & Wagner, R. (2011). Design Thinking: A Fruitful Concept for IT Development? In Design Thinking. Berlin, Heidelberg: Springer Berlin Heidelberg.
ISO 19115-1: 2014 (2014). Geographic information - Metadata -- Part 1: Fundamentals, International Organization for Standardisation (ISO), Geneva, Switzerland.
ISO 19131: 2007 (2007). Geographic information - Data product specifications, International Organization for Standardisation (ISO), Geneva, Switzerland.
ISO 19117: 2012 (2012). Geographic information -
Portrayal, International Organization for
Standardisation (ISO), Geneva, Switzerland.
MacEachren, A. M. (1995). How Maps Work: Representation, Visualization and Design. New York, United States of America: The Guilford Press.
MacEachren, A. M. (2001). Progress reports Cartography and GIS: extending collaborative tools to support virtual teams. Progress in Human Geography, 25(3), 431–444. Open Geospatial Consortium (2006). Symbology Encoding Implementation Specification 1.1.0, available online at http://www.opengeospatial.org/standards/se, accessed 26 October 2016.
Open Geospatial Consortium (2007). Styled Layer Descriptor profile of the Web Map Service
Implementation Specification, available online
at http://www.opengeospatial.org/standards/sld, accessed 26 October 2016.
maps in a spatial information infrastructure. Computers, Environment and Urban Systems, 37(1), 107–120. Rita, E., Borbinha, J., & Martins, B. (2010). Extending
SLD and SE for cartograms. In FOSS4G 2010. 6–9 September 2010, Barcelona, Spain.
Saha, B., & Srivastava, D. (2014). Data quality: The other face of Big Data. Proceedings - International Conference on Data Engineering, 1294–1297.
Shalloway, A., & Trott, J. (2004). Design Patterns Explained: A New Perspective on Object-Oriented Design. Boston, United States of America: Addison-Wesley Professional.
Slocum, T. A., McMaster, R. B., Kessler, F. C., & Howard, H. H. (2009). Thematic cartography and geovisualization. Upper Saddle River, United States of America: Prentice Hall.
Stolte, C., Tang, D., & Hanrahan, P. (2002). Multiscale visualization using data cubes. IEEE Symposium on Information Visualization (InfoVis), 7-14 January 2002, Boston, United States of America.
Tsou, M-H. (2015). Research challenges and opportunities in mapping social media and Big Data. Cartography and Geographic Information Science, 42(sup1), 70–74.
Tyner, J. (2010). Principles of Map Design. New York, United States of America: The Guilford Press.