A compact pulsatile simulator based
on cam‑follower mechanism for generating
radial pulse waveforms
Tae‑Heon Yang
1, Gwanghyun Jo
2, Jeong‑Hoi Koo
3, Sam‑Yong Woo
4, Jaeuk U. Kim
5and Young‑Min Kim
5*Abstract
Background: There exists a growing need for a cost‑effective, reliable, and portable pulsation simulator that can generate a wide variety of pulses depending on age and cardiovascular disease. For constructing compact pulsation simulator, this study pro‑ poses to use a pneumatic actuator based on cam‑follower mechanism controlled by a DC motor. The simulator is intended to generate pulse waveforms for a range of pulse pressures and heart beats that are realistic to human blood pulsations.
Methods: This study first performed in vivo testing of a healthy young man to collect his pulse waveforms using a robotic tonometry system (RTS). Based on the collected data a representative human radial pulse waveform is obtained by conducting a math‑ ematical analysis. This standard pulse waveform is then used to design the cam profile. Upon fabrication of the cam, the pulsatile simulator, consisting of the pulse pressure generating component, pressure and heart rate adjusting units, and the real‑time pulse display, is constructed. Using the RTS, a series of testing was performed on the proto‑ type to collect its pulse waveforms by varying the pressure levels and heart rates. Fol‑ lowed by the testing, the pulse waveforms generated by the prototype are compared with the representative, in vivo, pulse waveform.
Results: The radial Augmentation Index analysis results show that the percent error between the simulator data and human pulse profiles is sufficiently small, indicating that the first two peak pressures agree well. Moreover, the phase analysis results show that the phase delay errors between the pulse waveforms of the prototype and the representative waveform are adequately small, confirming that the prototype simulator is capable of simulating realistic human pulse waveforms.
Conclusions: This study demonstrated that a very accurate radial pressure waveform can be reproduced using the cam‑based simulator. It can be concluded that the same testing and design methods can be used to generate pulse waveforms for other age groups or any target pulse waveforms. Such a simulator can make a contribution to the research efforts, such as development of wearable pressure sensors, standardization of pulse diagnosis in oriental medicine, and training medical professionals for pulse diagnosis techniques.
Keywords: Radial pulsation simulator, Cam, Radial artery pressure waveform, Augmentation index
Open Access
© The Author(s) 2019. This article is distributed under the terms of the Creative Commons Attribution 4.0 International License (http://creat iveco mmons .org/licen ses/by/4.0/), which permits unrestricted use, distribution, and reproduction in any medium, provided you give appropriate credit to the original author(s) and the source, provide a link to the Creative Commons license, and indicate if changes were made. The Creative Commons Public Domain Dedication waiver (http://creat iveco mmons .org/publi cdoma in/zero/1.0/) applies to the data made available in this article, unless otherwise stated.
RESEARCH
*Correspondence: [email protected] 5 Future Medicine Division, Korea Institute of Oriental Medicine (KIOM), 1672 Yuseongdaero, Yuseong‑gu, Deajeon 34054, Republic of Korea
Background
The importance of monitoring artery-related factors such as arterial pressure waveform and pulse wave velocity has steadily increased in the medical science and healthcare fields [1–3]. Among the factors for health monitoring, the radial pressure waveform is a surrogate marker for estimating the central aortic pressure and predicting cardiovas-cular diseases [4–6]. Thus, in recent years, the need for radial artery monitoring sen-sors is rapidly increasing in order to measure radial pulsation waveforms, which can vary according to human race, sex, age, and health conditions, such as arterial stiffness [7,
8]. To effectively measure the radial artery pulse waveforms, there have been numer-ous research studies on flexible and wearable sensing technologies. These studies aimed at developing skin-attachable blood pressure sensors with superior sensing properties along with mechanical flexibility and robustness, thus enabling real-time blood pressure measurement or monitoring. Recently, numerous nanomaterials including nanowires [9], carbon nanotubes [10], polymer nanofibers [11], metal nanoparticles [12], and gra-phene [13] were tested in the design of wearable blood pressure sensors.
With the rapid increase in the research and development of wearable blood pressure sensors, the demand for securing the measurement accuracy of the wearable sensors has also been increased considerably. The accuracy of blood pressure measurement is criti-cally important for the commercial use of such wearable sensors. In the case of hyper-tension, a 5-mmHg error in blood pressure measurements may double the number of patients diagnosed with hypertension, or even reduce it by half [14]. Despite the impor-tance of measurement accuracy, few studies exist on the evaluation and improvement of wearable sensors’ measurement accuracy. Ideally, for such studies, clinical trials with large numbers of patients are the best way to examine the accuracy of wearable sensor measurements. However, often times, a large-scale human subject testing is limited due to high cost and time constraints. As an alternative to clinical testing, mechanical simu-lators capable of accurately regenerating standardized radial pulsation waveforms with a variety of different pulse features can be a good means of investigating and improving the measurement accuracy of wearable sensors.
Currently, several simulators generating blood pressure waveforms have been devel-oped. They are mainly based on a mechanism circulating viscous fluids similar to blood. ViVitro Labs, Inc., developed an endovascular simulator that can generate pulsatile flow and blood pressure waveforms similar to those of the human body [15]. This simula-tor is characterized as a super pump that generates a pulsating flow, and the generated pulsatile flow passes through a viscoelastic impedance adapter, a pump head, and a com-pliance chamber to an aortic anatomical model. Lee et al. developed a cardiovascular simulator for studying the depth, the rate, the shape, and the strength of radial pulses [16]. The simulator is comprised of a pulse generating part, a vessel part, and a meas-urement part. Chang et al. developed a pulse simulator based on a hydraulic control method [17]. The developed simulator can adjust the characteristic parameters of the pulse wave by manipulating the opening time of the hydraulic valve and the hydraulic pressure intensity. Tellyes Scientific, Inc., developed a pulse-training simulator (Victor Pulse) [18]. It was developed to realize 26 pulse waveforms using a method of circulating fluid and opening and closing multiple valves to produce a desired waveform.
Current pulse simulators, including simulators developed in above mentioned studies, are complex, bulky, and expensive. In most simulators, the method of controlling the fluid to generate the blood pressure waveform is a quite complicated. Even if sophis-ticated and expensive simulators, they have limitations in generating a wide range of radial pulse waveforms, which may be hundreds depending on human race, sex, age, and health conditions, by adjusting several valves and flow rates. Note that it is extremely difficult to control the reflected waves sporadically generated in the liquid. In addition, liquid-based simulators, in particular for portable ones, pose potential problems such as distortion of pressure waveforms due to cavitation and the leakage of liquid.
The primary goal of this study is to develop a cost-effective and portable blood pulse simulator that can accurately and repetitively generate a human radial pulse waveform. To this end, it proposes to use a cam-follower mechanism to generate radial artery wave-form. The proposed simulator adopts a pneumatic-driven mechanism to avoid the prob-lem of pressure wave reflection, bubbles, and leakage produced in a liquid-driven device. In this study, a cam profile is determined based on a “standard” radial pulse waveform obtained by in vivo testing of a healthy young man in his 20 s. To demonstration pur-pose, only one cam is fabricated, but the proposed simulator is designed to easily replace the cam with other types of cams to generate other radial pulse waveforms. The design includes a DC motor connected to the cam and follower mechanism that pushes a pis-ton into a cylinder to simulate the heart beat rate with its speed. The design also includes a “diastolic” chamber to adjust the pulse pressure of the waveforms. Using the prototype simulator, a serious of testing was performed to evaluate its performance in generating radial pulse waveforms. These waveforms were compared with the human pulse profile.
Methods
Data collection of human pulse waveforms
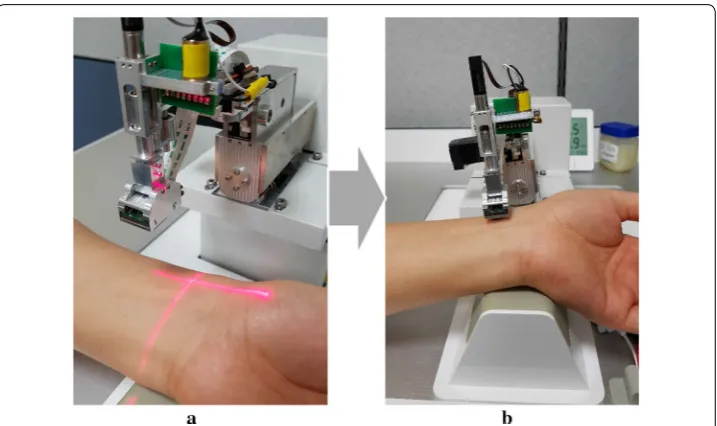
The reference input signal of a radial pulse waveform was acquired from the clinical data of a healthy young adult because the second peak of the pulse waveform was apparently observed in young people [19, 20]. As shown in Fig. 1, the robotic tonom-etry system (RTS), developed by the authors at Korea Institute of Oriental Medicine in South Korea, was utilized to obtain the radial pulse waveform with high precision by autonomously detecting the exact pulsation positions and precisely pressurizing the radial artery using a 6-DOF robotic manipulator including one redundant actua-tor [21]. A pulse sensor array with six pressure sensory channels was attached to the end effector of the RTS to maintain a constant posture and contact force on the radial artery [22]. A 3-DOF motorized stage moved the center position of the pulse sen-sor to the exact pulsation position. The contact directions between the pulse sensen-sor and the skin surface were controlled by two harmonic-driving actuators without gear backlash. A ball-screw typed linear actuator was used to precisely control the contact force of the pulse sensor.
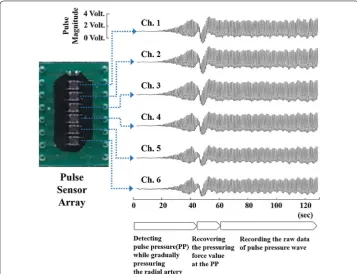
Figure 2 shows the raw data of the pulse wave measured from the time that the pulse sensor reached for the wrist skin surface to pressurize the artificial radial artery. The pulse sensor incrementally pressed the radial artery until it found the pulse pres-sure (PP) that was the maximum value of the first peak magnitudes. When the PP was detected, the tonometry device maintained the contact force for about 60 s to reliably record the raw signals of the radial artery pulse waveform at the PP. The final reference signal of the radial artery pulse waveform was obtained by averaging the 40 pulse waveforms recorded in the steady-state region.
Data processing for obtaining representative waveform
Forty consecutive pulses of the steady state were extracted from the pressure wave-forms measured on the wrist of a human subject using the RTS, and the selected pulses were used to generate representative waveforms. In order to calculate the representa-tive waveform effecrepresenta-tively, first, each pulse is normalized to have the same period: T = 1. The function representing the normalized 40 pulses and the mean value are defined as
ui:T→R , (i = 1,…, 40) and u:T→R, respectively. In the mean value u , the value of
the radial augmentation index (AI), which is the most important statistical value for evaluating the clinically important arterial stiffness, is relatively small, and thus the mean value could not be used as a representative waveform. Therefore, the minimization problem expressed by Eq. (1) using the total error E(u) was defined to obtain the
repre-sentative waveform that maximally preserved the value of the radial AI.
Here, RI is the mean value of the radial AI of ui(i=1,. . ., 40) , and RI(u) is the radial AI
of the u function. If the value of α in E(u) is set to a sufficiently large constant, the solution (1)
MinimizeE(u)=
EL2(u)2+(αERI(u))2
in u∈L2(T), where
L2error of total waveform:EL2(u)=
1 40
i=1,...,40
∫
T
(ui−u)2
Error of radial AI:ERI(u)=
RI−RI(u).
minimizing E(u) can preserve the value of the radial AI because Eq. (1) becomes a
pen-alty problem using the radial AI. Thus, the solution obtained by solving the minimization problem, Eq. (1), in the N-dimensional space of the discrete Fourier series function can be used as a representative waveform. To solve Eq. (1), the mean value of the pressure pulse u
is used as the initial guess after it is represented by a N-dimensional discrete Fourier series function, as shown in Eq. (2). Then, using an iterative method based on a line search, the coefficients ak and bk in Eq. (2) are updated in each iteration step. Here, the dimension of
the Fourier series function is set to a sufficiently large value of 10 so that the Fourier series function can accurately form a representative waveform:
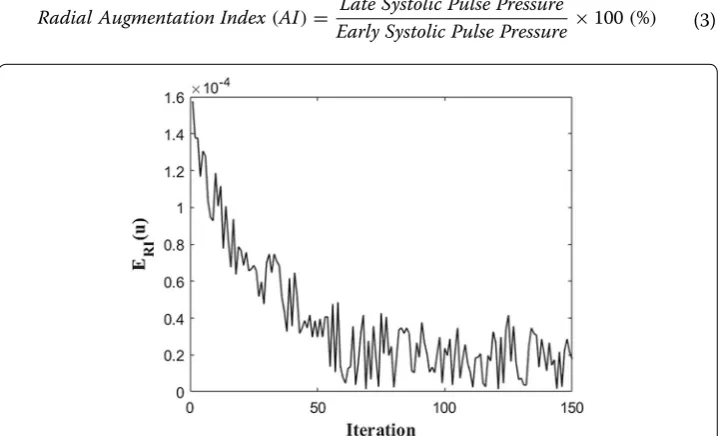
The objective of the minimization problem, Eq. (1), is to find the Fourier series equation that most closely matches the human measured data while minimizing the relative error of the radial AI. Therefore, when the evolution of ERI(u) is plotted in Fig. 3 while solving the
minimization problem using iterative methods. As shown in Fig. 3, 150 iterations were per-formed so that the relative error of the radial AI could be sufficiently reduced to 0.00247%. Through this iteration process, the coefficients of the Fourier series function of Eq. (2) are obtained as shown in Table 1. In addition, the L2 error of the total waveform, EL2(u) , is
3.64%, which means that the representative waveform is well matched to the average wave-form of ui.
The coefficients of Table 1 determined through the minimization problem are applied to the representative waveform Eq. (2), and the equation is plotted as shown in Fig. 4. In Fig. 4, the value of the radial augmentation index defined by Eq. (3) is calculated as 73.3%, which is similar to the average radial AI of men (69.5% ± 16.3%, [5]). Therefore, it was confirmed that the representative waveform obtained by the Fourier series preserved the average radial AI of men.
(2)
u(θ )=a0+ n
k=1
akcos
k Tθ
+bksin
k Tθ
(3)
Radial Augmentation Index(AI)= Late Systolic Pulse Pressure
Early Systolic Pulse Pressure ×100(%)
Fabrication of three‑peak cam‑based pulsation simulator
In order to convert the Fourier series equations (Fig. 4) obtained from the human data continuously measured by RTS into a three-peak circular shape, the normalized period (Fig. 4) is converted to 360°, and the shape of the cam is schematized as shown in Fig. 5a. This schematized three-peak cam design was fabricated through a wire-cutting machining process of nonmagnetic and high-rigidity material, stainless-steel 304, as shown in Fig. 5b.
To design a device capable of regenerating human-like pulse pressure using the fabricated three-peak cam, the cam was mounted on a DC motor (Maxon Motor, DCX 26 L), and a cylinder/piston module capable of repeating compression and ten-sion according to the shape of the cam during rotation was mounted in connection
Table 1 Coefficients of Fourier series
Symbol Value Symbol Value
a0 0.9490
a1 0.5150 b1 0.5873
a2 0.2893 b2 0.1871
a3 0.2838 b3 0.0459
a4 0.1498 b4 − 0.0032
e5 0.1227 b5 − 0.1109
a6 0.1177 b6 − 0.0743
a7 0.0569 b7 − 0.0196
a8 0.0105 b8 − 0.0086
a9 0.0008 b9 − 0.0043
a10 0.0056 b10 − 0.0007
with the cam, as shown in Fig. 6. Here, in order to measure and display the heart rate, a Hall sensor capable of measuring the rotational speed of the DC motor was installed. An additional small cylinder/piston module was installed to control the diastolic pressure by adjusting the amount of air in the cylinder.
In order to facilitate the RTS or human to detect the pulse pressure wave gener-ated when the air in the cylinder is compressed by the piston connected to the cam, a silicon artificial blood vessel was connected to the end of the cylinder, and the blood vessel was supported by an artificial wrist bone for tonometry and was sur-rounded by silicone skin (3B Scientific, W19310).
To monitor the air pressure inside the cylinder in real time, a small pressure sensor (Honeywell, 40PC006G) was connected to the cylinder by a tube, and the measured pulse pressure value was displayed on the LCD screen in real time. The micropro-cessor was built in the housing and was used to calculate the pulse pressure, dias-tolic pressure, and mean pressure from the measured pulse pressure waveform value in real time. These values were displayed on the screen.
Fig. 5 Three‑peak cam obtained from the Fourier series equations: a three‑peak circular cam design, b
fabricated three‑peak cam
Results
Evaluation of developed simulator using robotic tonometry system
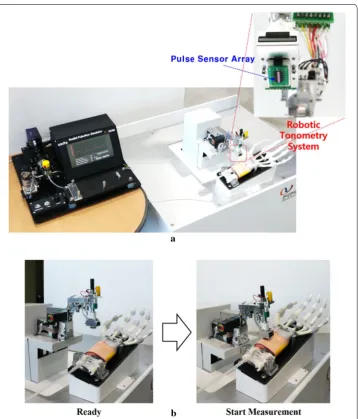
To verify that the developed cam-based pulsation simulator can accurately reproduce the average radial pulse profile of a human measured by RTS, the radial pulse gener-ated at the wrist region of the simulator was measured again using RTS. Figure 7 shows the overall experimental setup for evaluating the developed simulator. The simulator’s wrist part was laid and fixed on the base plate of the RTS similar to the location of the human arm. The developed simulator can modulate the pulse pressure and heart rate generated by the cam-based mechanism by changing the length of the air tube and the rotational speed of the cam. In the experiments, the simulator pulse pressure increased from 50 to 60 mmHg, and the heart rate values increased from 65 to 75 bpm. The gener-ated radial pulse was measured by RTS. While working for 5 min, the simulator showed
Fig. 7 Evaluation of the developed simulator by the robotic tonometry system: a measurement setup, b
a repeatability of CV = 0.23% and CV = 0.82% for the heart rate and the pulse pressure, respectively.
As shown in Fig. 8, since the artificial arm of the simulator was fixed on the base of the robotic tonometry device, the contact force direction of the pulse sensor could be kept constant when the pulse sensor surface angles with the gravitational axis were controlled by the constant target values α =− 5.0° and β = 2.0°. In the experiment, the two contact angles between the pulse sensor surface and the base plane of the simulator were con-trolled with error bounds of ± 0.21° and ± 0.37°, respectively.
Figure 9 shows the raw data of the pulse wave measured from the time that the pulse sensor reached the artificial wrist surface to the pressurization of the artificial radial artery. The center of the pulse sensor was laid on the same contact point of the surface, and the radial artery was incrementally pressured until the maximum pulse pressure val-ues were found. When the maximum pulse pressure was detected, the tonometry device maintained the contact force for about 30 s to reliably record the raw signals of the maximum pulse pressure of the radial artery pulse. Approximately 30 pulse waveforms obtained in the reliable region were averaged to analyze the dynamic characteristics between the artificial radial pulse and the reference signal obtained from clinical data.
Fig. 8 Representation of the definitions of the two vertical contact angles for defining the contact direction with the radial artery
Analysis
In order to analyze how accurately the developed cam-based pulsation simulator can regenerate the human representative radial pulse waveforms shown in Fig. 4, error anal-yses were performed among the representative pulse waveforms of the human (Fig. 4), the pulse wave measured by the RTS on the skin above the simulator wrist (Fig. 9), and pressure sensor outputs built into the simulator’s vessel.
First, these error analyses were performed by comparing the radial AI calculated from each radial pressure waveform. This is because the radial AI has a significantly high cor-relation with the central aortic AI, which is a very important indicator for predicting cardiovascular diseases such as atherosclerosis and vascular aging [5, 23, 24]. Next, these error analyses were also conducted by comparing the phase delay between the first peaks of the representative human pulse wave and the simulator’s measured pulse data.
The first peak of the radial artery pressure waveform was used to reconstruct the early systolic shoulder of the aortic pressure wave through a generalized transfer function [6]. Since the upstroke slope of the early systolic shoulder is related to the left ventricular contractility whose abnormality can initiate a clinically significant heart failure syn-drome [25, 26], the slope of the first peak as well as the magnitude ratio (radial AI) were evaluated to be in good agreement with the upstroke slope of the representative human waveform.
Radial augmentation index (AI)
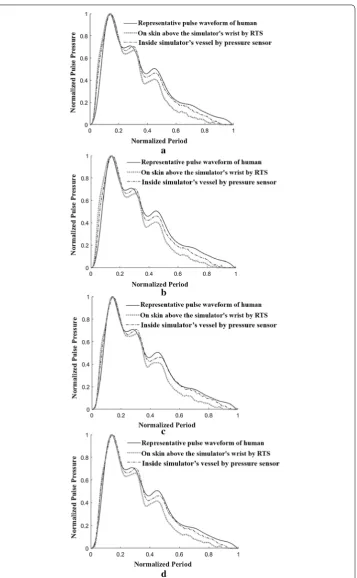
For the various comparative analyses shown in Fig. 10, the heart rate was adjusted to 65 bpm and 75 bpm by changing the rotational speed of the built-in motor in the sim-ulator. The pulse pressure was regulated to 50 mmHg and 60 mmHg, respectively, by adjusting the internal volume of the simulator. In each case, the measured pulses were stored using the RTS on the skin of the wrist of the simulator. At the same time, the pulses measured by a pressure sensor built into the simulator’s silicone vessel were stored. In each case, the average waveforms were generated from the stored pulses, and then the magnitude and period were normalized to 1 and compared with the representa-tive waveform of a human (Fig. 4) as shown in Fig. 10.
Figure 10a shows the results obtained by measuring the heart rate and pulse pressure of the simulator at 65 bpm and 50 mmHg, respectively. In the figure, the measured data with the RTS and pressure sensor were compared with the representative waveform of a human. Figure 10b shows the comparison results when the simulator heart rate and pulse pressure were set to 65 bpm and 60 mmHg, respectively, and Fig. 10c shows the comparison results at 75 bpm and 50 mmHg. Figure 10d shows the comparison results at 75 bpm and 50 mmHg.
Fig. 10 Comparison of pulse waveforms measured on a human’s wrist using RTS, on a simulator’s wrist using RTS and inside simulator’s vessel (tube) using a pressure sensor with varying heart rate and pulse pressure: a
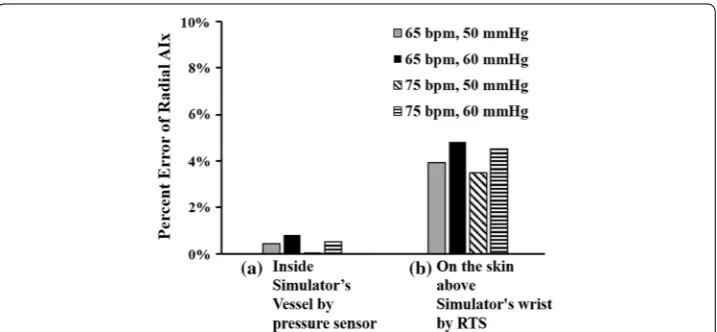
Figure 11a shows the error between the representative waveform of a human (Fig. 4) and the pressure waveform measured by a pressure sensor inside the simulator’s ves-sel in terms of the radial AI. Here, since the error value of the radial AI is very small at less than 8.14E−3, it was confirmed that the radial AI values of both waveforms were
matched well. On the other hand, in Fig. 11b, the error value of the radial AI between the representative waveform of a human (Fig. 4) and the waveform measured by the RTS on the skin of the wrist of the simulator was about 4.85E−2, which is relatively large. The reason why the error value (waveform measured by the RTS) is relatively large is that the proposed simulator generates the pressure waveform using air pressure instead of an incompressible liquid similar to blood. Because the compressibility of air is different from that of blood, the pressure waveform measured by the tonometry method using the RTS has a slightly different radial AI value from that of the human radial AI. Although this error value is larger than the value in Fig. 11a, this error value is small enough to conclude that the developed simulator can reproduce a pulse waveform similar to the human waveform while ensuring the value of the radial AI.
Phase Delay
As shown in Fig. 10, when comparing the upstroke slopes of early systolic pressure in the three measured waveforms, it can be seen that the slope of the representative pressure waveform of the human is the steepest. This is because the proposed simulator generates a pressure waveform by compressing and tensioning air instead of an incompressible liq-uid similar to blood. Owing to the nature of the air, which is a compressible flliq-uid, the slope of the upstroke becomes less steep, resulting in a phase delay. To ensure that this phase delay effect is small enough to be ignored, an error analysis of the phase delay was performed among the representative pulse waveforms of a human, the pulse wave meas-ured by the RTS on the skin above the simulator’s wrist, and the pressure sensor outputs built into the simulator’s vessel, as described in Fig. 10.
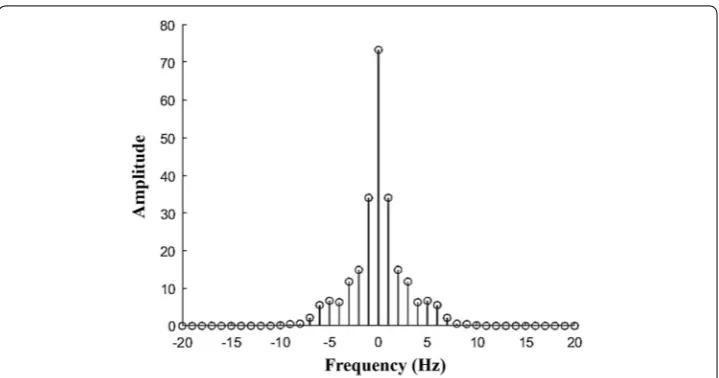
Figure 12 shows the amplitude of Fourier transform at each frequency in the frequency domain when a discrete Fourier transform was applied to the pulse waveforms measured
in the human and the simulator. The results of the discrete Fourier transform showed almost no difference between the amplitudes obtained from the human waveform and simulator waveform. The results also showed that the pulse waveforms measured in the human and the simulator had a dominant amplitude in the low-frequency range. Thus, we investigated the difference in phase angle at low frequencies of 1 Hz and 2 Hz to determine the phase delay between pulse waveforms.
If yh is the pulse shape of a human, and yc is the waveform generated by the cam
simu-lator, the discrete Fourier transform is defined as follows:
Here, xn=x/N (N = 200). If yhf and ycf in Eq. (4) are expressed in the complex
domain, the angles determined by the real parts and imaginary parts are denoted by
θyhf and θycf , respectively. Here, the phase angle delay is defined as Eq. (5):
At low frequencies of 1 Hz and 2 Hz, the phase angle delays are calculated as Eq. (6):
In four cases where the heart rate is adjusted to 65 bpm and 75 bpm and the pulse pres-sure is adjusted to 50 mmHg and 60 mmHg as shown in Fig. 10. Figure 13 illustrates the
(4)
yhf=
n=1,...,N
yh(xn)e−
2πi
N fn
ycf=
n=1,...,N
yc(xn)e−
2πi
N fn
(5)
Phase Angle Delay=θyhf−θycf
(6)
Phase Angle Delay(f=1Hz) =θ
yh(1)−θyc(1)
Phase Angle Delay(f=2Hz) =θ
yh(2)
−θyc(2)
phase angle at f =1Hz andf =2Hz of each pulse waveform measured in the human
and the simulator. In all figures, the difference in phase angle is positive, indicating that the phase of the waveform is delayed.
Figure 14 shows the error of the phase angle delay owing to heart rate and pulse pres-sure changes. The error value of the phase delay of the waveform meapres-sured on the skin of the simulator (Fig. 14b) is larger than the error value of the phase delay of the wave-form measured by the pressure sensor (Fig. 14a). The reason is that the proposed simula-tor produces a pressure waveform using air pressure with compressibility characteristics, which results in a decrease in the pressure transfer efficiency to the skin.
A maximum phase angle delay of 11.4° occurs at a heart rate of 65 bpm and a pulse pressure of 60 mmHg, as shown in Fig. 14b. This phase angle delay is small enough to be 3.2% when converted to a percentage error in one cycle (360°). As a result, the phase delay effect caused by using air instead of incompressible liquid in the proposed simula-tor is sufficiently small, thus proving that a very accurate pulse pressure waveform can be reproduced using the air-based three-peak cam simulator.
Conclusion
In this study, a radial pulsation simulator equipped with a cam mechanism was devel-oped and tested. The develdevel-oped simulator employed a pneumatic-driven mechanism to avoid the problems of liquid-driven devices, such as sporadic reflections of pressure waves, bubbles, and leakage. To design the cam profile, human pulse waveforms meas-ured by a robotic tonometry system were mathematically modeled as one representative waveform. The representative waveform for a 20-year old was then converted into the circular cam profile. A cam design with three peak points was machined and mounted on a simulator, consisting of a rotating motor, a cylinder/piston module, an artificial wrist, and an LCD display module. The experimental results show that the proposed cam simulator can reproduce human representative waveforms with considerably small errors for the radial augmentation index and the phase delay effect with a maximum of 4.9% and 3.2%, respectively.
In summary, this study successfully developed a radial pulsation simulator based on a cam mechanism, and it demonstrated that the prototype simulator can accurately repro-duce and control radial pulse waveforms, contributing to the advancement of a radial simulator that is cost-effective, portable, and reliable. Further work will be focusing on establishing representative radial pulse waveforms according to ages, race, and health conditions, and fabricating a cam with multiple peaks. Moreover, applications of the radial pulsation simulators equipped with a multiple-peak cam will be explored, includ-ing the verification of the computational simulation of blood flow, evaluation of wearable pressure sensors, studying the transfer functions or relationships between the radial and central pulse pressures, and training the pulse diagnosis of oriental medicine.
Authors’ contributions
T‑HY wrote the manuscript and designed and developed the pulse generation system, GJ mathematically modeled the radial artery pulse waveform and analyzed the performance of the developed system, J‑HK conducted the experiments for evaluating the simulator, S‑YW designed and developed the three‑peak cam‑follower mechanism, JUK designed the procedure for acquiring radial artery pulse waves from the robotic pulse tonometry device, Y‑MK managed the experi‑ ments and analysis of the developed system and contributed to writing and revising the manuscript. All authors read and approved the final manuscript.
Author details
1 Department of Electronic Engineering, Korea National University of Transportation, Chungju‑si, Chungbuk, Republic of Korea. 2 Department of Mathematical Sciences, KAIST, Daejeon, Republic of Korea. 3 Department of Mechanical and Manufacturing Engineering, Miami University, Oxford, OH, USA. 4 Center for Mechanical Metrology, KRISS, Dae‑ jeon, Republic of Korea. 5 Future Medicine Division, Korea Institute of Oriental Medicine (KIOM), 1672 Yuseongdaero, Yuseong‑gu, Deajeon 34054, Republic of Korea.
Acknowledgements
This work was supported by a Grant (K18022) from the Korea Institute of Oriental Medicine (KIOM), funded by the Korean government.
Competing interests
The authors declare that they have no competing interests. Availability of data and materials
The datasets generated and/or analyzed during the current study are available from the corresponding author on reasonable request.
Consent for publication Not applicable.
Ethics approval and consent to participate Not applicable.
Funding
This work was supported by a Grant (K18022) from the Korea Institute of Oriental Medicine (KIOM), funded by the Korean government.
Publisher’s Note
Springer Nature remains neutral with regard to jurisdictional claims in published maps and institutional affiliations.
Received: 4 October 2018 Accepted: 19 December 2018
References
1. Li C, Xiong H, Pirbhulal S, Wu D, Li Z, Huang W, Zhang H, Wu W. Heart‑carotid pulse wave velocity a useful index of atherosclerosis in chinese hypertensive patients. Medicine. 2015;94(51):e2343.
2. Li C, Xiong H, Wu W, Tian X, Wang Y, Wu D, Lin WH, Miao F, Zhang H, Huang W, Zhang YT. The relationship between heart‑carotid pulse transit time and carotid intima‑media thickness in hypertensive patients. J Hum Hypertens. 2015;29(11):663–8.
3. Nelson MR, Stepanek J, Cevette M, Covalciuc M, Hurst RT, Tajik AJ. Noninvasive measurement of central vas‑ cular pressures with arterial tonometry: clinical revival of the pulse pressure waveform? Mayo Clin Proc. 2010;85(5):460–72.
• fast, convenient online submission
•
thorough peer review by experienced researchers in your field
• rapid publication on acceptance
• support for research data, including large and complex data types
•
gold Open Access which fosters wider collaboration and increased citations maximum visibility for your research: over 100M website views per year
•
At BMC, research is always in progress.
Learn more biomedcentral.com/submissions
Ready to submit your research? Choose BMC and benefit from: 5. Katsuhiko K, Yasuharu T, Akira O, Yoshinori M, Tatsuya K, Tetsuro M. Radial augmentation index: a useful and easily
obtainable parameter for vascular aging. Am J Hypertens. 2005;18(1):11S–4S.
6. Kenji T, Hideyuki K, Naohisa S, Nobuhiro T, Akira Y. Relationship between radial and central arterial pulse wave and evaluation of central aortic pressure using the radial arterial pulse wave. Hypertens Res. 2007;30(3):219–28. 7. Kelly R, Hayward C, Avolio A, O’Rourke M. Noninvasive determination of age‑related changes in the human arterial
pulse. Circulation. 1989;80:1652–9.
8. Blood Pressure Monitoring Devices Market Size Report 2022. https ://www.grand viewr esear ch.com/indus try‑analy sis/blood ‑press ure‑monit oring ‑devic es‑marke t.
9. Kuniharu T, Toshitake T, Johnny CH, Hyunhyub K, Andrew GG, Paul WL, Ronald SF, Ali J. Nanowire active‑matrix circuitry for low‑voltage macroscale artificial skin. Nat Mater. 2010;9:821–6.
10. Darren JL, Michael V, Benjamin CKT, Sondra LH, Jennifer AL, Courtney HF, Zhenan B. Skin‑like pressure and strain sensors based on transparent elastic films of carbon nanotubes. Nat Nanotechnol. 2011;6:788–92.
11. Gao Q, Meguro H, Okamoto S, Kimura M. Flexible tactile sensor using the reversible deformation of poly (3‑hexylth‑ iophene) nanofiber assemblies. Langmuir. 2012;28:17593–6.
12. Maheshwari V, Saraf RF. High‑resolution thin‑film device to sense texture by touch. Science. 2006;312:1501–4. 13. Yao HB, Ge J, Wang CF, Wang X, Hu W, Zheng ZJ, Ni Y, Yu SH. A flexible and highly pressure‑sensitive graphene–poly‑
urethane sponge based on fractured microstructure design. Adv Mater. 2013;25:6692–8.
14. Turner M, Speechly C, Bignell N. Sphygmomanometer calibration—why, how and how often? Aust Fam Phys. 2007;36:834–7.
15. ViVitro Labs Inc., Endovascular Simulator. http://vivit rolab s.com/produ ct/endov ascul ar‑ev‑simul ator/.
16. Lee JY, Jang M, Shin SH. Study on the depth, rate, shape, and strength of pulse with cardiovascular simulator. Evid Based Complement Altern Med. 2017;2017:1–11.
17. 汤伟昌, 孙汉钧, 徐建国, 李斌芳: 中医脉象模拟系统的研究. 中国中医基础医学杂志. 2000, 6: 62–65. 18. Tellyes Scientific Co., Victor Pulse. http://telly es.ecbay .xyz/produ ct‑medic al‑scien ce/25246 79/victo r‑pulse .html. 19. Woo SH, Choi YY, Kim DJ, Bien F, Kim JJ. Tissue‑informative mechanism for wearable non‑invasive continuous blood
pressure monitoring. Sci Rep. 2014;4(6618):1–6.
20. Bae JH, Ku B, Jeon YJ, Kim H, Kim J, Lee H, Kim JY, Kim JU. Radial pulse and electrocardiography modulation by mild thermal stresses applied to feet: an exploratory study with randomized, crossover design. Chin J Integrat Med. 2017. https ://doi.org/10.1007/s1165 5‑017‑2972‑0.
21. Bae JH, Jeon YJ, Lee S, Kim JU. A feasibility study on age‑related factors of wrist pulse using principal component analysis. In: IEEE 38th annual international conference of the engineering in medicine and biology society. 2016. p. 6202–5.
22. Kim YM. Precise measurement method of radial artery pulse waveform using robotic applanation tonometry sensor. J Sens Sci Technol. 2017;26(2):135–40.
23. Schram MT, Henry RM, van Dijk RA, Kostense PJ, Dekker JM, Nijpels G, Heine RJ, Bouter LM, Westerhof N, Stehouwer CD. Increased central artery stiffness in impaired glucose metabolism and type 2 diabetes: the Hoorn Study. Hyper‑ tension. 2004;43:176–81.
24. Nichols WW, O’Rourke MF. McDonald’s blood flow in arteries. In: Theoretical, experimental and clinical principles, 4th Edn. London: Edward Arnold; 1998. p. 201–22.
25. Robert HT, Marcel ED. Arterial waveform analysis for the anesthesiologist: past, present, and future concepts. Anesth Analg. 2011;113(4):766–76.