M E T H O D O L O G Y
Open Access
Using principal component analysis to
reduce complex datasets produced by
robotic technology in healthy participants
Michael D. Wood
1, Leif E. R. Simmatis
1, J. Gordon Boyd
1,2,3, Stephen H. Scott
1and Jill A. Jacobson
4*Abstract
Background:The KINARM robot produces a granular dataset of participant performance metrics associated with proprioceptive, motor, visuospatial, and executive function. This comprehensive battery includes several behavioral tasks that each generate 9 to 20 metrics of performance. Therefore, the entire battery of tasks generates well over 100 metrics per participant, which can make clinical interpretation challenging. Therefore, we sought to reduce these multivariate data by applying principal component analysis (PCA) to increase interpretability while minimizing information loss.
Methods:Healthy right-hand dominant participants were assessed using a bilateral KINARM end-point robot. Subjects (Ns = 101–208) were assessed using 6 behavioral tasks and automated software generated 9 to 20 metrics related to the spatial and temporal aspects of subject performance. Data from these metrics were converted to Z-scores prior to PCA. The number of components was determined from scree plots and parallel analysis, with interpretability considered as a qualitative criterion. Rotation type (orthogonal vs oblique) was decided on a per task basis.
Results:The KINARM performance data, per task, was substantially reduced (range 67–79%), while still accounting for a large amount of variance (range 70–82%). The number of KINARM parameters reduced to 3 components for 5 out of 6 tasks and to 5 components for the sixth task. Many components were comprised of KINARM parameters with high loadings and only some cross loadings were observed, which demonstrates a strong separation of components.
Conclusions:Complex participant data produced by the KINARM robot can be reduced into a small number of interpretable components by using PCA. Future applications of PCA may offer potential insight into specific patterns of sensorimotor impairment among patient populations.
Keywords:KINARM, End-point robot, Principal component analysis, Data reduction
Background
Robotic technology, such as KINARM (BKIN Technolo-gies, Kingston, ON, Canada), provides objective metrics using the participants’upper limbs to assess propriocep-tion and sensorimotor funcpropriocep-tion, as well as executive function. In stroke survivors, this technology has identi-fied subtle neurocognitive deficits not apparent on rou-tine clinical testing [1], and various KINARM tasks have
been administered to multiple patient populations (e.g., traumatic brain injury, fetal alcohol spectrum disorder) [2–5]. The KINARM behavioral battery (KINARM Standard Tests™) currently consists of 9 tasks that include automated data analysis routines. Within each task, up to 20 performance items (e.g., reaction time) are calculated, leading to the potential generation of over 100 metrics per participant. However, when assessing performance deficits that are indicative of adverse neurological outcomes among participants, this granular and complex performance output may impede deriving meaningful interpretations.
* Correspondence:[email protected]
4Department of Psychology, Queen’s University, 318 Craine Hall, 62 Arch
Street, Kingston, ON K7L 3N6, Canada
Full list of author information is available at the end of the article
Principal component analysis (PCA) is a data reduc-tion technique used to identify linear combinareduc-tions of measured variables that account for the most overall variance in responses [6–8]. The first principal compo-nent accounts for the largest amount of variance, followed by the second, and so forth [9]. PCA is best used when the measured variables are theorized to be causal or formative indicators of the overarching con-struct rather than reflective or effects of it, which would be better assessed using factor analysis (FA). Because performance on the tasks determine a participant’s level of functioning rather than the other way around, PCA is the more appropriate technique for the KINARM battery than is FA.
The primary objective of this study was to reduce the dimensionality of healthy participant data produced by the KINARM End-Point robot by using PCA. This ana-lysis should increase overall interpretability by reducing redundant KINARM parameters into behaviorally mean-ingful components, which has the potential to demon-strate the clinical utility of PCA by capturing a minimal number of performance measures that could assist with the characterization of deficits among various patient populations.
Methods
Participant recruitment
Healthy participants were community-based and were randomly recruited via advertisements on lab and de-partmental websites, as well as in local classifieds (online and print). Trained research staff screened each adult participant (> 17 years old) to ensure that task instruc-tions could be easily understood, no prior neurological deficits were reported, and that subjects had no prior medical conditions that could affect upper limb mobility (see Additional file 1). Once enrolled, participants were then assessed by our research staff at one of two sites: Kingston Health Sciences Centre or Queen’s University, both sites in Kingston, ON, Canada. See Table2 for de-tailed demographics (e.g., age, gender, education). The Queen’s University and Affiliated Hospitals Health Sciences Research Ethics Board approved recruitment and assess-ment of these participants. Informed consent was obtained from each participant prior to the KINARM assessment.
Robotic assessment
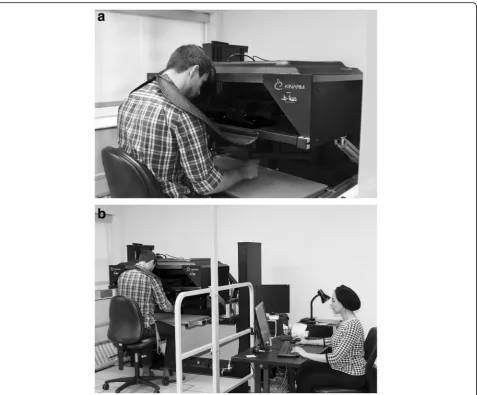
Participants were seated, in a height-adjustable chair that was locked in place, at a two-dimensional virtual reality system that displayed each task in the horizontal plane. As shown in Fig. 1, participants’ vision of their hands and arms was occluded, their head was positioned in the center of the visual field, and visual feedback of hand position (when provided) was represented on the screen by a white circle. Participants were instructed to grasp
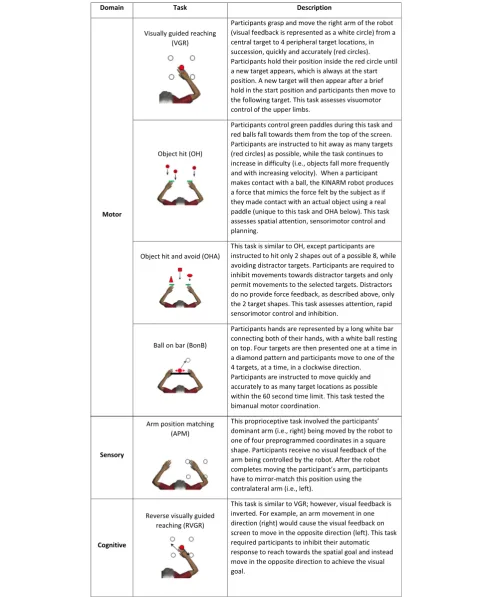
onto the KINARM End-Point robotic handles (BKIN Technologies Ltd., Kingston, ON, Canada), permitting free movement in the horizontal plane without anti-gravity support at proximal or distal arm segments. A trained op-erator described each task, using a standardized script, be-fore it was performed by the participant. Automated data collection and analysis software (Dexterit Version 3.6.2) measured and quantified subject performance. For each performance metric, the software computed a Z-score that accounted for age, sex, and handedness. Only perform-ance metrics that could be normalized, and therefore con-verted to Z scores, were considered in the current analysis. We examined 6 tasks from the KINARM Stand-ard Tests™, four tasks assessed upper-limb motor function in right-handed participants: visually guided reaching (VGR), object hit (OH), object hit and avoid (OHA), and level 1 of ball on bar (BonB). The Arm position matching (APM) task assessed upper limb proprioception, and re-verse visually guided reaching (RVGR) assessed cognitive-motor function. For detailed descriptions of all tasks, see Table 1.Within each task, approximately 9–20 performance metrics were produced, participants were instructed to take breaks as needed, and the assessment took < 1 h to complete. For detailed descriptions on all task parameters, see Additional file 2 or obtain from the BKIN Technologies Ltd. KINARM manual [10]. All included participants were selected based on their ability and understanding to follow task commands. Each task was comprised of various healthy participants, as not all participants completed each task. To reduce handedness as a potential confounding variable, only right hand dom-inant subjects were included in the analysis.
Principal component analysis
would fit the data equally well. Rotation is used to help select the best solution. An oblique rotation (oblimin) [17], which allows for components to be correlated, first was conducted for each solution. If all intercomponent correlations were low (<|0.30|), then an orthogonal rota-tion (varimax) [18] was used instead. A component load-ing was considered substantial if the loadload-ing was ≥0.40. Only participants who were right hand dominant were chosen for this analysis, and only data from their domin-ant hand were used for PCA. To reduce possible prac-tice effects for those participants who completed multiple assessments, we used the participant perform-ance metrics from the first KINARM assessment only (i.e., for participants who completed the same task mul-tiple times [repeated testing], we used their performance score only from the first assessment of that task). These identified components were then analyzed for interpret-ability, which was defined as parameters having
substantial loadings on each component and groupings of performance parameters having behaviorally meaning-ful conclusions (e.g., the constructs of “total movement” and “posture/reaction time” being separable). To further characterize participant performance, components and their respective parameters that loaded highly were used to broadly generate intuitive labels for each component per task rather than successively numbering components.
Results
Participant characteristics
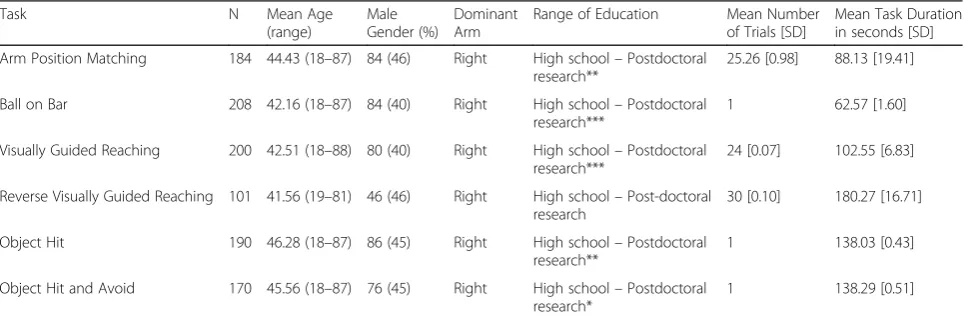
The number of participants across each task varied (Ns = 101–208). Participant level of education consistently ranged from high school education to postdoctoral re-searcher. The percent of participants that were male ranged from 40 to 46%, and the mean age of subjects (range: 41–46 years) was fairly consistent across all
tasks. Only a small subset of participants (n= 11) com-pleted all 6 KINARM tasks. For more detailed demo-graphics per task, see Table2.
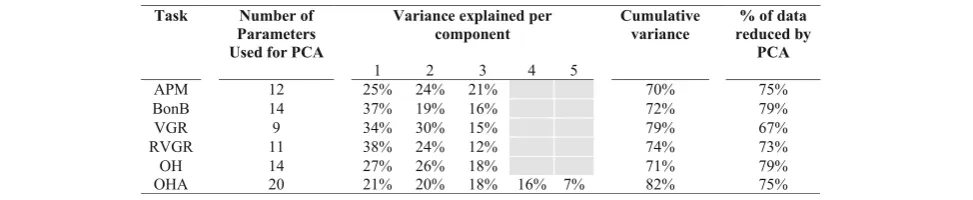
Data reduction
The number of KINARM performance parameters, per task, were substantially reduced (range 67–79%) by grouping related parameters into components. APM, BonB, VGR, RVGR, and OH reduced from 9 to 14 performance metrics to 3 components, which accounted for 70–79% of variance. OHA was reduced from 20 per-formance items to 5 components, while still accounting for 82% of the variance (Table3).
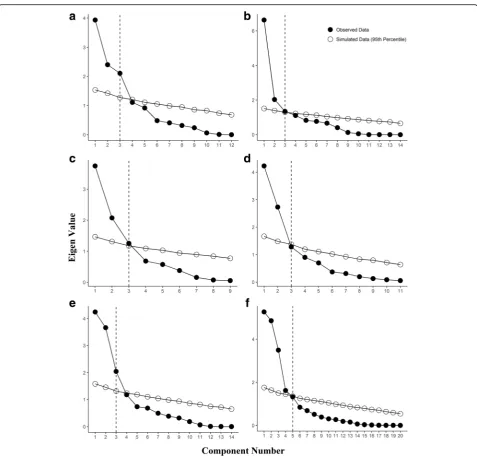
Principal component analysis across the KINARM battery Descriptions of each task and their respective compo-nents are provided below as follows: component name (number of KINARM parameters contributing to that component [according to the ≥.40 load criteria men-tioned previously], percent of variance explained by that component). See Table 4 for component loadings per task, all available items (i.e., metrics that could be converted to Z scores) were considered for each PCA per task. For scree plots with parallel analysis per task, see Fig. 2.
Arm position matching
Scree plot and parallel analysis yielded three models (1-, 2-, and 3-component solutions) that warranted further examination. For the 2- and 3-component solutions, the use of an orthogonal rotation was justified, as the inter-component correlations ranged from |-0.18| to |0.16|. Both the 1- and 2-component solutions included param-eters that did not load onto any of the components (sev-eral loadings <|0.40|) or had sizeable cross loadings. Although several parameters had substantial loadings (≥|0.40|) on at least one component in the 3-component
solution, the 3-component solution was the most inter-pretable (see Table4for the component loadings). The 3 components were related to 1) position accuracy (4, 25%), 2) movement variability (6, 24%), and 3) contrac-tion/expansion(3, 21%).
Ball on bar
Three models (1-, 2-, and 3-component solutions) were further examined based on the findings of the scree plot and parallel analysis. For the 2- and 3- component solu-tions, we used an oblique rotation because inter-component correlations ranged from |0.15| to |0.46|. Most parameters had substantial loadings (≥|0.40|) on at least one component in the 3-component solution. Bar length variability and hand path bias did not load substantially onto any of the 3 components. However, the 3-component solution was the most interpretable (see Table 4 for the component loadings). The three compo-nents were associated with 1)speed and success(6, 37%), 2) bar angle(4, 19%) and 3) hand-speed maxima which is re-lated to movement smoothness (3, 16%). The contribution of speed and success to task performance suggests that speed is highly influential for high success rates.
Visually guided reaching
Scree plot and parallel analysis yielded three models (1-, 2-, and 3-component solutions) for examination. For the 2- and 3-component solutions, we used an orthog-onal rotation (varimax) as inter-component correlations ranged from |0.06| to |0.16|. Both 1- and 2-component solutions included a number of parameters that did not load onto any of the components (loadings <|0.40|) or had sizeable cross loadings, but all parameters had sub-stantial loadings (≥|0.40|) on at least 1 component in the 3-component solution. The 3-component solution also was the most interpretable (see Table4for the component loadings). The components were related to: 1) initial
Table 2Participant Demographics and Task Characteristics
Task N Mean Age
(range)
Male Gender (%)
Dominant Arm
Range of Education Mean Number of Trials [SD]
Mean Task Duration in seconds [SD]
Arm Position Matching 184 44.43 (18–87) 84 (46) Right High school–Postdoctoral research**
25.26 [0.98] 88.13 [19.41]
Ball on Bar 208 42.16 (18–87) 84 (40) Right High school–Postdoctoral research***
1 62.57 [1.60]
Visually Guided Reaching 200 42.51 (18–88) 80 (40) Right High school–Postdoctoral research***
24 [0.07] 102.55 [6.83]
Reverse Visually Guided Reaching 101 41.56 (19–81) 46 (46) Right High school–Post-doctoral research
30 [0.10] 180.27 [16.71]
Object Hit 190 46.28 (18–87) 86 (45) Right High school–Postdoctoral research**
1 138.03 [0.43]
Object Hit and Avoid 170 45.56 (18–87) 76 (45) Right High school–Postdoctoral research*
1 138.29 [0.51]
movement and smoothness(5, 34%), 2)total movement(5, 30%), and 3)posture and reaction time(3, 15%).
Reverse visually guided reaching
Scree plot and parallel analysis yielded three models (1-, 2-, and 3-component solutions) for further examination. For the 2- and 3-component solutions, we used an orthog-onal rotation, as the inter-component correlations ranged from |-0.09| to |0.13|. Both the 1- and 2-component solu-tions included items that did not load onto any of the components (all loadings < |0.40|), but all items had sub-stantial loadings (≥|0.40|) on at least one component in the 3-component solution. The 3-component solution also was the most interpretable (see Table4for the com-ponent loadings). The 3 comcom-ponents were associated with: 1) initial movement and smoothness (7, 38%), 2) total movement(5, 24%), and 3)reaction time (1, 12%).Initial movement and smoothness accounted for more variance in this task than it did in VGR. Therefore, initial move-mentis imperative for success in RVGR.
Object hit
According to the scree plot and parallel analysis, three models (1-, 2-, and 3-component solutions) warranted further examination. For the 2- and 3-component solu-tions, we used an orthogonal rotation, as the inter-component correlations ranged from |0.03| to |0.24|. Both the 1- and 2-component solutions included items that did not load onto any of the components (loadings <|0.40|) or had sizeable cross loadings, but all items had substantial loadings (≥|0.40|) on at least one component in the 3-component solution. The 3-component solution also was the most interpretable (see Table4for the component loadings). The 3 compo-nents were comprised of: 1)hand bias(6, 27%), 2)speed and area (5, 26%), and 3) accuracy(4, 18%). Hits with left and right hands cross loaded onto both accuracy andhand bias.
Object hit and avoid
According to the scree plot and parallel analysis, five models (1-, 2-, 3-, 4- and 5-component solutions)
warranted further examination. For the 2-, 3-, 4-, and 5-component solutions, we kept the oblique rotation because the inter-component correlations ranged from |-0.12| to |0.30|. The 1-, 2-, 3-, and 4-component solu-tions included items that did not load onto any of the components (all loadings < |0.40|) or had substantial cross loadings, but all items had substantial loadings (> |0.40|) on at least one component in the 5-component solution, which was also the most interpretable (see Table4for the component loadings). The 5 components were related to: 1) impulsivity (6, 21%), 2) accuracy(6, 20%), 3)hand bias (6, 18%),4) speed and area(5, 16%), and 5) miss bias (1, 7%). Three of these components (hand bias, speed and area, and accuracy) are shared with OH, whereasmiss biasanddistractor avoidanceare components unique to OHA.
Discussion
The KINARM robot produces granular datasets of per-formance metrics associated with sensory, motor, visuo-spatial, and executive function. The primary objective of this study was to reduce multivariate data produced by the KINARM and generate interpretable and intuitively understandable components across 6 behavioral tasks to improve characterization of participant performance. KINARM data dimensionality was substantially reduced, while still retaining a large proportion of variance. Therefore, complex participant data produced by the KINARM robot can be reduced into a small number of components that characterize participant performance.
Interpretability and classification of components
We initially used PCA to reduce our multivariate data-set, and we then investigated if this statistical technique identified interpretable and classifiable components of participant performance. Within a task, components explained intuitive performance metrics. For example, in APM (a task that assesses limb proprioception), the 3 components identified were distinct measures of func-tion (posifunc-tion accuracy, movement variability and con-traction/expansion). Furthermore, KINARM parameters were separated reproducibly across multiple tasks. For Table 3Proportion of variance explained by each component across KINARM tasks
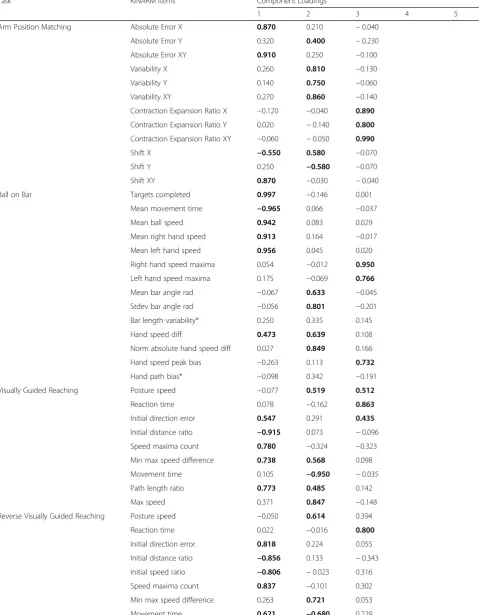
Table 4Principal component loadings for KINARM behavioral battery
Task KINARM Items Component Loadings
1 2 3 4 5
Arm Position Matching Absolute Error X 0.870 0.210 −0.040
Absolute Error Y 0.320 0.400 −0.230
Absolute Error XY 0.910 0.250 −0.100
Variability X 0.260 0.810 −0.130
Variability Y 0.140 0.750 −0.060
Variability XY 0.270 0.860 −0.140
Contraction Expansion Ratio X −0.120 −0.040 0.890
Contraction Expansion Ratio Y 0.020 −0.140 0.800
Contraction Expansion Ratio XY −0.060 −0.050 0.990
Shift X −0.550 0.580 −0.070
Shift Y 0.250 −0.580 −0.070
Shift XY 0.870 −0.030 −0.040
Ball on Bar Targets completed 0.997 −0.146 0.001
Mean movement time −0.965 0.066 −0.037
Mean ball speed 0.942 0.083 0.029
Mean right hand speed 0.913 0.164 −0.017
Mean left hand speed 0.956 0.045 0.020
Right hand speed maxima 0.054 −0.012 0.950
Left hand speed maxima 0.175 −0.069 0.766
Mean bar angle rad −0.067 0.633 −0.045
Stdev bar angle rad −0.056 0.801 −0.201
Bar length variability* 0.250 0.335 0.145
Hand speed diff 0.473 0.639 0.108
Norm absolute hand speed diff 0.027 0.849 0.166
Hand speed peak bias −0.263 0.113 0.732
Hand path bias* −0.098 0.342 −0.191
Visually Guided Reaching Posture speed −0.077 0.519 0.512
Reaction time 0.078 −0.162 0.863
Initial direction error 0.547 0.291 0.435
Initial distance ratio −0.915 0.073 −0.096
Speed maxima count 0.780 −0.324 −0.323
Min max speed difference 0.738 0.568 0.098
Movement time 0.105 −0.950 −0.035
Path length ratio 0.773 0.485 0.142
Max speed 0.371 0.847 −0.148
Reverse Visually Guided Reaching Posture speed −0.050 0.614 0.394
Reaction time 0.022 −0.016 0.800
Initial direction error 0.818 0.224 0.055
Initial distance ratio −0.856 0.133 −0.343
Initial speed ratio −0.806 −0.023 0.316
Speed maxima count 0.837 −0.101 0.302
Min max speed difference 0.263 0.721 0.053
example, OHA was divided into 5 components: impul-sivity, accuracy, hand bias, speed and area, and miss bias. Three of these components (accuracy, hand bias, and speed and area) are comparable to the PCA results observed from the OH task, thereby providing evidence that these tasks assess similar underlying behaviors.
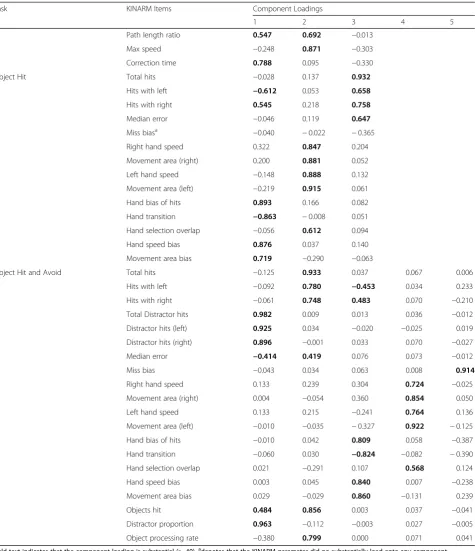
However, despite assessing similar underlying behaviors, the variance explained by each component differs. For example, speed and area accounts for more variability than accuracy, whereas in OHA accuracy accounts for more variability than speed and area. The addition of two unique components (i.e., miss biasand impulsivity) Table 4Principal component loadings for KINARM behavioral battery(Continued)
Task KINARM Items Component Loadings
1 2 3 4 5
Path length ratio 0.547 0.692 −0.013
Max speed −0.248 0.871 −0.303
Correction time 0.788 0.095 −0.330
Object Hit Total hits −0.028 0.137 0.932
Hits with left −0.612 0.053 0.658
Hits with right 0.545 0.218 0.758
Median error −0.046 0.119 0.647
Miss biasa −0.040 −0.022 −0.365
Right hand speed 0.322 0.847 0.204
Movement area (right) 0.200 0.881 0.052
Left hand speed −0.148 0.888 0.132
Movement area (left) −0.219 0.915 0.061
Hand bias of hits 0.893 0.166 0.082
Hand transition −0.863 −0.008 0.051
Hand selection overlap −0.056 0.612 0.094
Hand speed bias 0.876 0.037 0.140
Movement area bias 0.719 −0.290 −0.063
Object Hit and Avoid Total hits −0.125 0.933 0.037 0.067 0.006
Hits with left −0.092 0.780 −0.453 0.034 0.233
Hits with right −0.061 0.748 0.483 0.070 −0.210
Total Distractor hits 0.982 0.009 0.013 0.036 −0.012
Distractor hits (left) 0.925 0.034 −0.020 −0.025 0.019
Distractor hits (right) 0.896 −0.001 0.033 0.070 −0.027
Median error −0.414 0.419 0.076 0.073 −0.012
Miss bias −0.043 0.034 0.063 0.008 0.914
Right hand speed 0.133 0.239 0.304 0.724 −0.025
Movement area (right) 0.004 −0.054 0.360 0.854 0.050
Left hand speed 0.133 0.215 −0.241 0.764 0.136
Movement area (left) −0.010 −0.035 −0.327 0.922 −0.125
Hand bias of hits −0.010 0.042 0.809 0.058 −0.387
Hand transition −0.060 0.030 −0.824 −0.082 −0.390
Hand selection overlap 0.021 −0.291 0.107 0.568 0.124
Hand speed bias 0.003 0.045 0.840 0.007 −0.238
Movement area bias 0.029 −0.029 0.860 −0.131 0.239
Objects hit 0.484 0.856 0.003 0.037 −0.041
Distractor proportion 0.963 −0.112 −0.003 0.027 −0.005
Object processing rate −0.380 0.799 0.000 0.071 0.041
Bold text indicates that the component loading is substantial (≥.40).a
during the OHA may quantitatively represent the in-crease in cognitive load during this task. These two com-ponents that are absent from OH, and which account for 28% of overall variability, likely reflect the different impacts of impulsive movements in OH and OHA. In OH, quick and effectively impulsive movements are rewarded; quick movements with little inhibition will re-sult in many targets being hit. In contrast, in OHA there is a penalty for impulsive movements that are not proc-essed thoroughly prior to execution (i.e., deciding whether or not an object is a target or distractor prior to executing a movement towards it). Furthermore, behav-iorally during the OH task, the subject can hit a total of
300 targets during the trial. In contrast, there are only 200 targets during OHA, plus 100 distractors. Therefore, hand biasandspeed and areaaccount for less variability in OHA, as now the subjects must inhibit their auto-matic responses (i.e., impulsivity), which also results in an increased need for improved accuracy. This contrast in cognitive load between tasks may anecdotally account for the difference in variance explained by the compo-nents mentioned above across OH and OHA. This result of similar inter-task grouping of parameters across re-lated KINARM tasks was also observed during VGR and RVGR. Taken together, our results demonstrate the po-tential utility of PCA when applied to granular datasets,
as well as the increased interpretability of KINARM pa-rameters when categorized into behaviorally meaningful components that characterize performance.
Furthermore, parameter associations, positive or nega-tive, strong or weak, within their respective components were logically related to participant performance. For example, the PCA of the BonB task identified the com-ponent speed and success. Targets completed, mean ball speed, mean right- and left-hand speed, and hand speed difference all had substantial positive loadings, whereas mean movement time had a substantial negative loading. Therefore, as participants increased their right- and left-hand speed, and thus ball speed, participants de-crease the time from a target being displayed on screen to the target being reached by the participant, which results in a greater number of targets being completed throughout the task. In addition, the parameter norm absolute hand speed difference loaded substantially on bar anglebut had a very low loading onspeed and area. Behaviorally, this result is intuitive. If a participant reacts to a target quickly, the bar angle may become skewed if not carefully balanced, which is reflected by the substan-tial positive loadings of the other angle related parame-ters onto this component. These direction-based associations, low or high, were observed across most KINARM tasks and their respective parameters. These components will need to be further validated across KINARM platforms and patient populations. Overall, our analysis produced a consistent inter-task classifica-tion of behavioural variables (e.g., VGR and RVGR, OH and OHA), which demonstrates that these tasks assess similar underlying behaviours and further supports the validity of using this statistical technique on KINARM performance metrics. Our current analysis has substan-tially reduced these granular datasets into biologically plausible, interpretable, and behaviorally meaningful components.
Cross-loading of parameters with multiple components PCA indicated that some of the KINARM parameters cross-loaded with multiple components. For example, the APM task identified 3 components (position accur-acy, movement variability, and contraction/expansion), which is fairly consistent with previous research that described these 3 variables as observed patterns of im-pairment after stroke [2]. Despite mostly a strong separ-ation of these three components, shift x loaded onto both the position accuracy and movement variability components, with an inverse sign from negative to posi-tive respecposi-tively. Shift indicates a systematic bias to move either left/right or front/back in the workspace. Therefore, in the position accuracy component, shift X (left/right) indicates, with a negative association, that shift X biases to the left as absolute error in the X and
XY plane increases. In contrast, component 2,movement variability, indicates that as X shifts in the positive direction (i.e., hand moves to the right), overall variabil-ity increases.
Furthermore, certain parameters did not intuitively cross-load onto multiple components. For example, the OH task identified 3 components (hand bias, speed and area, and accuracy). Unexpectedly, the parameter total hits, which should be intuitively related to hits with left and right, did not cross-load onto the accuracy and hand bias components. However, this result demon-strates that total hits is highly related toaccuracy, which is separable from hand bias. These components are not highly interrelated, as indicated by the use of orthogonal rotation, and measure separable aspects of participant performance. Therefore,hand biasmeasures the bias to-wards the participants limb preference, and use in space, which is separable from overall accuracy and the total targets being hit (e.g., right-handed participants may have biased use of their right hand, but this is separable from the number of targets that were accurately hit using either hand).
separation of components that quantify participant performance.
Limitations and future directions
We excluded left-hand dominant participants, as many participants were right-handed, which means our find-ings may not generalize to left-handed participants. Furthermore, we could not conduct PCA across all task parameters, as participants did not complete all KINARM tasks. Therefore, we were unable to conduct PCA on broadly pooled performance scores across tasks, which confined our results to descriptions of each task only. However, the PCA has yielded task specific separa-tions of components to further characterize sensorimotor function among healthy subjects, which may serve as a normative data set for future clinical comparisons of subject performance. In addition, two to three participants per task, except for RVGR, were missing participant data for education obtained. However, these missing data should not substantially impair our range of education. In addition, some tasks do not have Z-scores for all parame-ters being recorded (these metrics could not be standard-ized), and thus these parameters were excluded from this analysis. We conducted PCA only on the End-Point robot data, and therefore, we will need to conduct PCA on healthy participant data generated using the KINARM Exoskeleton. It is unclear how antigravity support pro-vided by the Exoskeleton will affect participant perform-ance and the generated components. Therefore, PCA of Exoskeleton data will be imperative to future investiga-tions to implement PCA across KINARM platforms. Also, the current analysis was conducted in healthy participants, and future PCA will need to examine participant perform-ance using a clinical sample, such as stroke, to validate these components and characterize performance in clin-ical populations to further demonstrate the utility of our current findings. Furthermore, the current analysis does not address individual or group differences in our healthy participant sample, which may complicate future compari-sons between healthy subjects and clinical populations. However, using PCA across 6 KINARM tasks, which as-sesses a broad range of upper limb sensorimotor function, has led to a substantial reduction in the dimensionality of our data, and produced interpretable components of performance.
Therefore, PCA of KINARM data has the potential to become a valuable clinical tool. Applying PCA and iden-tifying main sources of variability in a clinical examin-ation can help make data from research tools, such as the KINARM, more concise and easily interpretable. Furthermore, identifying sources of strong variability may improve the detection of fluctuations in perform-ance, which could increase the clinical relevance of robotic assessment as an evaluation tool. Therefore,
analyzing data produced by a clinical population offers the potential to increase the clinical utility of the KINARM robot by maximizing interpretability of partici-pant performance, while also minimizing information loss, to increase the characterization of performance among various populations. It is not clear if patient per-formance will result in similar components of perform-ance patterns as healthy participants. Therefore, future applications of this analysis may offer potential insight into specific patterns of sensorimotor impairment among patient populations.
Conclusions
Using PCA, granular KINARM performance data can be substantially reduced to a small number of interpretable components with minimal information loss and still ac-counting for a large amount of variance. To validate our current findings and to further characterize sensorimotor function and impairment, the components derived from our sample of healthy participants will serve as normative data for future comparisons to patient populations.
Additional files
Additional file 1:Volunteer screening checklist. This form was administered to participants by trained researchers to screen for previous neurological and musculoskeletal complications. (PDF 53 kb)
Additional file 2:KINARM Standard Tests Parameter Tables. These tables provide detailed descriptions of each parameter per KINARM task. These tables were extracted from Dexterit-E 3.6 User Guide with permission from BKIN Technologies Ltd. (PDF 145 kb)
Additional file 3:Correlation matrices of KINARM parameters across all tasks. (DOCX 30 kb)
Abbreviations
APM:Arm position matching; BonB: Ball on bar; KINARM: Kinesiological instrument for normal and altered reaching movements; OH: Object Hit; OH&A: Object hit and avoid; PCA: Principal component analysis; RVGR: Reverse visually guided reaching; VGR: Visually guided reaching
Acknowledgments
The authors would like to thank Kim Moore and Simone Appaqaq for assessing the control participants, as well as Helen Bretzke and Justin Peterson for their contribution to software implementation and database management.
Funding
Funding provided by an Ontario Research Foundation–Research Excellence grant and a GSK-CIHR Chair in Neuroscience to SHS. The funding agencies had no role in the design of this study and they did not have any role in data collection or analysis.
Availability of data and materials
The datasets used and/or analysed during the current study are available from the corresponding author on reasonable request.
Authors’contributions
data analysis and results, and drafting of the manuscript. All authors read and approved the final manuscript.
Ethics approval and consent to participate
The Queen’s University and Affiliated Hospitals Health Sciences Research Ethics Board approved recruitment and assessment of these participants. Informed consent was obtained from each participant prior to the KINARM assessment.
Consent for publication Not applicable.
Competing interests MDW has nothing to disclose. LERS has nothing to disclose.
SHS is the cofounder of BKIN Technologies, the manufacturer of the KINARM device.
JGB receives a stipend from the Trillium Gift of Life Network to support his role as the Hospital Donation Support Physician.
JAJ has nothing to disclose.
Publisher’s Note
Springer Nature remains neutral with regard to jurisdictional claims in published maps and institutional affiliations.
Author details
1Centre for Neuroscience Studies, Queen’s University, Botterell Hall, 18 Stuart
St, Kingston, ON, Canada.2Department of Critical Care Medicine, Queen’s University, Kingston, ON, Canada.3Department of Medicine, Queen’s
University, Kingston, ON, Canada.4Department of Psychology, Queen’s
University, 318 Craine Hall, 62 Arch Street, Kingston, ON K7L 3N6, Canada.
Received: 17 October 2017 Accepted: 13 July 2018
References
1. Coderre AM, et al. Assessment of upper-limb sensorimotor function of subacute stroke patients using visually guided reaching. Neurorehabil Neural Repair. 2010;24:528–41.
2. Dukelow SP, et al. Quantitative assessment of limb position sense following stroke. Neurorehabil Neural Repair. 2010;24:178–87.
3. Dukelow SP, Herter TM, Bagg SD, Scott SH. The independence of deficits in position sense and visually guided reaching following stroke. J Neuroeng Rehabil. 2012;9:72.
4. Debert CT, Herter TM, Scott SH, Dukelow S. Robotic assessment of sensorimotor deficits after traumatic brain injury. J Neurol Phys Ther. 2012; 36:58–67.
5. Williams L, et al. Sensory-motor deficits in children with fetal alcohol Spectrum disorder assessed using a robotic virtual reality platform. Alcohol Clin Exp Res. 2014;38:116–25.
6. Pearson K. On Lines and Planes of Closest Fit to Systems of Points in Space. Philos Mag Ser 6. 1901;2:559–72.
7. Hotelling H. Analysis of a complex of statistical variables into principal components. J Educ Psychol. 1933;24:417–41.
8. Ringner M. What is principal component analysis? Nat Biotechnol. 2008;36: 303–4.
9. Joliffe IT, Cadima J. Principal component analysis: a review and recent developments. Phil Trans R Soc A. 2016;374:20150202.
10. BKIN Technologies Ltd, Kingston, ON, Canada. Dexterit-E User Guide v 3.6– KINARM Standard Tests Parameter Definitions.http://www.bkintechnologies. com/download/dexterit-e-user-guide-v-3-6-kinarm-standard-tests-parameter-definitions/. Accessed 2 Oct 2017.
11. Team RC. R: a language and environment for statistical computing. Vienna, Austria: R Foundation for Statistical Computing; 2016.https://www.R-project.org/ 12. Revelle, W. Psych: Procedures for Personality and Psychol Res. Evanston:
Northwestern University; 2017.https://cran.r-project.org/package=psych. 13. Sakaluk JK, Short SD. A methodological review of exploratory factors
analysis in sexuality research: used practices, best practices, and data analysis resources. J Sex Res. 2017;54:1–9.
14. Cattell RB. The scree test for the number of factors. Multivariate Behav Res. 1966;1:245–76.
15. O’connor BP. SPSS and SAS programs for determining the number of components using parallel analysis and Velicer’s MAP test. Behav Res Methods Instrum Comput. 2000;32:396–402.
16. Horn JL. A rationale and test for the number of factors in factor analysis. Psychometrika. 1965;30:179–85.
17. Jennrich RI, Sampson PF. Rotation for simple loadings. Psychometrika. 1966; 31:313–23.
18. Kaiser HF. The varimax criterion for analytic rotation in factor analysis. Psychometrika. 1958;23:187–200.