D A T A B A S E
Open Access
Genomics of drug sensitivity in bladder
cancer: an integrated resource for
pharmacogenomic analysis in bladder
cancer
Adnan Ahmad Ansari
1,2†, Inkeun Park
3†, Inki Kim
4, Sojung Park
4, Sung-Min Ahn
3,5*and Jae-lyun Lee
6,7*Abstract
Background:Bladder cancer has numerous genomic features that are potentially actionable by targeted agents. Nevertheless, both pre-clinical and clinical research using molecular targeted agents have been very limited in bladder cancer.
Results:We created the Genomics of Drug Sensitivity in Bladder Cancer (GDBC) database, an integrated database (DB) to facilitate the genomic understanding of bladder cancer in relation to drug sensitivity, in order to promote potential therapeutic applications of targeted agents in bladder cancer treatment. The GDBC database contains two separate datasets: 1) in-house drug sensitivity data, in which 13 targeted agents were tested against 10 bladder cancer cell lines; 2) data extracted and integrated from public databases, including the Cancer Therapeutics Research Portal, Cancer Cell Line Encyclopedia, Genomics of Drug Sensitivity in Cancer, Kyoto Encyclopedia of Genes and Genomes, and the Cancer Gene Census databases, as well as bladder cancer genomics data and synthetic lethality/synthetic dosage lethality connections.
Conclusions:GDBC is an integrated DB of genomics and drug sensitivity data with a specific focus on bladder cancer. With a user-friendly web-interface, GDBC helps users generate genomics-based hypotheses that can be tested experimentally using drugs and cell lines included in GDBC.
Keywords:Bladder cancer, Database, Drug response, Pharmacogenomics, Therapeutic biomarker
Background
Bladder cancer is the sixth most commonly diagnosed ma-lignancy in men [1]. Non-muscle invasive bladder cancer is associated with a good prognosis, whereas muscle-invasive or metastatic bladder cancer has a poor prognosis [2]. For metastatic bladder cancer, cisplatin-based cytotoxic chemo-therapy is used as the standard first-line treatment [3]. If this fails, there is no globally accepted second-line treatment op-tion. Recently, Bellmunt and colleagues [4] demonstrated the superior clinical performance of pembrolizumab, an
immune checkpoint inhibitor, establishing pembrolizumab as the standard second-line treatment for metastatic bladder cancer.
After large-scale cancer genomics studies, scientists have developed a multitude of targeted agents based on key newly identified genomic aberrations [5]. This ap-proach has been very successful in cancers such as melan-oma, non-small cell lung cancer, and breast cancer [6]. Recent genomic studies regarding bladder cancer have demonstrated that this malignancy has numerous gen-omic features that are potentially actionable using targeted agents [7–9]. In fact, 56–69% of genomic aberrations in bladder cancer are associated with potentially actionable signaling pathways, such as PI3K/AKT/mTOR, RTK/ MAPK, and G1-S cell cycle progression. With the * Correspondence:[email protected];[email protected]
†Adnan Ahmad Ansari and Inkeun Park contributed equally to this work.
3
Division of Medical Oncology, Department of Internal Medicine, Gachon University Gil Hospital, Gachon University, Incheon, South Korea
6Departments of Oncology, Asan Medical Center, University of Ulsan College
of Medicine, Seoul, Korea
Full list of author information is available at the end of the article
exception of a small number of clinical trials, however, tar-geted agents have not been widely used to treat bladder cancer.
In this study, we created the Genomics of Drug Sensitiv-ity in Bladder Cancer (GDBC) database, an integrated database to facilitate the genomic understanding of blad-der cancer in relation to drug sensitivity, and thus to pro-mote potential therapeutic applications of targeted agents to bladder cancer (http://gdbc.ewostech.net).
Construction and content
Data collection and processing
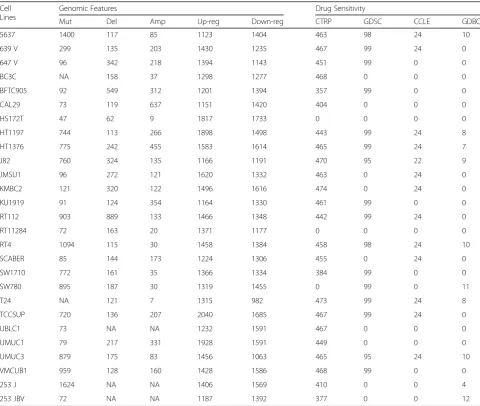
GDBC contains two separate datasets: 1) in-house drug sensitivity data; and 2) data extracted from public data-bases of 27 bladder cancer cell lines (Table1). As for the in-house data generation, we performed drug sensitivity tests using 13 targeted agents against 10 bladder cancer cell lines (Table 2). For public data, we extracted and
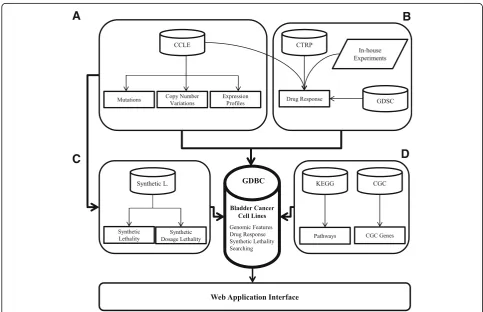
integrated publicly available data on 27 bladder cancer cell lines from the following data portals: 1) Cancer Therapeu-tics Research Portal (CTRP) [10]; 2) Cancer Cell Line Encyclopedia (CCLE) [11]; 3) Genomics of Drug Sensitiv-ity in Cancer (GDSC) [12]; 4) Kyoto Encyclopedia of Genes and Genomes (KEGG) [13]; 5) Cancer Gene Cen-sus (CGC) [14]; 6) bladder cancer genomics data [15]; and 7) synthetic lethality (SL)/synthetic dosage lethality (SDL) connections [16]. Figure1illustrates how GDBC was con-structed; Table1summarizes the pharmacogenomic land-scape of 27 bladder cancer cell lines.
In-house drug sensitivity experiments
We performed drug sensitivity experiments using 13 tar-geted agents against 10 bladder cancer cell lines (Table 2). These 13 targeted agents were selected based on the potential actionable genomic aberrations identified through bladder cancer genomic analyses [7–9].
Table 1The pharmacogenomic landscape of 27 bladder cancer cell lines Cell
Lines
Genomic Features Drug Sensitivity
Mut Del Amp Up-reg Down-reg CTRP GDSC CCLE GDBC
5637 1400 117 85 1123 1404 463 98 24 10
639 V 299 135 203 1430 1235 467 99 24 0
647 V 96 342 218 1394 1143 451 99 0 0
BC3C NA 158 37 1298 1277 468 0 0 0
BFTC905 92 549 312 1201 1394 357 99 0 0
CAL29 73 119 637 1151 1420 404 0 0 0
HS172T 47 62 9 1817 1733 0 0 0 0
HT1197 744 113 266 1898 1498 443 99 24 8
HT1376 775 242 455 1583 1614 465 99 24 7
J82 760 324 135 1166 1191 470 95 22 9
JMSU1 96 272 121 1620 1332 463 0 24 0
KMBC2 121 320 122 1496 1616 474 0 24 0
KU1919 91 124 354 1164 1330 461 99 0 0
RT112 903 889 133 1466 1348 442 99 24 0
RT11284 72 163 20 1371 1177 0 0 0 0
RT4 1094 115 30 1458 1384 458 98 24 10
SCABER 85 144 173 1224 1306 455 0 24 0
SW1710 772 161 35 1366 1334 384 99 0 0
SW780 895 187 30 1319 1455 0 99 0 11
T24 NA 121 7 1315 982 473 99 24 8
TCCSUP 720 136 207 2040 1685 467 99 24 0
UBLC1 73 NA NA 1232 1591 467 0 0 0
UMUC1 79 217 331 1928 1591 449 0 0 0
UMUC3 879 175 83 1456 1063 465 95 24 10
VMCUB1 959 128 160 1428 1586 468 99 0 0
253 J 1624 NA NA 1406 1569 410 0 0 4
Table 2IC50 values of 13 targeted agents in 10 bladder cancer cell lines, with their molecular targets indicated
Drug Target HT1376 J82 RT4 T24 UMUC3 5637 SW780 253 J 253 JBV HT1197
Afatinib EGFR: HER2 NA 3.93 3.08 4.41 4.54 0.43 3.7 1.85 1.53 NA
Axitinib PDGFR: KIT: VEGFR 8.95 > 10 7.34 9.25 6.44 3.15 14.5 NA > 10 > 10
Caborazantinib MET: RET: VEGFR2 9.55 > 10 2.93 NA > 10 9.22 6.53 NA > 10 > 10
Erlotinib EGFR 5.62 NA 6.9 7.99 > 10 3.41 > 10 NA > 10 > 10
Everolimus mTOR 3.77 2 > 10 0.33 0.67 2.2 > 10 NA 1.5 0.71
GDC-0879 RAF NA NA NA NA NA NA NA NA > 10 NA
Lapatinib EGFR:ERBB2 2.73 5.12 0.57 6.82 2.49 1.66 1.45 NA 2.35 4.7
Lonafanib FNTB NA > 10 > 10 > 10 > 10 > 10 > 10 > 10 > 10 NA
Nutlin-3 p53-MDM2 interaction NA NA NA NA NA NA > 10 NA > 10 > 10
Gefitinib AKT1:EGFR NA > 10 > 10 > 10 > 10 1.14 NA 3.11 3.8 NA
Trametinib MEK NA NA 2.54 NA NA NA > 10 > 10 NA NA
Vermurafenib BRAF > 10 > 10 NA NA > 10 > 10 > 10 NA > 10 > 10
Vorinostat HDAC inhibitors Class I, IIa, IIb, IV
2.48 2.95 1.52 0.9 2.35 1.2 1.36 NA 1.07 3.47
The value represents IC50 (μM)
A
C
D
B
All cells were maintained as per the recommendations of the ATCC or other references. Briefly, 1 day before the treatment, cells were plated at a density of 3–5 × 10³
cells/ well in 80μL of culture media within a 96-well plate. After overnight incubation, cells were treated with each drug at the indicated concentration in 20 mL of culture medium. To calculate the IC50 of the test drug, cells were treated with 10 serially diluted concentrations of drugs (25% serial dilution) from a highest concentration of 10 μM (10 μM, 2.5μM, 0.625μM, 0.015625μM, 0.0039μM, 0.000975μM, 0.00024375 μM, 0.0000609 μM, 0.0000152 μM, 0.0000038 μM), and after 48 h of incubation, cellular adenine-triphosphate (ATP) content was evaluated using the CellTiterGlo assay (Promega). Every dilution step was performed to maintain same concentration of DMSO. The raw ATP values were recorded and transferred to Prism software. Raw values from non-treated control (non-treated control implies DMSO treated with same percentage in cul-ture media) wells were adjusted to 100% of survival, and the relative survival rates were calculated by dividing the ATP luminescence values of the test well by those of the control wells. IC50 values of each drug in different cells were calculated by performing non-linear regression ana-lysis. Data represent the mean values of calculated IC50 from two independent experiments.
Data extraction
Raw datasets from CTRP [17], CCLE [18] and GDSC [19] were downloaded. Previously published mutation data from the literature were extracted and added to the CCLE and GDSC data to enhance the information [15]. The cancer gene census (CGC) genes are also stored in a database through which cancer researchers can easily identify hotspot genes. SL/SDL connections were taken from Jerby-Arnon et al. and thep-value of each connec-tion was recalculated using only bladder cancer cell lines [16]. The method of p-value calculation is available on a website (http://gdbc.ewostech.net/Documentation.php); we modified the original algorithm because of data limi-tations. Finally, we stored all this information in a data-base for easy access. Furthermore, information was downloaded from KEGG and stored in a database that helps the user to identify the importance of a particular gene by looking at its pathways.
Parameters for the CNV, expression and drug sensitivity analysis
The normalized CNV values were downloaded from CCLE website and stored in a database [18]. We consid-ered values greater than 1 to be amplifications and lower than 1 to be deletions. Amplifications are shown in red and deletions are shown in blue.
Our method is based on Jerby-Arnon’s method that was used for the CCLE database [16]. In cancer genomic
studies, differential expression analysis is usually per-formed by comparing the gene expression values of tumor samples with those of matched normal samples. In the case of cell lines (e.g., as in CCLE), however, there
are no normal counterparts to be compared.
Jerby-Arnon et al. used percentile based method to de-tect up-regulation and down-regulation in CCLE cell lines. In this study we scored up-regulation and down-regulation based on the following two conditions: 1) The values should differ at least by 15% from the mean of all other available cell lines in CCLE irrespective of cancer type; 2) We calculated the percentiles using all cell lines in CCLE and it should be the top 10 percentile of genes in CCLE were classed as up-regulated and the bottom 10 percentile as down-regulated. The calculated expression shows the difference of expression from the average of the remaining cell lines; 100% is exactly the same as the average. Up-regulations are shown in red and down-regulations are shown in blue.
Drug sensitivity for GDSC and CCLE is decided on the basis of the IC50 value: if the IC50 value is below 1 the block will be in red, showing high sensitivity, but users can freely decide sensitivity by comparing the IC50 values of that drug in other cell lines. GDSC has one of the largest drug sensitivity datasets across cancer cell lines. We extracted bladder cancer drug-related data from GDSC, which are comprised of data obtained from 224 different drugs tested against different bladder can-cer cell lines. The average IC50 is the average sensitivity of those drugs in different available cell lines across whole database. Sensitive cell lines are shown in red. The graph shows the IC50 values of different drugs in comparison with the average IC50 and other selected cell lines. Furthermore, CCLE contains a dataset of 24 clinically relevant drugs and data of 13 clinically relevant drugs that was tested in-house against 10 cell lines. For CTRP, ~ 475 compounds were tested against bladder cancer cell lines and the subsequently generated area under curve (AUC) from all these lines is available to download. The AUC values are converted using the R extreme values software package and outliers are consid-ered as sensitive or resistant. All these datasets are part of GDBC.
SL and SDL connections
and the parameters of the calculations are available on the website under the documentation section.
Database and website development
All data are stored in a MySQL database (v. 5.5.47) after processing. All mutations, CNV and expression data are converted into tabular form for storage in the database. The website was developed in PHP5 and deployed on an Apache2 server.
The pharmacogenomic annotation of bladder cancer cell lines
GDBC contains pharmacogenomic data of 27 bladder cancer cell lines. Table 1 summarizes the data included in GDBC for each of the 27 bladder cancer cell lines. For example, bladder cancer cell line 5637 has 1400 mu-tations, 117 gene deletions, 85 gene amplifications, 1123 gene up-regulations and 1404 gene down-regulations. In addition to the genomic information, GDBC provides drug response data for the 5637 cell lines against 463 compounds from CTRP, 217 compounds from GDSC, 24 compounds from CCLE, and 10 compounds tested in-house.
Comparison of genomic features between bladder cancer cell lines and tumors
It has been questioned whether cancer cell lines are true representatives of real cancers. We performed a system-atic comparison of genomic profiles from bladder cancer tissues [7] and those of bladder cancer cell lines present in GDBC. First, at the gene expression level, bladder cancer cell lines showed gene expression patterns that were similar to those of bladder cancer tissues. For ex-ample, APOBEC3B, EGFR, KRT14, KRT5, KRT6A and AKT3were up-regulated in both datasets. Second, at the DNA level, bladder cancer cell lines harbored the major-ity of functionally important CNVs and mutations iden-tified in bladder cancer tissues. For example, frequent deletions in CDKN2A, PDE4D, RB1, FHIT, FAM190A, LRP1B, andWWOXand amplifications inE2F3,CCND1, PPARG, and EGFRwere observed in both datasets. Fur-thermore,TP53, FGFR3, PIK3CA,TSC1, RB1, KDM6A, CREBBP, EP300, and ARID1A were frequently mutated in both datasets [20]. In summary, bladder cancer cell lines had many of the potentially actionable genomic features identified in bladder cancer tissues and thus ap-pear to be suitable for pharmacogenomic studies (Add-itional file1: Figure S1) [21].
Utility and discussion
A user-friendly web interface
When developing GDBC, we assumed that the main users of GDBC would be cancer biologists and clinicians involved in bladder cancer research. Using the web
interface, researchers can extract meaningful informa-tion from GDBC in multiple ways by using simple key-words as search terms. Two use case scenarios of GDBC are described below.
Inhibition of the fibroblast growth factor receptor (FGFR) pathway
Research question
The fibroblast growth factor/fibroblast growth factor receptor (FGF/FGFR) is a receptor tyrosine kinase (RTK) signaling pathway that plays important roles in diverse cell functions, including proliferation, differen-tiation, apoptosis and migration [22]. The dysregula-tion of FGFR1 and FGFR3 is common in bladder cancer. Additionally, FGFR inhibitors are under clin-ical investigation in other cancer types. For example, AZD4547, a selective FGFR (FGFR 1–3) inhibitor, inhibited cell proliferation in both cancer cell lines and tumor xenograft models, in which the FGFR pathway was activated [23]. PD173074, a pan-FGFR inhibitor, blocked the growth of small cell lung cancer (SCLC) both in vitro and in vivo [24]. Based on these backgrounds, we questioned whether there would be any pharmacogenomic relationship between FGFR1/ FGFR3 dysregulation and FGFR inhibitors in bladder cancer.
GDBC interrogation
To address this question, we first performed a gene-centric search; we simply typed FGFR1and FGFR3 into the gene search box to search for these genomic features in GDBC. According to the gene search results of GDBC, FGFR1 and FGFR3 were up-regulated in ~ 15% and ~ 20% bladder cancer cell lines, respectively. In addition, FGFR3 was non-synonymously mutated in ~ 11% of bladder cancer cell lines. The gene-centric search result also provided information on three drugs (namely, AZD4547, PD-173074 and nintedanib) that target both FGFR1andFGFR3.
suggest that it is worth experimentally testing the pharma-cogenomic relationship between the dysregulation of FGFR1andFGFR3and FGFR1/FGFR3 inhibitors in blad-der cancer.
Expression of EGFR and sensitivity to EGFR inhibitors Research question
The epidermal growth factor receptor (EGFR) is a key factor in epithelial malignancies, and its activity en-hances tumor growth, invasion, and metastasis [25]. EGFR is highly expressed in several cancers, and is a critical factor in driving tumorigenesis. Various drugs targeting EGFR (i.e., erlotinib, lapatinib, gefitinib, afa-tinib, etc.) have been approved for the treatment of several cancers [26]. EGFR is up-regulated in ~ 19% of bladder cancer cases [7], being a potentially action-able target for therapeutic manipulation in bladder cancer. Based on this background, we questioned whether there would be any pharmacogenomic rela-tionship between EGFR up-regulation and drugs tar-geting ERBB family members in bladder cancer.
GDBC interrogation
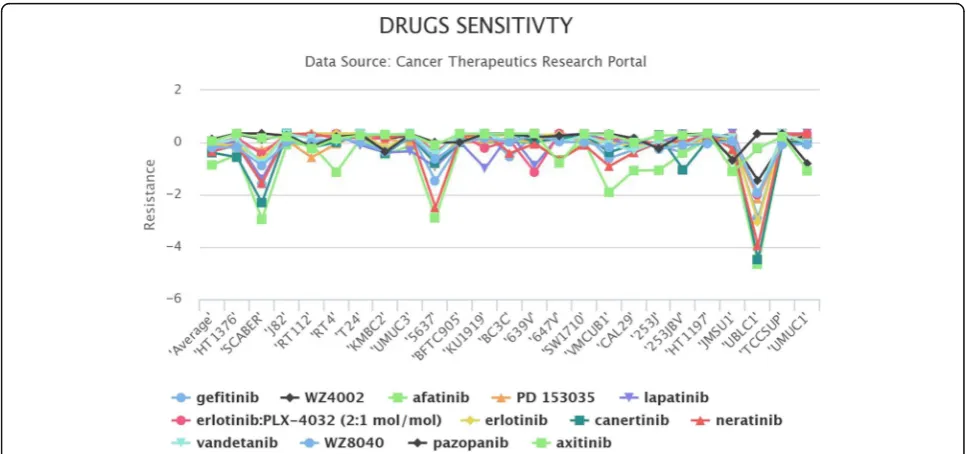
To answer this question, we first performed a gene-centric search by typing EGFR into the gene search box. This simple search revealed that EGFR was significantly up-regulated in ~ 18% of bladder cancer cell lines and that a number of EGFR-targeting drugs (i.e., gefitinib, WZ4002, afatinib, PD 153035, lapatinib, erlotinib, canertinib, neratinib, vandetanib,
WZ8040, Pazopanib, Axitinib, AMG-706, BIBW2992, ZD-6474, and Caborazantinib) were tested in bladder cancer cell lines. Then we performed a drug-centric search using the drug information acquired from the gene-centric search. According to our drug search re-sults, bladder cancer cell lines with relatively high
ex-pression of EGFR were more sensitive to
EGFR-targeting agents (Fig. 2). Bladder cancer cell lines with high expression of EGFR, including SCA-BER, 5637 and UBLC1, were markedly sensitive to EGFR-targeting agents. Altogether, these findings sug-gest that it is worth experimentally testing the
phar-macogenomic relationship between the EGFR
up-regulation and EGFR-targeting agents in bladder cancer.
Discussion
This study was motivated by two key factors: 1) des-pite numerous genomic features that are potentially actionable by targeted agents, both pre-clinical and clinical studies using molecular targeted agents have been very limited in bladder cancer; 2) public data-bases have their own strengths and weaknesses in terms of genomics and drug sensitivity data. Further-more, drug sensitivity data for bladder cancer cell lines are very limited.
In this study, we have created GDBC, an integrated database to facilitate the genomic understanding of blad-der cancer in relation to drug sensitivity, and thus to promote the potential therapeutic applications of
targeted agents to bladder cancer. GDBC includes data not only from public databases such as CTRP, CCLE, and GDSC, but also from in-house experiments specific-ally targeted against bladder cancer. CTRP, CCLE, and GDSC are three major pharmacogenomics DBs with dif-ferent strengths and weaknesses; CCLE has genomic in-formation with very limited drug inin-formation; GDSC has drug information with very limited genomic information; and CTRP has other limitations because of a very strin-gent interface (i.e., one cannot query against a particular cell line or tissue of origin). Our main goal for this study was to combine all bladder cancer-related public and in-house data in one platform with a user-friendly interface.
Implementation of precision cancer medicine requires in vitro and in vivo proof-of-concept studies followed by clinical trials. GDBC is a powerful tool in that re-searchers can easily identify potential pharmacogenomic relationships in bladder cancer. Based on the hypotheses generated by GDBC interrogation, researchers can per-form further in vitro and in vivo validation and, eventu-ally, clinical studies.
As mentioned above, GDBC contains both in-house and public data. One of the typical drawbacks in inte-grating different data sources is the potential inconsist-ency of the data. These types of inconsistencies may result from a number of biological and methodological factors that differ between the data sources. For ex-ample, the number of cells seeded per well, the drug concentration range examined, the number of cell dou-blings achieved, the types of cell viability assay, the ana-lytical tools to calculate drug sensitivity, and so on [27]. In short, this type of inconsistency is one of the inevit-able features of data integration. Therefore, when en-countering any inconsistency, researchers need to investigate experimental details that may have caused the inconsistency between different data sources and to identify a way to validate pharmacogenomic relation-ships in their own contexts.
In order to provide users with updated information, we have developed a computational pipeline to update the GDBC database. Currently, our plan is to automatic-ally update GDBC every 3 months and manuautomatic-ally on any requests. Users can share their data with us in simple tab delimited text files that will be parsed by our pipeline and will be added into the GDBC database.
Conclusions
GDBC is an integrated pharmacogenomic database spe-cialized for bladder cancer. GDBC can be used as a tool to facilitate the genomic understanding of bladder can-cer in relation to drug sensitivity, and thus to promote potential therapeutic applications of targeted agents to bladder cancer.
Additional file
Additional file 1:Figure S1. Heat map of frequent genetic aberrations in bladder cancer patient samples from cBioPortal demonstrates that genetic aberrations found in bladder cancer cell lines are compatible to those found in bladder cancer tissue samples; the left side shows the bladder cancer patient tissue samples and the right side shows the bladder cancer cell lines. A) Frequently mutated genes in bladder cancer. B) Frequently upregulated genes in bladder cancer. C) Frequently deleted genes in bladder cancer. D) Frequently amplified genes in bladder cancer. The frequencies of some genes are not comparable between bladder cancer tissue data and bladder cancer cell line data. We believe there are at least two reasons: 1) 27 bladder cancer cell lines may not cover the full mutational spectrum of bladder cancer, especially relatively rare mutations; 2) There may be some technical issues related to differential gene expression analyses. As for tissue data, usually both cancer and normal tissue data are available, and we detect differentially expressed genes by comparing these paired data sets. As for cell line data, this pairwise comparison cannot be done, and therefore, cell line data are handled quite differently for differential gene expression analyses as we described in the Method section. The difference of data handling in cancer tissue and cell lines may cause some discrepancy in detecting differentially expressed genes. (PNG 133 kb)
Abbreviations
AUC:Area under curve; CCLE: Cancer Cell Line Encyclopedia; CGC: Cancer Gene Census; CTRP: Cancer Therapeutics Research Portal; GDBC: Genomics of Drug Sensitivity in Bladder Cancer; GDSC: Genomics of Drug Sensitivity in Cancer; KEGG: Kyoto Encyclopedia of Genes and Genomes; SDL: Synthetic dosage lethality; SL: Synthetic lethality
Funding
This study was supported by The Korean Health Technology R&D Projects, funded by the Ministry of Health and Welfare, Republic of Korea and by grants HI14C1931 and HI16C1985. The funders played no part in the design of the study or the collection, analysis and interpretation of the data, or the writing of the manuscript.
Availability of data and materials
All datasets generated or used in this study are publicly available and can be downloaded from our website (http://gdbc.ewostech.net/).
Authors’contributions
SMA and JLL conceived and supervised the study; IKK, IKP, and SJP designed and carried out experiments; SMA and AAA drafted the article; AAA conducted bioinformatics analyses; All authors read and approved the final manuscript.
Ethics approval and consent to participate
Not applicable.
Consent for publication
Not applicable.
Competing interests
The authors declare that they have no competing interests.
Publisher’s Note
Springer Nature remains neutral with regard to jurisdictional claims in published maps and institutional affiliations.
Author details
1Department of Biomedical Engineering, University of Ulsan College of
Medicine, Seoul, South Korea.2Asan Center for Cancer Genome Discovery,
Asan Institute for Life Sciences, Asan Medical Center, Seoul, South Korea.
3
Division of Medical Oncology, Department of Internal Medicine, Gachon University Gil Hospital, Gachon University, Incheon, South Korea.4Asan
Institute for Life Sciences, Asan Medical Center, Seoul, Republic of Korea.
Gachon University, Incheon, South Korea.6Departments of Oncology, Asan
Medical Center, University of Ulsan College of Medicine, Seoul, Korea.
7Department of Internal Medicine, Asan Medical Center, University of Ulsan
College of Medicine, Seoul, Korea.
Received: 5 February 2018 Accepted: 24 September 2018
References
1. Torre LA, Bray F, Siegel RL, Ferlay J, Lortet-Tieulent J, Jemal A. Global cancer statistics, 2012. CA Cancer J Clin. 2015;65:87–108.
2. Kamat AM, Hahn NM, Efstathiou JA, Lerner SP, Malmström P-U, Choi W, et al. Bladder cancer. Lancet. 2016;388:2796–810.
3. von der Maase H, Hansen SW, Roberts JT, Dogliotti L, Oliver T, Moore MJ, et al. Gemcitabine and cisplatin versus methotrexate, vinblastine, doxorubicin, and cisplatin in advanced or metastatic bladder Cancer: results of a large, randomized, multinational, multicenter, phase III study. J Clin Oncol. 2000; 18:3068–77.
4. Bellmunt J, de Wit R, Vaughn DJ, Fradet Y, Lee J-L, Fong L, et al. Pembrolizumab as second-line therapy for advanced urothelial carcinoma. N Engl J Med. 2017;376:1015–26.
5. Jandaghi P, Hoheisel JD, Riazalhosseini Y. GHSR hypermethylation: a promising pan-cancer marker. Cell Cycle. 2015;14:689–90.
6. Zardavas D, Baselga J, Piccart M. Emerging targeted agents in metastatic breast cancer. Nat Rev Clin Oncol. 2013;10:191–210.
7. Cancer Genome Atlas Research Network. Comprehensive molecular characterization of urothelial bladder carcinoma. Nature. 2014;507:315–22. 8. Iyer G, Al-Ahmadie H, Schultz N, Hanrahan AJ, Ostrovnaya I, Balar AV, et al.
Prevalence and co-occurrence of actionable genomic alterations in high-grade bladder Cancer. J Clin Oncol. 2013;31:3133–40.
9. Ross JS, Wang K, Al-Rohil RN, Nazeer T, Sheehan CE, Otto GA, et al. Advanced urothelial carcinoma: next-generation sequencing reveals diverse genomic alterations and targets of therapy. Mod Pathol Off J US Can Acad Pathol Inc. 2014;27:271–80.
10. Seashore-Ludlow B, Rees MG, Cheah JH, Cokol M, Price EV, Coletti ME, et al. Harnessing connectivity in a large-scale small-molecule sensitivity dataset. Cancer Discov. 2015;5:1210–23.
11. Barretina J, Caponigro G, Stransky N, Venkatesan K, Margolin AA, Kim S, et al. The Cancer cell line encyclopedia enables predictive modelling of anticancer drug sensitivity. Nature. 2012;483:603–7.
12. Yang W, Soares J, Greninger P, Edelman EJ, Lightfoot H, Forbes S, et al. Genomics of drug sensitivity in Cancer (GDSC): a resource for therapeutic biomarker discovery in cancer cells. Nucleic Acids Res. 2013; 41:D955–61.
13. Kanehisa M, Bork P. Bioinformatics in the post-sequence era. Nat Genet. 2003;33:305–10.
14. Futreal PA, Coin L, Marshall M, Down T, Hubbard T, Wooster R, et al. A Census of Human Cancer Genes. Nat Rev Cancer. 2004;4:177–83. 15. Nickerson ML, Witte N, Im KM, Turan S, Owens C, Misner K, et al.
Molecular analysis of urothelial cancer cell lines for modeling tumor biology and drug response. Oncogene. 2017;36:35–46.
16. Jerby-Arnon L, Pfetzer N, Waldman YY, McGarry L, James D, Shanks E, et al. Predicting Cancer-specific vulnerability via data-driven detection of synthetic lethality. Cell. 2014;158:1199–209.
17. CTD2Data Portal.https://ocg.cancer.gov/programs/ctd2/data-portal.
Accessed 17 Jan 2018.
18. Broad Institute Cancer Cell Line Encyclopedia (CCLE).https://portals. broadinstitute.org/ccle/data. Accessed 17 Jan 2018.
19. Downloads - Cancerrxgene - Genomics of Drug Sensitivity in Cancer.http:// www.cancerrxgene.org/downloads. Accessed 17 Jan 2018.
20. Robertson AG, Kim J, Al-Ahmadie H, Bellmunt J, Guo G, Cherniack AD, et al. Comprehensive Molecular Characterization of Muscle-Invasive Bladder Cancer. Cell. 2017;171:540–556.e25.
21. Cerami E, Gao J, Dogrusoz U, Gross BE, Sumer SO, Aksoy BA, et al. The cBio Cancer genomics portal: an open platform for exploring multidimensional Cancer genomics data. Cancer Discov. 2012;2:401–4.
22. Chae YK, Ranganath K, Hammerman PS, Vaklavas C, Mohindra N, Kalyan A, et al. Inhibition of the fibroblast growth factor receptor (FGFR) pathway: the current landscape and barriers to clinical application. Oncotarget. 2016;8:16052–74.
23. Gavine PR, Mooney L, Kilgour E, Thomas AP, Al-Kadhimi K, Beck S, et al. AZD4547: an orally bioavailable, potent, and selective inhibitor of the fibroblast growth factor receptor tyrosine kinase family. Cancer Res. 2012;72:2045–56.
24. Anreddy N, Patel A, Sodani K, Kathawala RJ, Chen EP, Wurpel JND, et al. PD173074, a selective FGFR inhibitor, reverses MRP7 (ABCC10)-mediated MDR. Acta Pharm Sin B. 2014;4:202–7.
25. Normanno N, De Luca A, Bianco C, Strizzi L, Mancino M, Maiello MR, et al. Epidermal growth factor receptor (EGFR) signaling in cancer. Gene. 2006;366:2–16.
26. Tebbutt N, Pedersen MW, Johns TG. Targeting the ERBB family in cancer: couples therapy. Nat Rev Cancer. 2013;13:663–73.