A Modified Pixel Frequency Based Reversible
Data Hiding for Secure Data Communication
Sowmyashree1, R.R.Sedamkar2, Sanjay Sharma3
Thakur College of Engineering and Technology, Kandivili(E) Mumbai, Mumbai University, India
Abstract--The use of digital communication is increasing rapidly in the modern world. Security is main concern in digital communication. Data Hiding is a technology used for covert communication which can safely transfer confidential data by hiding into digital images. In reversible data hiding original image can be flawlessly reconstructed from the marked image after the extraction of hidden text data. This paper proposes a modified reversible data hiding algorithm using histogram shifting of prediction difference image. The algorithm makes use of frequency of pixels in each 4×4 sized blocks of image to form prediction difference image. In each block, the pixel with maximum appearance frequency is considered as mode value which is used to generate prediction difference image. But there are some blocks which may have two or more pixels with same maximum frequency. Our approach proposes an appropriate calculation for choosing pixel with maximum frequency when two or more pixels are having same maximum frequency value. Proposed approach results in higher PSNR values and low MSE values with a good payload data embedding capacity.
Keywords--RDH, Prediction difference, Peak Point, Zero point
I. INTRODUCTION
Reversible data hiding algorithm, can reconstruct the original image without any distortion or loss from the marked image after the hidden data have been extracted. The reversible data hiding technique can be classified into embedding in the spatial domain or in the frequency domain. Embedding data in the spatial domain can be studied by using Difference Expansion, Histogram and Vector Quantization etc. While embedding data in the frequency domain is learned such as Discrete Cosine Transform (DCT) or Discrete Wavelet Transform (DWT) in which message bits are embedded into corresponding coefficients. In general, embedding in spatial domain is higher hiding payload, but embedding in frequency domain is more robustness. Reversible data hiding is needed in some applications where even any degradation of the original cover is not allowed, such as medical, military and law forensics.
Many reversible data hiding techniques have been developed so far. J. Tian [1] proposed Reversible Data Embedding Using a Difference Expansion in which Pixel differences are used to embed data because of high redundancies among the neighboring pixel values in natural images. This method will not lead to loss of data due to compression. It has larger embedding capacity and is easy to extend which can be applicable to audio and video data. But there may be some round off errors (division by 2).
This method is largely depends on the smoothness of natural image; so cannot be applied to textured image where the capacity will be zero or very low and there is significant degradation of visual quality due to bit-replacements of gray scale pixels.
Z. Ni. et. al [2] proposed a novel method for reversible data hiding. This algorithm can recover the original image from the marked image after extraction of hidden data. Histogram of original image is generated. This algorithm makes use of the peak points and zero points of the image histogram and slightly modifies the pixel grayscale values to embed data into the image. After generating the histogram of original image, the peak and zero (minimum) points will be found out. Then the whole image is scanned in a sequential order. The grayscale values of pixels between peak and zero point are incremented by 1 which is equivalent to shifting the range of histogram towards right hand side by one unit. If the required payload is greater than the actual capacity, multiple pairs of maximum and minimum points will be used. This technique can embed a large amount of data (5–80 kb) in a 512×512× 8 grayscale image. Also reserves high visual quality. PSNR of the marked image versus the original image is guaranteed to be higher than 48 dB and also has low computational complexity and short execution time. This technique can be used for medical, texture, aerial images as well as other commonly used images.The disadvantage if this algorithm is the frequency of peak-pixel value in the histogram are limited. Therefore capacity to hide data is limited.
H.L.Yeh [3] proposed Prediction-Based Reversible Data Hiding. This algorithm is to make the predictive coding of the original image pixel value by histogram. This method has high capacity and distortions are quite invisible and always offer a constant PSNR 48.0dB. But prediction error values are limited and frequency of prediction errors is confined. Therefore payload is finite extension. Center pixel values no useful in the each 3×3 block.
Kuo et al. [4] presented a reversible data hiding technique which is based on the block division to hide the data in the image. Cover image is divided into several equal blocks and then the histogram is generated for each of these blocks. Maximum and minimum points of histogram are calculated and histogram shifting method used to embed the data. To increase the amount to embed image is divided into four blocks. It is possible to hide 12,704 bits in 512 by 512 image.
prediction difference histogram are increased greatly, and the embedding capacity can be effectively enlarged on the cover image. From the experimental results, the stego-image not only has good PSNR values of stego-image quality, but also has reversible characteristics for data hiding. But I this approach it is not specified how to choose pixel with maximum frequency when two or more pixels are having same frequency value which is maximum. So the proposed work explores an appropriate calculation of maximum frequency pixel value with inverse scanning order of the image. This method significantly improves PSNR values for high payload data.
II. PROPOSED WORK
The proposed work is a modification of high capacity reversible data hiding algorithm based on pixel frequency of blocks [5]. The original image is divided into 4×4 sized blocks. Number of occurrence (frequency) of each pixel in each block is counted. Pixel with maximum frequency is considered as mode value. But there are some blocks where some of the pixel has same frequency. In this case, our proposed method calculates the average of pixels having equal frequency (only highest frequency pixels are considered) and that average value is considered as mode value. Mode value is used to construct prediction difference image. Histogram is generated for prediction difference image. Peak point and zero points in the prediction difference image are used for hiding the data. A zero point is the grayscale value with no pixel in the given image. A peak point resembles to the grayscale value which the maximum number of pixels in the given image. The number of bits that can be embedded into the image equals to number of pixels which are associated with the peak point. For scanning the image inverse S order is used to explore the similarity property of neighboring pixels. Mode values are stored in the index table which can be used in data extraction and image restoration procedure. Proposed work consists of two parts:
extraction and image restoration takes place as shown in fig 1.
A. Reversible Data Hiding Algorithm
Input: Original Cover image
Output: Marked image, index table, peak points, zero points
Step 1: Read the image and divide into blocks
The original cover image of size MXN is divided into 4×4 non-overlap blocks Bk, {Bk│k=1, 2….T}, where T = MXN
/ 4X4.
Step 2: Compute the pixel appearance frequency of blocks Each block Bk has 16 pixels bi, {bi│ i =1, 2….16}. Compute the pixel appearance frequency bi of block Bk, and find out the pixel which is the most frequency.
PixelFrequency (B i) =No. of occurrences of { B1 , B2 ,…… B16 }
MaxPixelFrequencyCount=Max (PixelFrequency (B i)) where i=1, 2…16 If there are more than one pixel having same frequency count which is maximum, then the average of pixels having equal maximum frequency is calculated using (1) and considered as mode value.
If MaxPixelFrequencyCount>1
AvgMaxFrequency=∑ PixelFrequency( i) /count (1)
ModeValue Mk = AvgMaxFrequency All mode-values Mk {Mk │k= 1 2…T} of each block Bk, are orderly recorded in an index table. The index tablecan be used as predictive values in hiding procedure and it can be used as secret key in extracting and restoring procedure.
Step 3: Compute the predictive difference image. The image is scanned in inverse S order as shown in fig.2 and the prediction difference image generated.
Fig.1: Proposed RDH process Data
Hiding
Data Extraction
Secret data
Cover image
Marked Image
Cover Image Secret Data
Fig 2: Inverse S order scanning
Compute the predictive differences by subtracting pixel values of each block by mode value. Assume the predictive difference di, i = 1, 2...16, in block Bk , di should satisfy
−255 ≤di≤ 255 , the predictive differences are computed as (2)
di = mk −bi , i=1,2,...,16 (2)
Predictive differences are stored in arraywith size M×N
and generates a predictive difference image.
Step 4: Evaluate the histogram of predictive difference
image.
The system evaluates the frequency of predictive difference
di and generates the histogram of predictive difference image.
Step 5: Find the peak and zero points of histogram of
prediction difference
The system has to find two pairs of peak and zero points in histogram, which is divided into positive group 0 ≤ di≤255
and negative group -255≤ di≤−1. Each group has a peak point and a zero point. The peak point and zero point are shown in Fig.3.1. The peak point of positive group is pixel value PH = 0, which is 12 of frequency, and the zero point of positive group is pixel value PZ =3, which is 0 of frequency. On the other hand, the peak point of negative group is pixel value NH = -1, which is 8 of frequency, and the zero point of negative group is pixel value NZ = -4, which is 0 of frequency. After found the values of PH, PZ, NH, NZ, the system should record them and use for further extracting procedure.
Step 6: Shift pixels of predictive difference histogram In order to hiding secret message in two peak points, the pixels of predictive difference between the peak point and zeropoint should be shifted left or right one bit. That is, the predictive difference di, adds one unit, di =di+1, if predictive difference di Є [PH+1, PZ−1]. On the other hand, the prediction difference subtracts one bit di =di-1 if predictive difference diЄ [NZ+1, NH−1]. After shifting the positions, the pixels of PH +1and NH −1 is empty, this will be used for hiding secret message. The histogram of shifting predictive difference is depicted in Fig.3 2. The predictive difference is increased one bit, di =di+1, if prediction difference di Є [1, 2], that is, the predictive difference is shifted right one bit. On the other hand, the predictive difference is decreased one bit, di =di-1, if prediction difference di Є [-3, -2], that is, the predictive difference is shifted left one bit. After shifted the pixels of predictive difference completely, the system can obtain the shifting predictive difference image and shifting histogram.
Fig.3.1: Histogram of predictive difference image
Fig.3.2: Shifting Histogram of predictive difference image
Step7: Embed the secret message.
The secretmessage is converted into binary and embedded into shifted predictive difference image. Firstly, the system scans the shifted image, and embeds secret message into the pixels. The pixel di' is not changed if di' is equal to peak point PH of positive group and peak point NH of negative group, and the secret message is (0)2. On the other and, the peak point of positive group is increased one bit, i.e. d i '' =
di'+1, or the peak point of negative group is decreased one bit, i.e. d i '' = di'-1, if the secret message is (1)2. Repeat the Step until the secret messages are embedded.
Step 8: Construct the stego-image by predictive difference. According to the hidden image, the system can construct the stego-image. Firstly, the hidden message image is divided into 4×4 non-overlapping blocks and scanned the blocks in inverse S scanning order. The system finds the predictive value mk of block Bk and subtracts the pixel values of block Bk by using the index table. After the
blocks are computed completely, we can obtain the stego-image, which has been hidden the secret messages.
B. The Secret Data Extraction and Restoration Procedure
To extract secret information from the stego-image, the system uses the peak point, zero point and index table of predictive value. The data extraction and image recovery can be considered as reversion procedure of embedding method.
Input: The stego-image, peak point, zero point, index table of predictive value
Output: Secret information, original image Step 1: Input the stego-image.
After Input the stego-image with size MXN, the system reads the peak point, zero point and index table of predictive value.
Step 2: Partition the stego-image.
Then, the pixels of block bi , i=1,2,...,16 are subtracted from the mode-value and the prediction differences di , i=1,2,...,16 are generated. After the pixels of blocks Bk,
k=1,2,...,T are computed completely, the system can generate the predictive difference image.
Step 4: Count the histogram of predictive difference The system counts the frequency of prediction difference di, di Є{-255,-254,….,255} of predictive image and computes the histogram
Step 5: Extract the secret data and restoration shifting
predictive difference
In order to extract the secret message and restore original image, the system has to find two pairs of pick point and zero point in positive group( 0≤ di ≤255 )and negative group( -255 ≤ di ≤-1 ), respectively. Firstly, the system scans the pixels of prediction difference image in inverse S order. The secret data of hiding is (0)2 and the prediction difference pixelis not changed, if pixel is equal to PH or
NH. On the other hand, the secret information of hiding is (1)2 and the prediction differenceis changed to peak point
PH or NH, i. e. pixel is PH or NH, if pixel is equal to PH
+1 or NH -1 . Otherwise, the prediction differences are not needed to change because they do not hide any secret information. Repeat the above steps until the secret data are extracted completely; the predictive difference image can be restored. Moreover, the extracted secret data are sequentially permuted and the original secret data can be obtained.
Step 6: Shift pixels of histogram and Restore the predictive
differences.
In the restoration procedure, the system has to use the peak and zero points. The system uses the points to shift pixels to left one bit in the positive group ( 0≤ di ≤255) and shift pixels to right one bit in the negative group (-255 ≤ di ≤1). The restoration of prediction difference image and the image of histogram will be produced after shifting the pixels.
For example, the shifting operations are depicted in Fig.3.3 and Fig.3.4. Assume that the predictive difference of peak point is PH =0 and the predictive difference of zero point is
PZ =3 in positive group of histogram. The predictive difference of the peak point is NH =-1 and predictive difference of zero point is NZ =-4 in negative group of histogram. That is, the pixels are decreased one bit, if the pixels are in the range of positive group [1, 3]. On the other hand, the pixels are increased one bit, if the pixels are in the range of negative group [-4, -2]. The restoration and shifting histogram are shown in Figure 3(d)
Step 7: Restore to original image.
In order to restore the original image form the predictive difference image, the predictive difference image D'' is needed to compute by using the prediction operation. Firstly, the image D'' is divided into 3 × 3 non-overlapping blocks. The system scans the blocks Bk, k=1,2,...,T and finds the corresponding predictive value mk ,k=1,2,...,T, in
Fig.3.3: The histogram after extraction secret
Fig.3.4: The restoration after shifting histogram data
III. EXPERIMENTAL RESULTS AND PERFORMANCE
ANALYSIS
The proposed reversible data hiding method is performed on different grayscale images which is used to hide the secret text messages. Various performance measures like such as MSE, PSNR and SNR has been evaluated. These parameters are used for image quality analysis. Performance compared with Ching et.al’s method.
Mean Squared Error (MSE) measures level of distortion (error) between original and stego image. It is calculated as in (3).
MSE= ∑ ∑ ( ( , ) − ( , ) 2 (3)
Where I (i, j) is original image K (i, j) is stego image
Peak Signal to Noise Ratio (PSNR) is used to measure quality of reconstruction of lossy compression codecs. It is the ratio between signal (Original image) and noise (error). Generally higher PSNR indicates higher quality.
The PSNR is defined using (4)
PSNR=10. log ( 2/ ) (4)
(a) 1.bmp (b) 2.bmp (c) 3.bmp (d) 4.bmp (e) 5.bmp (f) 6.bmp Fig.4: Original Grayscale Images
(a) PSNR=47.23dB (b)PSNR=49.27dB (c)PSNR=48.65dB (d)PSNR=48.98dB (e)PSNR=49.35dB (f)PSNR=49.03dB Fig.5: Stego Images after enbedding the sectret data
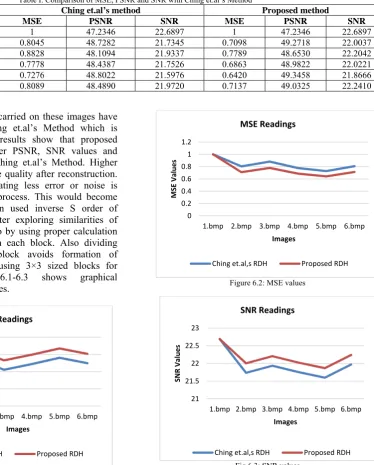
Table I. Comparison of MSE, PSNR and SNR with Ching et.al’s Method Image
type No. of Bytes
Ching et.al’s method Proposed method
MSE PSNR SNR MSE PSNR SNR
1.bmp 1000 1 47.2346 22.6897 1 47.2346 22.6897
2.bmp 1000 0.8045 48.7282 21.7345 0.7098 49.2718 22.0037 3.bmp 1000 0.8828 48.1094 21.9337 0.7789 48.6530 22.2042 4.bmp 1000 0.7778 48.4387 21.7526 0.6863 48.9822 22.0221 5.bmp 1000 0.7276 48.8022 21.5976 0.6420 49.3458 21.8666 6.bmp 1000 0.8089 48.4890 21.9720 0.7137 49.0325 22.2410
Results of experiments carried on these images have been compared with Ching et.al’s Method which is shown in Table 1. The results show that proposed method can achieve higher PSNR, SNR values and lower MSE values than Ching et.al’s Method. Higher PSNR indicates high image quality after reconstruction. And MSE is lower indicating less error or noise is introduced in embedding process. This would become possible as we have been used inverse S order of scanning of image to better exploring similarities of neighboring pixels and also by using proper calculation for finding mode value in each block. Also dividing image into 4×4 sized block avoids formation of incomplete blocks when using 3×3 sized blocks for 12×512 image. Fig 6.1-6.3 shows graphical representation of these values.
Fig.6.1: PSNR values
Figure 6.2: MSE values
Fig.6.3: SNR values
46 47 48 49 50
1.bmp 2.bmp 3.bmp 4.bmp 5.bmp 6.bmp
PSNR values
Images PSNR Readings
Ching et.al,s RDH Proposed RDH
0 0.2 0.4 0.6 0.8 1 1.2
1.bmp 2.bmp 3.bmp 4.bmp 5.bmp 6.bmp
MSE Values
Images MSE Readings
Ching et.al,s RDH Proposed RDH
21 21.5 22 22.5 23
1.bmp 2.bmp 3.bmp 4.bmp 5.bmp 6.bmp
SNR Values
Images SNR Readings
difference image increases the number of peak points and zero points in the histogram and thereby increases the embedding capacity. Proposed method can embed maximum 1000 bytes of text data in 512×512 grayscale images. Data can be extracted flawlessly as well as image can be reconstructed without degrading image quality. Proposed approach resulted in higher Peak to Signal Ratio and lower Mean Squared Error compared to the previous approach. A high PSNR and low MSE value indicates better quality of image after reconstruction. This technique is useful in applications where original image has to preserve its quality such as banking, military, medical etc. Image encryption technique can be used to provide further security to the image containing secret data.
3, PP. 354-362, March 2006.
[3] H. L. Yeh, “Prediction-Based Reversible Data Hiding,” Master Thesis, Department of Computer Science and Information Management, Providence University, Taiwan, Republic of China, 2007.
[4] Wen-chung kuo, Dong-jin jiang and Vu-chih huang. “A reversible data hiding scheme based on block division”,IEEE, May 2008, 978-0-7695-3119-9
[5] Ching-Te Wang, Ching-Lin Wang, Lin-Chun Li, Sheng-You Guo,” The Image High Capacity and Reversible Data Hiding Technique Based on Pixel Frequency of Block”, IEEE, 978-1-4577-2119-9/12, 2011
[6] E. Varsaki, V. Fotopoulos, A. N. Skodras, ‘A reversible data hiding technique embedding in the image histogram’, E. Varsaki, V. Fotopoulos, A. N. Skodras
[7] A. Westfeld, A. Pfitzmann, “Attacks on steganographic systems”, Proc. On Information Hiding, 3rd Int. Workshop, Springer Verlag, 1999, pp.61-76