_____________________________________________________________________________________________________
Comparative Evaluation of Physical and
Physicochemical Properties and Antioxidant
Potential of Various Cooking Oils
Haq Nawaz
1*, Muhammad Aslam Shad
1, Saira Hassan
2, Muhibullah. Shah
1,
Haseeba Shahzad
1, Raheela Jabeen
3, Aqsa Nawaz
1, Zakia Riaz
1and Sumaira Jamal
11Department of Biochemistry, Bahauddin Zakariya University, Multan 60800, Pakistan. 2Institute of Chemical Sciences, Bahauddin Zakariya University, Multan 60800, Pakistan. 3
Department of Biochemistry and Biotechnology, Women University, Multan 60800, Pakistan.
Authors’ contributions
This work was carried out in collaboration among all authors. All authors read and approved the final manuscript.
Article Information
DOI: 10.9734/EJNFS/2019/v10i330113 Editor(s): (1)Dr. Johnson Akinwumi Adejuyitan, Senior Lecturer, Department of Food Science and Engineering, Ladoke Akintola University of Technology (LAUTECH), Ogbomoso, Nigeria. Reviewers: (1) Ufuoma Bigila Shemishere, Federal University, Birnin Kebbi, Nigeria. (2)Tsado Daniel Babanma, Federal University of Technology Minna, Nigeria. (3)Senthil Kumar Raju, Swamy Vivekanandha College of Pharmacy, India. Complete Peer review History:https://sdiarticle4.com/review-history/51933
Received 30 July 2019 Accepted 01 October 2019 Published 17 October 2019
ABSTRACT
The study was based on the comparative evaluation of physical and physicochemical properties and antioxidant potential of different cooking oils as awareness for the consumers. The cooking oils extracted from sunflower, corn, canola, soybean, and rapeseed and available for consumers as different commercial brands were purchased from the local market and analysed for their physical, physicochemical and antioxidant properties. All of the selected oils were found to be statistically similar on the basis of their physical properties including odour, specific gravity (P=.65) and refractive index (P=0.84). All of the selected oils contained vitamin A except one brand of each of the sunflower, corn and canola oils. The selected oils and their blend showed statistically different physicochemical properties and antioxidant potential (P=.000). The corn oil and rapeseed oil were found to be the best quality oil due to comparatively lower acid, peroxide and
saponification values and higher antioxidant potential in terms of free radical scavenging capacity. The study results would provide valuable information to the consumers and the researchers regarding the selection of the best quality cooking oils available in the market.
Keywords: Cooking oils; physical properties; physicochemical properties; antioxidant potential; vitamin A; free radical scavenging capacity.
1. INTRODUCTION
Plant seed oils are categorized as simple lipids which are liquid at room temperature due to the presence of unsaturated fatty acids. However, some of the plant oils such as coconut oil, palm oil and palm kernel oil are rich in saturated fatty acids and thus solidify at room at relatively lower temperature. Plant seed oils also known as vegetable oils or cooking oils including olive oil, sunflower oil, corn oil, canola oil, soybean oil, rapeseed oil and peanut oil are generally used for frying, baking, cooking foods and salad dressings. During frying and cooking, these oils provide a medium for the transfer of heat and give texture and flavour to food products. The nutritional and edible quality of the cooking oils depends on its chemical composition and its stability in moisture and high temperature [1,2].
The oils are basically composed of triacylglycerol and free fatty acids. They also contain some other components like phospholipids, sterols, triterpene alcohols, carotenes, chlorophylls, colouring matters, hydrocarbons, metals, unwanted flavours and oxidant products [3]. These also contain traces of hydrocarbons including alkanes, alkenes, carotenes and polycyclic hydrocarbons. The carotenes are important minor components of many vegetable oils like palm oil and give yellowish, red or orange colour to the oil [4].
The chemical and physicochemical composition of the cooking oil significantly affects its nutritional and edible quality. The oils containing unsaturated fatty acids, preferably the polyunsaturated omega-3 fatty acids are considered as beneficial for human health as they are easily transported via blood in the form of high-density-lipoproteins [5]. However, the oils composed of fatty acids with a high degree of unsaturation are at more risk of hydrolytic and oxidative rancidity and show relatively higher acid and peroxide values. Therefore, the higher the degree of unsaturation in the oil, the higher would be the acid and peroxide value and the lower would be its edible quality. On the other hand, the lower the degree of unsaturation in the oil, the lesser would be its stability towards
polymerization during heating and lesser would be the risk of oxidative rancidity [6]. The oils showing higher saponification value contain short chain fatty acids and relatively lower content of essential fatty acids. Such types of oils also show higher acid value due to the release of a large number of fatty acids on rancidification
[7]. However, the oils rich in antioxidant phytochemical compounds such as fat-soluble vitamins including tocopherol and vitamin A and polyphenols are more resistant to oxidative rancidity as they inhibit lipid peroxidation and have a relatively long shelf life [8].
Previously, several studies have been reported on the edible, nutritional and antioxidant quality of various plant oils [2,9–12]. However, limited data is available on the comparative evaluation of the said qualities of cooking oils supplied by various brands in Pakistan. It was therefore found necessary to plane a study on the comparative evaluation of the physical, physicochemical and antioxidant properties of different cooking oils supplied by various brands in Pakistan. The study would be a valuable source of information for the consumers and the researchers dealing with cooking oils.
2. MATERIALS AND METHODS
2.1 Chemicals and Reagents
Antimony trichloride, chloroform, hydrochloric acid, hydrogen peroxide, potassium iodide and sodium thiosulphate were purchased from Reidel-de-Haen (Germany), 2,2 diphenyl,1-picrylhydrazyl, glacial acetic acid, phenolphthalein, Trolox (6-hydroxyl-2,5,7,8-tetramethylchroman-2-carboxylic acid) from Fluka (United States) diethyl ether, ferrous sulphate pentahydrate, salicylic acid, starch from Sigma (St. Louis, United States) ethanol, methanol and potassium hydroxide from Merck (Germany) and hexane from Fischer Chemicals (Waldachtal, Baden-Wurttemberg, Germany).
2.2 Study Design
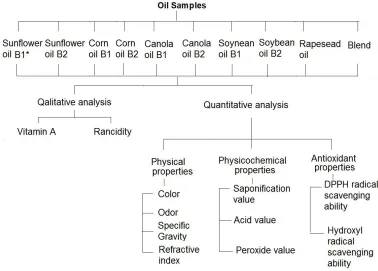
and canola oil provided by different brands were purchased from the local market. The samples were brought to the research laboratory at the Institute of Chemical Sciences, Bahauddin Zakariya University, Multan, Pakistan and stored in airtight glass containers in sterilized and moisture free environment at 25±5°C. The oils and their blend were analysed for their physical properties including colour, odour, specific gravity and refractive index, physicochemical properties including saponification, acid and peroxide values and antioxidant potential in terms of free radical scavenging capacity. The
flowsheet of the study design is presented in Fig. 1.
2.3 Physical Characteristics
The physical parameters including colour and odour of the oils were observed manually while the specific gravity and refractive index were determined using the previously reported method [13]. The specific gravity was determined by measuring the density of the oils using an empty clean pycnometer (10 ml) and calculated by the following expression.
= ⁄
The refractive index of the oil samples was determined by the reported method [14] using Abbe’s refractometer. The oil samples were evaporated at the sodium vapour lamp at 20°C and refractive index was
recorded.
2.4 Physicochemical Characteristics
The saponification value of different oil samples was determined by the standard method [15]. The oil sample (2 g) was mixed with alcoholic potassium hydroxide solution (25 ml). The contents were refluxed for 1 h with frequent shaking, followed the addition of 1% phenolphthalein solution (1 ml). The contents were titrated against 0.5M hydrochloric acid and saponification value was calculated using the following expression.
( )
= ( − ) × 28.05⁄
where is the volume of hydrochloric acid used against the sample, is the volume of hydrochloric acid against blank and is the weight of the sample.
Fig. 1. Scheme of the study
*
The acid value of different oil samples was determined by the standard protocols as described by IUPAC [13]. The oil sample was mixed with freshly prepared mixture of diethyl ether and 95% ethanol (1:1 v/v) and 1 % phenolphthalein solution (1 ml). The mixture was titrated against 0.1 M sodium hydroxide solution followed by continuous shaking until a pink colour was obtained which persisted for 15 sec. The required volume of sodium hydroxide was noted and the acid value was calculated by the following expression.
( )
= × 5.61⁄
where is the weight of the sample.
The peroxide value was determined by the standard protocols [15]. The oil sample (1 g) was mixed with potassium iodide (1 g) and aqua solution (20 ml) prepared by mixing glacial acetic acid and chloroform (2:1 v/v). The mixture was placed in a boiling water bath for 30 sec followed by addition of 5% potassium iodide solution (20 ml) and 1% starch solution (1 ml). The contents were titrated against 0.002 M sodium thiosulphate solution. The procedure was also repeated with blank and the peroxide value was calculated using the following expression.
( . )
= ( − ) × 10 ⁄
where is the volume of sodium thiosulphate solution used against the sample, is the volume of Sodium thiosulphate solution used against a blank, M is the molarity of sodium thiosulphate solution and is the weight of the sample.
2.5 Screening Tests
The presence of vitamin A in the oils was confirmed by the reported method [16]. The oil (2 g) was mixed with few drops of antimony trichloride reagent (25 ml of antimony trichloride mixed with 100 ml of chloroform). The appearance of green coloration in the mixture indicated the presence of vitamin A.
Rancidity of the oil sample was estimated by Kries test [17]. The oil sample (10 ml) was taken in a test tube and shaken vigorously with 0.1% phloroglucinol solution (10 ml) in ether and concentrated hydrochloric acid solution (10 ml)
for 20 sec. The appearance of pink coloration indicated rancidity of oil samples.
2.6 Antioxidant Analysis
The antioxidant potential of the selected oils was determined in terms of hydroxyl radical scavenging capacity (OH-RSC) and 2, 2-diphenyl-1-picrylhydrazyl radical scavenging capacity (DPPH-RSC) following previously described protocols. OH-RSCS was determined using the salicylic acid method as reported earlier [18]. The oil sample (0.1 ml) was mixed with 95% ethanol (9.9 ml) followed by the addition of 1 ml of each of the salicylic acid (9 mM), hydrogen peroxide (8.8 mM) and ferrous sulfate hepta-hydrate (9 mM)solution. A mixture without sample was treated as control and that without salicylic acid as blank. The reaction mixture was allowed to stand at 37°C for 30 min and absorbance was recorded at 510 nm on a UV-visible spectrum (Jenway-6405, Japan). The OH-RSC was calculated using the following equation.
− (%) = [1 − ( − )⁄ × 100]
where is the absorbance of sample is the absorbance of blank, while the absorbance of control.
DPPH-RSC was determined using the previously reported method [19] as described by Shad et al. with some modifications [11]. The oil sample (10 ml) was mixed with methanol (10 ml), mixed well and allowed to stand for 15 min. An aliquot (1 ml) from the methanolic layer was mixed with stable DPPH solution (3 ml) and allowed to react for 30 min at 25±5°C. The absorbance was recorded at 517 nm on a UV-visible spectrum (Jenway-6405, Japan) and DPPH-RSC was calculated by the following equation:
− (%) = [( − )⁄ ] × 100
where is the absorbance of sample is the absorbance of blank, while the absorbance of control.
2.7 Statistical Analysis
3. RESULTS AND DISCUSSION
3.1 Physical Properties
The results of the physical properties of the selected oils and their blend are presented in Table 1. The oils were equally transparent without any turbidity, greenish yellow in colour and smelled an oily odour. However, the odour of the rapeseeds oil was found to be comparatively pungent than other ones. The specific gravity and refractive index of the selected oils ranged from 0.8990±0.001 to 0.9396±0.001 and 1.465± 0.001 to 1.469±0.001 respectively. The results for specific gravity and refractive index were found to be statistically similar (P= .65, .84 respectively) and comparable with those reported earlier [20,21]. The colour of cooking oils is due to the presence of carotenoids and few other pigments [22]. The specific gravity is inversely correlated with molecular weight and directly correlated with the degree of unsaturation in fats and oils. The refractive index is directly proportional to the number of carbon atoms in the fatty acids and gives a measure of fatty acids chain length in an oil [23]. The oils showing a relatively lower value of specific gravity and high value of refractive index are considered as good quality oil. The corn oil B1 and sunflower oil B1 were found to be good due to lower values of specific gravity and refractive index respectively.
3.2 Physicochemical Properties
The physicochemical properties of the selected oils were determined in terms of saponification value, acid value and peroxide value. The results for the physicochemical properties of the selected oils are given in Table 2. The saponification, acid and peroxide values of the
oils ranged from 170.95±4.18 to 206.25 ±5.82, 0.324±0.013 to 1.328±0.183 and 5.10±0.424 to 18.40±0.283 mg KOH g-1 of oil respectively. A statistically significant variation (P= .00) in each of the studied physicochemical parameter was observed among the selected oils. The soybean oil B1, canola oil B1 and corn oil B1 showed comparatively lower saponification, acid and peroxide values respectively. The sunflower oil B1, sunflower oil B2 and canola oil B1 showed comparatively higher saponification acid and peroxide values respectively. The saponification and acid values of the oils were found to be within the standard range (92-250 mg KOH g-1 oil) while the acid values of sunflower oil B2, corn oil B2, canola oil B2, soybean B2 and the blend and peroxide values of sunflower oil B1, sunflower oil B2, canola oil B1 and soybean B1 were found to be higher than the standard value (0.6 mg KOH g-1 oil and 10 mEqv. of O2 Kg-1 oil respectively) as recommended by Pakistan Standard Quality Control Authority (PSQCA) and Codex Alimentarius Commission [24].
Saponification value indicates the average chain length and molecular weight of the fatty acids present in the oil. The oils with higher the saponification, acid and peroxide values possess smaller chain length and molecular weight of fatty acids, are more susceptible to hydrolytic cleavage of triglycerides into fatty acid and undergo high extent of oxidative rancidity respectively [9,25]. In present study B1, canola oil B1 and corn oil B1oil was found to be the best due to low saponification, acid and peroxide values. The results are also comparable to those reported earlier [26]. The corn oil B1 and rapeseed oil were found to be the best with relatively lower values of each of the studied physicochemical parameter with no sign of rancidity.
Table 1. Physical properties of the selected oils and their blend
Oil Colour Odour Specific gravity Refractive index
Sunflower oil *B1 Greenish yellow Fatty 0.9342.±0.013 1.465±0.012
Sunflower oil B2 Light yellow Fatty 0.9396±0.021 1.469±0.011
Corn oil B1 Light yellow Fatty 0.9339±0.014 1.467±0.009
Corn oil B2 Dark yellow Fatty 0.9346±0.016 1.467±0.014
Canola oil B1 Yellow Fatty 0.8990±0.043 1.466±0.021
Canola oil B2 Yellow Fatty 0.9613±0.020 1.468±0.007
Soybean oil B1 Yellow Fatty 0.9121±0.031 1.467±0.010
Soybean oil B2 Yellow Fatty 0.9391±0.012 1.466±0.021
Rapeseed oil Brownish yellow Fatty 0.9110±0.011 1.468±0.011
Blend Greenish yellow Fatty 0.9419±0.021 1.465±0.051
p-value 0.65 0.84
*
Table 2. Physicochemical properties of the selected oils and their blend
Oil Saponification value (mg KOH g-1 oil)
Acid value (mg KOH g-1 oil)
Peroxide value (mEqv. of O2 Kg -1
oil)
Sunflower oil *B1 206.25 ±5.82a** 0.442±0.009d 14.50±0.424b,c
Sunflower oil B2 184.32±5.12b 1.328±0.183a 16.50±0.707a,b
Corn oil B1 181.16±1.64b’c 0.641±0.045b’c 5.10±0.424e
Corn oil B2 186.81±3.56b 1.150±0.139a 6.60±1.979e
Canola oil B1 191.43±5.12b 0.324±0.013c;d 18.40±0.283a
Canola oil B2 185.98±4.73b 1.217±0.024 10.00±0.566d
Soybean oil B1 170.95±4.18c 0.756±0.041b 13.40±0.848c
Soybean oil B2 180.96±2.04b’c 1.136±0.020a 10.90±0.141d
Rapeseed oil 185.52±5.39 0.479±0.013c’d 9.80±0.001d
Blend 191.42±2.10b 1.157±0.108a 10.35±0.919d
Standard values 92 to 250 0.6 10
p-value 0.003 0.000 0.000
*
B1 and B2 indicate different brands using the oil from the seeds of the same plant. **
Mean±standard deviation of three replicates. The mean values labeled with different alphabets in the same column are statistically different at 95% confidence level (p≤0.05) using Tukey’s multiple range tests
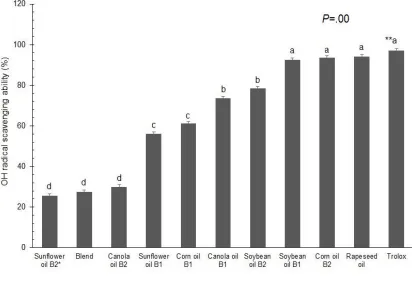
Fig. 2. Hydroxyl radical scavenging ability of oil samples of different brands
*
B1 and B2 indicate different brands using the oil from the seeds of the same plant **
The error bars represent the standard deviation of three parallel replicates. The error bars labelled with different alphabets are statistically different at 95% confidence level (p≤0.05) using Tukey’s multiple range tests
3.3 Screening Tests
The screening of the selected oils confirmed the presence of vitamin A in the selected oils except sunflower oil B1, corn oil B1 and canola oil B1 which were found to be deficient in vitamin A.
According to the PSQCA, the oils deficient in vitamin A possess relatively low nutritional quality.
B1 showed positive signs of rancidity which may be attributed to relatively high peroxide value in these oils.
3.4 Antioxidant Potential
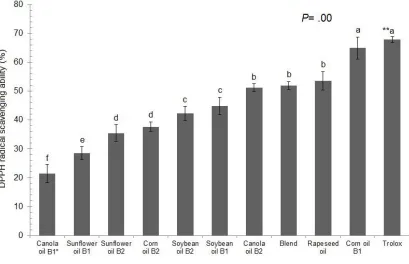
The antioxidant potential of the selected oils was determined in terms of OH-RSC and DPPH RSC. The results for OH-RSC and DPPH-RSC of the selected oils are presented in increasing order in Fig. 2 and Fig. 3 respectively. The OH-RSC and DPPH-RSC of the selected oils ranged from 27.5±2.121 to 97±1.01 and 21.36±3.181 to 64.97±3.783% respectively.
A statistically significant difference (P=.00) was
observed in the free radical scavenging capacity of different oils and their blend.
Rapeseed oil and corn oil B1 showed comparatively higher OH-RSC and DPPH-RSC respectively. Sunflower oil B2, canola oil B2 and blend showed comparatively lower OH-RSC and canola oil B1 showed lowest DPPH-RSC. However, the scavenging capacity of all of the selected oils against both of the free radicals was
found to be lower than that of Trolox, a standard antioxidant.
The OH and DPPH radicals are the types of reactive oxygen species (ROS) and reactive nitrogen species (RNS). Both the ROS and RNS are produced in our body during the redox reaction in routine and cause oxidative damage to biomolecules if let uncontrolled. The substances which have the ability to donate electrons act as potent scavengers of these reactive species, reduce the oxidative stress and protect from oxidative damage to food materials and living system [27]. In present study, the rapeseed oil and corn oil B1 were found to be comparatively more stable towards oxidative stress due to high value of free radical scavenging capacity. The higher free radical scavenging capacity also provide an evidence that these rapeseed oil and corn oil B1 are comparatively rich in antioxidant compounds which may be helpful in preventing the oxidative damage in human. It may also be correlated with relatively lower saponification, acid and peroxide values with no signs of oxidative rancidity in both of these oils.
Fig. 3. DPPH radical scavenging ability of oil samples of different brands
*
B1 and B2 indicate different brands using the oil from the seeds of the same plant. **
Table 3. Screening of vitamin A and rancidity in the selected oils and the blend
Samples Vitamin A Rancidity
Sunflower *B1 - -
Sunflower B2 + +
Corn oil B1 - -
Corn oil B2 + -
Canola oil B1 - +
Canola oil B2 + -
Soybean oil B1 + +
Soybean oil B2 + -
Rapeseed oil + -
Blend + +
*
B1 and B2 indicate different brands using the oil from the seeds of the same plant
4. CONCLUSION
It is concluded that the selected cooking oils possess good physical properties. The sunflower oil B2 was found to be of low quality due to relatively high saponification, acid and peroxide value. The quality of corn oil B2, canola oil B2 and the blend was also found to be low due to high acid value. The sunflower oil B1, canola oil B1 and soybean oil B1 showed comparatively higher peroxide values with clear signs of rancidity. However, the rapeseed oil and corn oil B1 showed relatively lower saponification, acid and peroxide values with no signs of oxidative rancidity. Both of these two oils were also found to possess comparatively higher antioxidant potential in terms of free radical scavenging capacity. Therefore, the rapeseed oil and corn oil B1 were found to be the best among the selected oil due to acceptable physical, physicochemical and antioxidant properties. The study results provide valuable information to the consumers and the researchers for selection of the best quality cooking oils.
COMPETING INTERESTS
Authors have declared that no competing interests exist.
REFERENCES
1. Fillion L, Henry CJK. Nutrient losses and gains during frying: A review. Int J Food Sci Nutr 1998;49:157-168.
2. Gunstone F. Vegetable oils in food technology: Composition, properties and uses. John Wiley & Sons; 2011.
3. Tvrzicka E, Kremmyda L-S, Stankova B, Zak A. Fatty Acids as biocompounds: Their role in human metabolism, health and disease-A review. Part 1: Classification, Dietary sources and biological functions. Biomed Pap Med Fac Palacky Univ Olomouc. 2011;155.
4. Koz\lowska M, Gruczyńska E, Ścibisz I, Rudzińska M. Fatty acids and sterols composition, and antioxidant activity of oils extracted from plant seeds. Food Chem 2016;213:450-456.
5. Simopoulos AP. Omega-3 fatty acids in health and disease and in growth and development. Am J Clin Nutr. 1991;54: 438–463.
6. Bhardwaj S, Passi SJ, Misra A, Pant KK, Anwar K, Pandey RM, et al. Effect of heating/reheating of fats/oils, as used by Asian Indians, on trans fatty acid formation. Food Chem. 2016;212:663–670. 7. Shahidi F. Quality assurance of fats and
oils. Baileys Ind Oil Fat Prod. 2005. 8. Frankel EN. Antioxidants in lipid foods and
their impact on food quality. Food Chem. 1996;57:51–55.
9. Ekwu FC, Nwagu A. Effect of processing on the quality of cashew nut oils. J Sci Agric Food Tech Env. 2004;4:105–110. 10. Kostik V, Memeti S, Bauer B. Fatty acid
composition of edible oils and fats. J Hyg Eng Des. 2013;4:112–116.
11. Shad MA, Pervez H, Zafar ZI, Nawaz H, Khan H. Physicochemical properties, fatty acid profile and antioxidant activity of peanut oil. Pak J Bot. 2012;44:435– 440.
12. Siger A, Nogala-Kalucka M, Lampart-Szczapa E. The content and antioxidant activity of phenolic compounds in cold-pressed plant oils. J Food Lipids. 2008;15: 137–149.
13. Paquot C. Standard methods for the analysis of oils, fats and derivatives. Elsevier; 2013.
14. Ariponnammal S. A novel method of using refractive index as a tool for finding the adultration of oils. Res J Recent Sci. 2012; ISSN 2277:2502.
15. Sadasivam S, Manickam A. Biochemical Methods New Age International (P) Ltd. Publ New Delhi; 1996.
17. Pool MF, Prater AN. A modified kreis test suitable for photocolorimetry. Oil Soap. 1945;22:215–216.
18. Smirnoff N, Cumbes QJ. Hydroxyl radical scavenging activity of compatible solutes. Phytochemistry. 1989;28:1057– 1060.
19. Sánchez-Moreno C, Larrauri JA, Saura-Calixto F. A procedure to measure the antiradical efficiency of polyphenols. J Sci Food Agric. 1998;76:270–276.
20. Hussain R, Hussain A, Khan A, Sattar S, Zeb M, Hussain A, et al. Physico-chemical properties and assessment of edible oil potential of peanuts grown in Kurram Agency, Parachinar. Pak J Anal Environ Chem. 2015;16:7.
21. Singh P. Physico-chemical investigations of Mustard seed (Brassica juncea L). Int J Sci Res Multidiscip Stud.2018;4(6).
22. Ngadi M, Li Y, Oluka S. Quality changes in chicken nuggets fried in oils with different degrees of hydrogenatation.
LWT-Food Sci Technol. 2007;40:1784– 1791.
23. Khodier SA. Refractive index of standard oils as a function of wavelength and temperature. Opt Laser Technol. 2002;34: 125–128.
24. Alimentarius C. Codex standard for named vegetable oils. Codex Stan. 1999;210:1-13.
25. Mohammed MI, Hamza ZU.
Physi-cochemical properties of oil extracts from Sesamum Indicum L. seeds grown in Jigawa State–Nigeria. J Appl Sci Environ Manag. 2008;12.
26. Neagu A-A, Niţă I, Botez E. Correlations
between some physico-chemical
properties of sunflower oil. Analele Univ Ovidius Constanta-Ser Chim. 2014;25:71– 74.
27. Lin J-M, Lin C-C, Chen M-F, Ujiie T, Takada A. Scavenging effects of Mallotus repandus on active oxygen species. J Ethnopharmacol. 1995;46:175–181.
© 2019 Nawaz et al.; This is an Open Access article distributed under the terms of the Creative Commons Attribution License (http://creativecommons.org/licenses/by/4.0), which permits unrestricted use, distribution, and reproduction in any medium, provided the original work is properly cited.
Peer-review history: