*Corresponding author:Lakshmi Madhuri P
ISSN: 0976-3031
Research Article
PI CONTROLLER BASED GRID CONNECTED PV ARRAYS
Lakshmi Madhuri P* and Bharathi G
Department of Electrical and Electronics Engineering
DOI: http://dx.doi.org/10.24327/ijrsr.2017.0811.1089
ARTICLE INFO ABSTRACT
Today and in the future, the increase of fuel price, deregulation and environment constraints give more opportunities for the usage of the renewable energy sources (RES) such as wind and solar are used in power systems. The integration of RES into a micro grid can cause challenges and impacts on micro grid operation. The Photovoltaic system consists of PV panels connected through DC-DC converter and DC-AC inverter to the grid and maximum power point tracking is obtained by using MPPT algorithm. The control strategy of 100kW photovoltaic grid-connected inverter is proposed such as MPPT, current control and voltage control. The precision and effectiveness of this control strategy are verified by the computer simulations using MATLAB/SIMULINK. The system is proved to be effective with reduced harmonics while injection of power from PV to grid by maintaining constant DC bus voltage using PI controller.
INTRODUCTION
Solar renewable energy harvesting is the demand of the century because of the huge energy requirement of the world today. India, being a home to a huge population witnesses high incident solar radiations throughout the year. Energy harvested from the sun is a necessarily a valuable source but still, most of it’s part goes unutilised in Indian subcontinent although being a tropical region. Numbers of efforts are being undertaken by the Governments around the world to explore alternative energy sources and to achieve pollution reduction. Solar electric or photovoltaic technology is one of the biggest renewable energy resources to generate electrical power and the fastest growing power generation in the world. Micro grids can be practical building blocks of smart grid, where several distributed generation (DG) units are combined with sophisticated command and control algorithms [1]-[2]. A Grid Connect solar PV system is a type of electrical inverter that converts direct current electricity from PV module into alternating current (AC). When the PV system is connected to the grid, it can transfer the extra energy to the grid after fulfilling the local demand. But when the system generates less than what is required to support the local demand, than extra energy is extracted from the grid. Thus PV solar energy acts as an alternative resource of electricity. The PV system, designed in this work, aims to transfer electrical power from PV panels to the grid. First, a dc-dc Converter is used to boost up PV voltage to a level higher than the peak of grid voltage. The converter
also tracks the maximum power point of PV module [3]. There are many algorithms for tracking maximum power point. In this system, Incremental conductance method is used. Then, a pulse width modulation (PWM) based dc-ac inverter [4] (voltage source inverter) is used for enforcing sinusoidal voltage waveform with matching phase frequency with grid voltage. The design of PLL with
implementation structures like dqand stationary and synchronous reference frame structures are able to compensate low-order harmonics present in the utility network [8]-[9]. The micro grid is able to handle different operating conditions effectively during grid-connected and islanded operations, and thus increasing the overall reliability and stability of the micro grid [10]-[11].
Block Diagram
The block diagram of the system is depicted in Fig.1
Fig 1 Block diagram of grid-tied PV system
Available Online at http://www.recentscientific.com
International Journal of
Recent Scientific
Research
International Journal of Recent Scientific Research
Vol. 8, Issue, 11, pp. 21522-21529, November, 2017
Copyright © Lakshmi Madhuri P and Bharathi G, 2017, this is an open-access article distributed under the terms of the Creative Commons Attribution License, which permits unrestricted use, distribution and reproduction in any medium, provided the original work is properly cited.
DOI: 10.24327/IJRSR
CODEN: IJRSFP (USA)
Article History:
Received 17th August, 2017 Received in revised form 12th September, 2017
Accepted 04th October, 2017
Published online 28th November, 2017
Key Words:
Photovoltaic Cell
A PV module is a packaged assembly of solar cells connected either in series or in parallel to get desired power, voltage and current levels. Group of photovoltaic panels constitute PV array and generates and supplies solar electricity in commercial and residential applications.
Table 1 Specifications of PV Array
S.no Specification Rating
1 Maximum Power P max 305.226 Wp
2 Open Circuit Voltage Voc 64.2 V
3 Maximum power point voltage Vmpp
54.7V
4 Short circuit current Isc 5.96 A
5 Maximum power point current I
mpp 5.58 A
Mathematical modelling of PV module
An ideal solar cell can be considered as a current source with current produced directly proportional to solar radiations falling on it. The practical behaviour of cell is deviated from the ideal due to the optical and electrical losses.
Fig 4 single diode equivalent circuit of solar cell
In this equivalent circuit, the optical loss is represented by current source itself, where generated current is proportion to light input. The recombination losses are represented by diode connected parallel to current source, but in reverse direction as recombination current flows in opposite direction to light generated current. The ohmic loss in the cell occurs due to the series and shunt resistances are denoted by Rs and Rsh
respectively. The equations describing I-V characteristics of PV cell are represented by,
I = I − I (e ( )− 1) 1
I = ∗ I ( )(1 + K (T − T )) 2
I = I ( )∗ ^3 ∗ e ∗ ( − ) 3
MPPT Algorithm
Boost circuit can increase the output voltage of solar cells. According to voltage-current characteristic of solar cells, adjusting duty ratio of Boost circuit can adjust the operating voltage of solar cells, which will guarantee that photovoltaic arrays can work at the maximum power point.
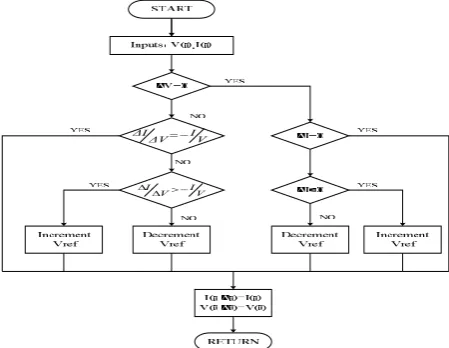
The incremental conductance method is used for controlling the boost converter for MPPT.
V I ΔV
ΔI
V I V
I
Fig 5 Flow chart of MPPT Incremental Conductance method
Proposed Methodology
Control of Grid - Tied Inverter
The control strategy consists of two loops namely DC voltage outer loop and AC current inner loop.
*
o i
* q i *
d i 1 i
2 i
3 i
id iq io
VDC
VDC
*
CDC1
CDC2
Cf
Fig 6 Layout of the grid- tied inverter
International Journal of Recent Scientific Research Vol. 8, Issue, 11, pp. 21522-21529, November, 2017
The DC voltage outer loop adopts PI control, and maintains the DC bus voltage constant which gives out a given value of grid connected power, and grid-connected power changes with the input power of photovoltaic arrays.
DC Voltage Outer Loop
When the environmental change causes the decrease of input power of photovoltaic arrays, the output power of inverter are larger than the input power of photovoltaic arrays, in which will cause the decrease of DC bus voltage. The controller will detect this change of DC bus voltage, and decrease the given value of grid connected power by the control of DC voltage outer loop. The grid-connected power of inverter will decrease and guarantee the steady DC bus voltage. When the input power of photo voltaic arrays is larger than the output power of inverter, it will cause the increase of DC bus voltage. The controller will detect this change of DC bus voltage, and increase the given value of grid connected power by the control of DC voltage outer loop. The output power of inverter will increase and guarantee the steady DC bus voltage and realize the decoupling transmission from DC to AC.
AC Current Inner Loop
AC current inner loop adopts the strategy of feed-forward decoupling control. The control system collects the instantaneous value of DC bus voltage, grid-connected current and grid voltage timely, and then calculates control pulse width of each bridge arm, and tracks the given value of grid-connected power obtained by DC voltage outer loop.
Grid Synchronization
To achieve power flow between the renewable resource generator and the utility network, the injected current needs to be synchronized with the grid voltage. The main purpose is to obtain the phase information of grid voltages. Transformation from natural reference frame to stationary or synchronous reference frame may be required to make this possible. The Phase Locked Loop, PLL is the most widely used method for grid synchronization. A brief explanation of PLL is presented below.
Phase Locked Loop
A Phase lock loop is mainly used to synchronize the frequency of the inverter with that of the utility grid.
Fig 7 Synchronous Reference Frame PLL
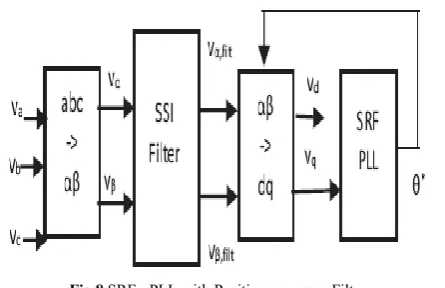
Fig 8 SRF - PLL with Positive sequence Filter
A dq – PLL is used for synchronization purpose which is based on the Park’s dq-transformation and will therefore be affected by unsymmetrical grid conditions. The sequence separation method will be used as a pre-filter to give only the positive sequence onto the PLL. It carries out two tasks simultaneously. First it stabilizes the PLL within unsymmetrical conditions. Second it ensures the required orientation of the current.
Here Stationary Reference Frame PLL is used. The stationary abc voltages are transformed in Vd, Vq voltages using the
Clarke and Park transforms. The angle ∗ is found integrating the output ∗ of the PI regulator. The voltages Vd and Vq
appear as dc quantities.
In Synchronous reference frame, the sinusoidal variables are transformed into a frame that rotates at synchronous speed with sinusoidal variables, which makes these quantities appear as DC values. The PI controllers can be used as they provide satisfactory results when dealing with DC quantities. The SRF – PLL yields to good results under undistorted and balanced supply voltages. But under distorted or unbalanced supply voltages, the output of PLL becomes distorted. Hence, we go for Synchronous Reference Frame PLL with Positive Sequence filter. It uses digital resonant elements as sinusoidal signal integrators (SSI). The use of SSI filters allows delivering the fundamental positive related to voltage distortions and imbalances and it acts as a sequence separator. Positive Sequence (+) as well as Negative Sequence (-) can be isolated in αβ coordinates be smartly setting the signals against their orthogonal components. Common goal of three separation methods is the creation of the orthogonal component.
Fig 9 Positive sequence Filter used in SRF - PLL
SIMULATION AND RESULTS
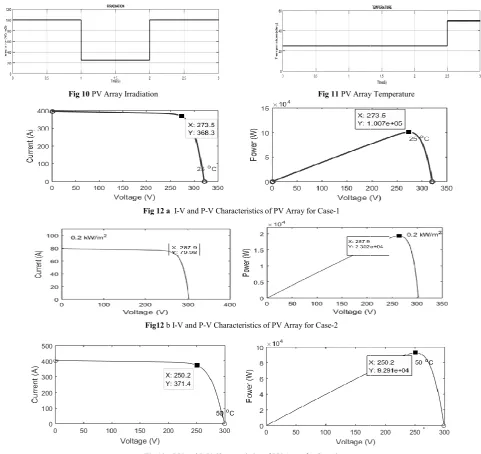
Case 1: Irradiance (G) = 1000 w/m2, Temperature (T) = 25 Case 2: Irradiance (G) = 200 w/m2, Temperature (T) = 25 Case 3: Irradiance (G) = 1000 w/m2, Temperature (T) = 50 The P-V and I-V characteristic curves for the above cases are given in Fig. 12 (a), (b), (c).
MPPT Curves
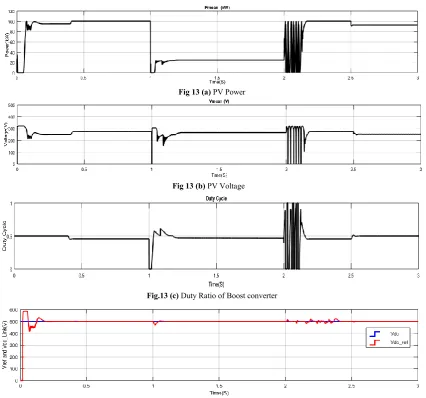
In case-1, with the input insolation to the PV system is set at 10000C and temperature at 25oC, the maximum power available is 100.7 kW. The PV system connected to the inverter through the boost converter is controlled using incremental conductance method and the tracking curves of the PV power, PV voltage and the duty ratio are given in Figure13. The figure shows that the maximum power tracked by
close to 100 kW and hence the MPPT is achieved for the case 1. Similarly the maximum powers obtained for the other two cases i.e., case 2 and case 3 is 23.02 kW and 92.91 kW respectively. However, the tracking curves have ripples during the case transition times. It was observed that the PV voltage operates at 274 V however, the MPP voltage is 273V and the small voltage variation is negligible.
Fig 10 PV Array Irradiation
Fig
Fig12
Fig
, Temperature (T) = 25oC Temperature (T) = 25oC , Temperature (T) = 50oC V characteristic curves for the above cases are
1, with the input insolation to the PV system is set at C, the maximum power system connected to the inverter through the boost converter is controlled using incremental conductance method and the tracking curves of the PV power, PV voltage and the duty ratio are given in Figure13. The figure shows that the maximum power tracked by the PV system is close to 100 kW and hence the MPPT is achieved for the case-1. Similarly the maximum powers obtained for the other two cases i.e., case 2 and case 3 is 23.02 kW and 92.91 kW respectively. However, the tracking curves have ripples during he case transition times. It was observed that the PV voltage operates at 274 V however, the MPP voltage is 273V and the
Fig.13(c) shows the varying duty cycle of the switch of the boost converter for extracting maxi
During the case-1 duty ratio of the converter is around 0.455. The duty cycle of the boost converter is increased to 0.62 with the change in insolation from 1000w/m
case-3 is initiated, the algorithm starts tracking the new maximum point and the duty ratio at steady state is equal to 0.5.
DC-LINK Curves
The DC Link voltage is controlled by the voltage controller so that the power available from the PV array is equal to the power delivered to the grid. The reference signal for the voltage controller and the resulting dc link voltage is shown is fig.14.
PV Array Irradiation Fig 11 PV Array Temperature
12 a I-V and P-V Characteristics of PV Array for Case-1
Fig12 b I-V and P-V Characteristics of PV Array for Case-2
12 c I-V and P-V Characteristics of PV Array for Case-3
Fig.13(c) shows the varying duty cycle of the switch of the boost converter for extracting maximum power from the array.
1 duty ratio of the converter is around 0.455. The duty cycle of the boost converter is increased to 0.62 with the change in insolation from 1000w/m2 to 200w/m2. When the 3 is initiated, the algorithm starts tracking the new maximum point and the duty ratio at steady state is equal to
The DC Link voltage is controlled by the voltage controller so that the power available from the PV array is equal to the power delivered to the grid. The reference signal for the voltage controller and the resulting dc link voltage is shown is
International Journal of Recent Scientific Research Vol. 8, Issue, 11, pp. 21522-21529, November, 2017
When the ambient conditions change, the actual DC-Link voltage also changes, but the voltage controller pulls it back to the desired value by adjusting the power transfer to the grid.
Inverter Curves
The inverter takes the DC Link Voltage and inverts it into an AC signal. This AC signal is a two-level signal. The line to line voltage swings between -VDC LINK to +VDC Link as shown in
figure 14. The signal shown is in the form of pulses with varying widths according to the amplitude of the reference sine wave. The fundamental frequency of this signal equals the grid frequency, which is 50 Hz.
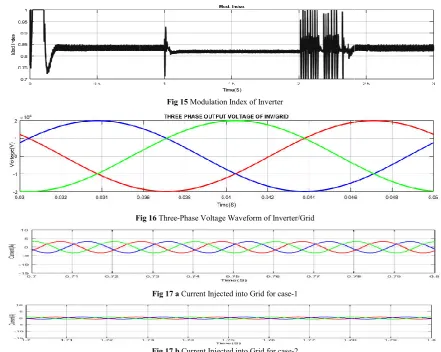
Modulation Index
The modulation index of the inverter is shown in fig.15. The appropriate modulation index is generated by the voltage controller in order to maintain the DC bus voltage constant and also to ensure the minimum total harmonic distortion. The steady state modulation indexes of the inverter in three cases considered are closed to 0.84, 0.81 and 0.83.
Three-Phase Voltage and Current Waveforms
After Synchronization of the inverter output with the grid, the inverter latches on to the grid voltages and the resulting
3-phase voltage waveform is shown in fig.16. The signals have a frequency of 50Hz and a magnitude of 20 kV Vpeak.
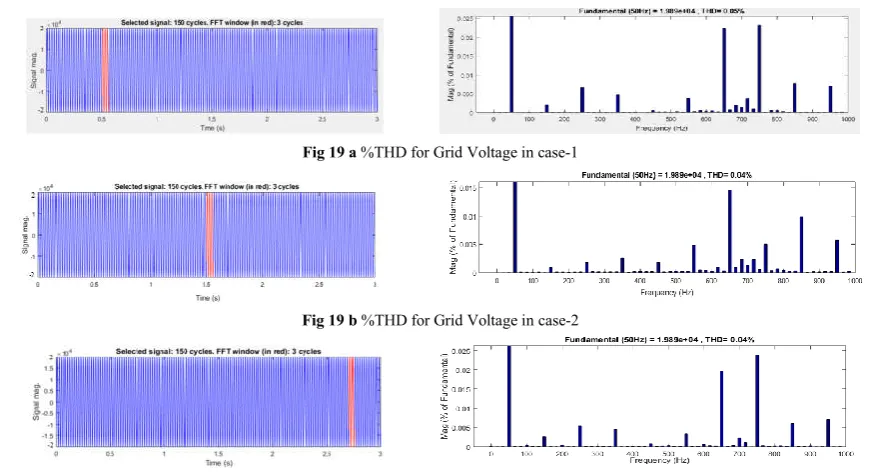
The three-phase current injected into the grid is shown in fig.17. The magnitude of current of each phase is around in three cases: case-1, case-2 and case-3 are 2.351 A (rms), 0.56 A (rms) and 2.173 A (rms) respectively. The magnitude of harmonics present in the injected current with respect to the magnitude of current at fundamental frequency for phase A and Total Harmonic Distortion of the injected current is shown in fig.18 for all the three cases. This figure shows that the total harmonic distortions are 2.65%, 6.77% and 2.70% respectively and under all cases the harmonics are in reasonable limits. Similarly, the harmonic analysis is carried out for grid voltages and total harmonic distortions are under 0.5% in all the cases as shown in Fig.19. For better understanding, the %Total Harmonic Distortion are presented in Table.2.
Fig 13 (a) PV Power
Fig 13 (b) PV Voltage
Fig.13 (c) Duty Ratio of Boost converter
Fig 16
Fig 15 Modulation Index of Inverter
Fig 16 Three-Phase Voltage Waveform of Inverter/Grid
Fig 17 a Current Injected into Grid for case-1
Fig 17 b Current Injected into Grid for case-2
Fig 17 c Current Injected into Grid for case-3
Fig 18 a %THD for Current injection in case-1
Fig 18 b %THD for Current injection in case-2
International Journal of Recent Scientific Research Vol. 8, Issue, 11, pp. 21522-21529, November, 2017
Table 2 FFT Analysis for Grid Voltage and Current
Case %THD for Grid Voltage
%THD for Grid Current
1 0.05% 2.65%
2 0.04% 6.77%
3 0.04% 2.60%
Output Power
The power delivered to the grid is shown in figure 20. The figure shows that there is a balance between PV generated power and the grid injected power except a little mismatch in tens of watt Total system power 100kw and therefore the DC bus voltage is maintained at constant value irrespective of change in insolation and temperature. The mismatch in power is due to losses incurred in the boost converter, inverter and the transformer.
Fig 20 Grid Power
CONCLUSION
This paper implemented few control strategies for grid-tied PV generation system to extract maximum power point tracking and to inject the voltages and currents at minimum THD. The system consists of PV modules connected to the grid through the boost converter and inverter. The boost converter is controlled for MPPT and inverter is controlled to mitigate the harmonic injection into the grid. In this process, the DC bus voltage is regulated to a desired value using PI controller.
The maximum power point tracking is implemented and the simulations are performed under different irradiation and temperature conditions using incremental conductance method. The MPP tracking curves, duty ratio of the boost converter are presented to show the efficacy of the control algorithm. The voltage control and current control in-conjunction with phase locked loop is implemented to inject the voltage and currents
with reduced THDs. The simulation results such as steady state grid voltage, steady state grid current, modulation index, FFT analysis of grid voltage, FFT analysis of grid current and the power injected to the grid are presented. The results shows that the control logic implemented successfully tracks maximum power point and injects the voltage and current with the acceptable limits of THD under any atmospheric conditions.
References
1. S.S. Dheeban and Dr. V. Kamaraj, “Grid Integration of 10kW Solar Panel”, 3rd International Conference on Electrical Energy Systems, pp.257-266, 2016.
2. I. Chung, W. Liu, D. A. Cartes, E. G. Collins, and S. Moon, “Control methods of inverter- interfaced distributed generators in a micro grid system,” IEEE Trans. Ind. Appl., vol. 46, no.3, pp. 1078-1088, May/Jun. 2010.
3. J.Young-Hyok, J. Doo-Yong, K. Jun-Gu, K. Jae-Hyung, L. Tae-Won, and W. Chung-Yuen, “ A real maximum power point tracking method for mismatching compensation in PV array under partially shaded conditions,” IEEE Transactions on Power Electronics, volume 26, no. 4, pp.1001-1009, April.2011.
4. Lin Chen ,Member, Ahmadreza Amirahmadi, Qian Zhang, Nasser Kutkut, and Issa Batarseh, “ Design and Implementation of Three-Phase Two- stage Grid-Connected Module Intergrated Converter”, IEEE Transactions on Power Electronics, volume 29, no. 8, August 2014.
5. Sidharth Rajamohan, Chelladurai Vignesh, “Modelling of Solar Array and Design of a vector based Dual Band Hysteresis Current Control Technique for a Three-Phase Grid Connected PV system”, 2012- International Conference on Emerging Trends in Science, Engineering and Technology.
6. Md. Nahid Hossain, Tushar Kanti Routh, Abdul Hamid Bin Yousuf, Miah Md, Asasduzzaman, Md. Iqdal Hossain, Ummul Husnaeen, “ Design and Development of a Grid Tied Solar Inverter”, IEEE/OSA/IAPR
Fig 19 a %THD for Grid Voltage in case-1
Fig 19 b %THD for Grid Voltage in case-2
International Conference on Infonnatics, Electronics and Vision, 2012 IEEE.
7. Christian H. Benz, W.-Toke Franke, Friedrich W. Fuchs, “Low Voltage Ride Through Capability of a 5kW Grid-Tied Solar Inverter”, 14th International Power Electronics and Motion Control Conference, EPE-PEMC 2010.
8. F. Blaabjerg, R. Teodorescu, M. Liserre, A.V. Timbus “ Overview of Control and Grid Synchronization for Distributed Power Generation Systems”, IEEE Transactions on Industrial Electronics, volume 53, no. 5, pp.1398-1409,Oct.2006.
*******
How to cite this article: