T
T
h
h
e
e
r
r
a
a
n
n
o
o
s
s
t
t
i
i
c
c
s
s
2012; 2(3):295-301. doi: 10.7150/thno.3912Research Paper
Competitive Performance of Carbon “Quantum” Dots in Optical Bioimaging
Li Cao, Sheng-Tao Yang, Xin Wang, Pengju G. Luo, Jia-Hui Liu, Sushant Sahu, Yamin Liu, Ya-Ping Sun
Department of Chemistry and Laboratory for Emerging Materials and Technology, Clemson University, Clemson, South Carolina 29634-0973, USA.
Corresponding author: Tel: 864-656-5026, Fax: 864-656-6613, E-mail: [email protected]
© Ivyspring International Publisher. This is an open-access article distributed under the terms of the Creative Commons License (http://creativecommons.org/ licenses/by-nc-nd/3.0/). Reproduction is permitted for personal, noncommercial use, provided that the article is in whole, unmodified, and properly cited.
Received: 2011.12.04; Accepted: 2012.01.01; Published: 2012.03.07
Abstract
Carbon-based “quantum” dots or carbon dots are surface-functionalized small carbon nanoparticles. For bright fluorescence emissions, the carbon nanoparticles may be sur-face-doped with an inorganic salt and then the same organic functionalization. In this study, carbon dots without and with the ZnS doping were prepared, followed by gel-column frac-tionation to harvest dots of 40% and 60% in fluorescence quantum yields, respectively. These highly fluorescent carbon dots were evaluated for optical imaging in mice, from which bright fluorescence images were obtained. Of particular interest was the observed competitive performance of the carbon dots in vivo to that of the well-established CdSe/ZnS QDs. The results suggest that carbon dots may be further developed into a new class of high-performance yet nontoxic contrast agents for optical bioimaging.
Key words: Carbon dots, fluorescence, optical bioimaging, quantum dots.
1. Introduction
Small carbon nanoparticles have been shown as versatile precursors for brightly fluorescent nano-dots [1-15], with the observed optical properties in solution phenomenologically similar to and performance-wise comparable with those of the well-established semi-conductor quantum dots (QDs) [9, 16-19]. Structurally, the fluorescent carbon-based “quantum” dots (or of-ten referred to as carbon dots) are small carbon na-noparticles with relatively simple particle surface functionalization [1,2,7,10,11]. Carbon dots with oli-gomeric polyethylene glycol diamine (PEG1500N,
Scheme 1/Figure S1) [20] as the surface functionaliza-tion agent were shown to be nontoxic [21], amenable to fluorescence bioimaging applications in vitro and in vivo [10,11,22,23]. More recently, highly fluorescent carbon dots with emission quantum yields more than 50% were obtained by surface-doping the core carbon nanoparticles with an inorganic salt such as ZnS (Scheme 1/Figure S1) or TiO2 [20,24], and/or by
ap-plying a gel-column fractionation scheme to the as-synthesized carbon dots samples [9,20]. The brighter dots thus harvested promise more and better opportunities for fluorescence bioimaging, especially for uses in vivo to improve the contrast against tissue background. Here we report an experimental valida-tion on the use of these highly fluorescent carbon dots for imaging in mice, with especially a demonstration on the competitive performance of these dots to that of the well-established semiconductor QDs under purposely matching experimental conditions.
2. Experimental Section
2.1. MaterialsCarbon nano-powders, O,O’-bis(3-aminopropyl) polyethylene glycol (MW ~ 1,500, PEG1500N) and
thio-nyl chloride (>99%) were purchased from Aldrich, zinc acetate dihydrate (Zn(OOCCH3)2•2H2O, >98%)
and sodium sulfide (Na2S•9H2O, >98%) from Alfa,
and nitric acid, N,N-dimethylformamide (DMF, 99%), and sodium dodecyl sulfate (SDS, 99%) from VWR. The aqueous CdSe/ZnS quantum dots solution (Qdot® 525 ITK™ amino (PEG) QDs) was acquired from Invitrogen. Millipore Durapore membrane fil-ters (pore size 0.22 μm) and dialysis membrane tubing were supplied by Spectrum Laboratories. Water was deionized and purified by being passed through a Labconco WaterPros water purification system.
Figure S1. (Scheme 1) Cartoon illustrations of non-doped (left) and doped (right) carbon dots [20].
2.2. Measurement
Baxter Megafuge (model 2630) and Beck-man-Coulter ultracentrifuge (Optima L90K with a type 90 Ti fixed-angle rotor) were used. UV/vis ab-sorption spectra were recorded on a Shimadzu UV2101-PC spectrophotometer. Fluorescence spectra were measured on a Jobin-Yvon emission spectrome-ter equipped with a 450 W xenon source, Gemini-180 excitation and Tirax-550 emission monochromators, and a photon counting detector (Hamamatsu R928P
PMT at 950 V). Quinine sulfate and
9,10-bis(phenylethynyl)-anthracene were used as standards in the determination of fluorescence quan-tum yields by the relative method (matching the ab-sorbance at the excitation wavelength between the sample and standard solutions and comparing their corresponding integrated total fluorescence intensi-ties). Atomic force microscopy (AFM) images were acquired in the acoustic AC mode on a Molecular Imaging PicoPlus AFM system equipped with a mul-tipurpose scanner and a NanoWorld point probe NCH sensor. Transmission electron microscopy (TEM) characterization was carried out on Hitachi 9500 TEM and Hitachi HD-2000 S-TEM systems. Confocal fluorescence images were obtained on a Leica laser scanning confocal fluorescence microscope
(DM IRE2, with Leica TCS SP2 SE scanning system) equipped with an argon ion laser (JDS Uniphase). The fluorescence imaging in mice was performed on a MAG Biosystems Lumazone FA in vivo Imaging System equipped with an Asahi Max-301 xenon arc source for excitation through a liquid light guide and a Princeton Instruments PIXIS:1024B digital CCD camera system as detector. Band-pass and cut-off fil-ters were used for the selection of excitation and emission wavelengths.
2.3. Carbon Dots
A carbon nano-powder sample (2 g) was re-fluxed in an aqueous nitric acid solution (2.6 M, 200 mL) for 12 h. The mixture back at room temperature was dialyzed against fresh water, followed by centri-fuging at 1,000g to retain the supernatant. The sur-face-oxidized small carbon nanoparticles recovered from the supernatant (100 mg) were refluxed in neat thionyl chloride for 6 h. Upon the removal of excess thionyl chloride on a rotary evaporator with a vacu-um pvacu-ump, the sample was mixed well with PEG1500N
(1 g) in a flask. The mixture was heated to 110 °C, and vigorously stirred at that temperature under nitrogen protection for 3 days. The sample back at room tem-perature was dispersed in water, followed by centri-fuging at 25,000g to retain the supernatant as an aqueous solution of the as-prepared carbon dots. The sample solution was concentrated and then loaded onto a Sephadex G-100TM gel-column packed in house
for fractionation [9]. Fluorescence quantum yields of the fractions were determined, and those more fluo-rescent were combined into a single aqueous solution of carbon dots (40% in fluorescence quantum yield) for further characterization and bioimaging.
For the surface-doping with ZnS, the sur-face-oxidized carbon nanoparticles (600 mg) were dispersed in DMF (200 mL) via sonication for 30 min, and to the suspension was first added Zn(OOCCH3)2•2H2O (680 mg, 3.1 mmol) under
vig-orous stirring and then slow dropwise addition of an aqueous Na2S solution (0.62 M, 5 mL) at room
tem-perature. The mixture was centrifuged at 3,000g, and the precipitate was retained and repeatedly washed with distilled water to obtain the ZnS-doped carbon nanoparticles (881 mg).
The ZnS-doped carbon nanoparticles (200 mg) were dispersed in an aqueous SDS solution (1 wt%, 120 mL) via sonication for 30 min. Upon filtration, the filter cake was washed repeatedly with water and then dried. The solid sample was mixed thoroughly with PEG1500N (1.9 g), and the mixture was heated to
room temperature was dispersed in water, followed by centrifuging at 25,000g to retain the supernatant as an aqueous solution of as-prepared CZnS-Dots. The
sample solution was similarly concentrated and then fractionated on the same Sephadex G-100TM
gel-column [20]. Fluorescence quantum yields of the fractions were determined, and those more fluores-cent were combined into a single aqueous solution of CZnS-Dots (60% in fluorescence quantum yield) for
further characterization and bioimaging.
2.4. Imaging in Mice
All of the animal experiments were performed at Clemson University by strictly following the IACUC (Institutional Animal Care and Use Committee) ap-proved protocols. Female DBA/1 mice (~25 g, ac-quired from Harlan) were housed in plastic cages (three mice/cage) at the Godley-Snell Research Center at Clemson University and kept on a 12 h light/dark cycle, with food and water provided ad libitum. Fol-lowing the acclimation of one week, the mice were randomly divided into groups of 3 mice per group for imaging evaluations. Throughout the imaging ex-periments the mice were kept under anaesthesia (3% isoflurane flow). Two injection modes (subcutaneous and front extremity) were used for the in vivo imaging. Before subcutaneous injection, the back area sur-rounding the injection point on the mouse was shaved to minimize autofluorescence. The control group in both injection modes was injected with equivalent volume of phosphate buffered saline (PBS). For the front extremity injection, the mice 24 h post-injection were sacrificed by CO2 treatment under anaesthesia.
The axillary lymph nodes were dissected for fluores-cence imaging. All images were processed and ana-lyzed by using the NIH-commissioned and supplied
ImageJ software (http://rsbweb.nih.
gov/ij/).
3. Results and Discussion
Small carbon nanoparticles (mostly less than 10 nm in diameter) were harvested from the commer-cially supplied carbon nano-powders (Aldrich) by first the aqueous nitric acid treatment and then a combination of dialysis to remove impurities and vigorous centrifuging to retain the supernatant. These nanoparticles were functionalized with PEG1500N in
classical amidation reaction to yield PEGylated car-bon dots (Scheme 1/Figure S1). The as-prepared sample was fractionated on a gel-column (SephadexTM
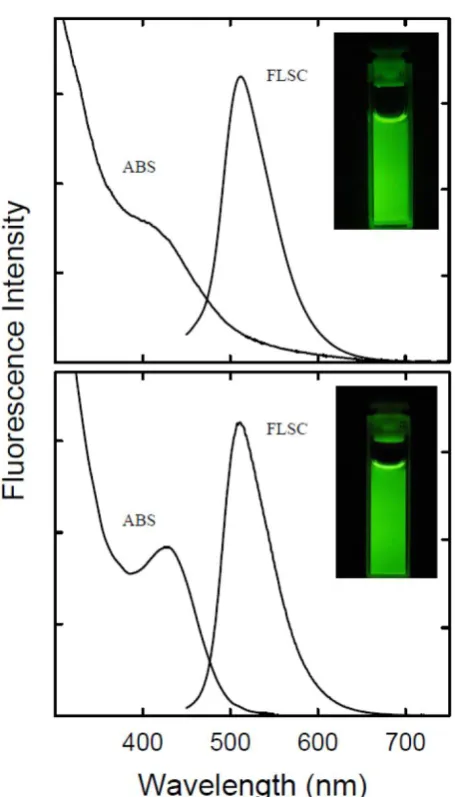
G-100) to harvest the more fluorescent portion of the sample [9], with the corresponding fluorescence quantum yield in the green of 40% (440 nm excitation, figure 1).
The sample solution was diluted for the prepa-ration of specimens for characterization by micros-copy techniques. Both AFM and TEM results showed dot-like images (figure 2), agreeing well with those for carbon dots reported previously [9].
Figure 2. TEM (left) and AFM (right) images of the carbon dots (without ZnS doping) used in the optical imaging experiments.
The carbon nanoparticles could be suspended in aqueous solution in a relatively stable fashion, thus serving as nucleation centers in the titration of zinc acetate with sodium sulfide for the formation of ZnS to yield ZnS-doped carbon nanoparticles [24]. The surface-doping level likely varied from particle to particle, so that a surfactant (sodium dodecyl sulfate or SDS)-assisted dispersion procedure in favor of the carbon nanoparticles with more ZnS doping was used to exclude those with no or a negligible level of dop-ing. Subsequently, those nanoparticles with the sur-face completely covered by ZnS (thus no accessible carboxylic acid moieties on the particle surface for reactions with amino molecules) were discriminated in the functionalization chemistry with PEG1500N [20].
The functionalization reaction conditions were similar to those used for carbon dots without the surface doping, resulting in ZnS-doped carbon dots (denoted
as CZnS-Dots). According to thermogravimetric
analy-sis (TGA), the estimated core composition in terms of C:ZnS molar ratio in the CZnS-Dots was about 20:1.
The as-prepared sample was similarly fractionated on the gel-column to harvest more fluorescent CZnS-Dots
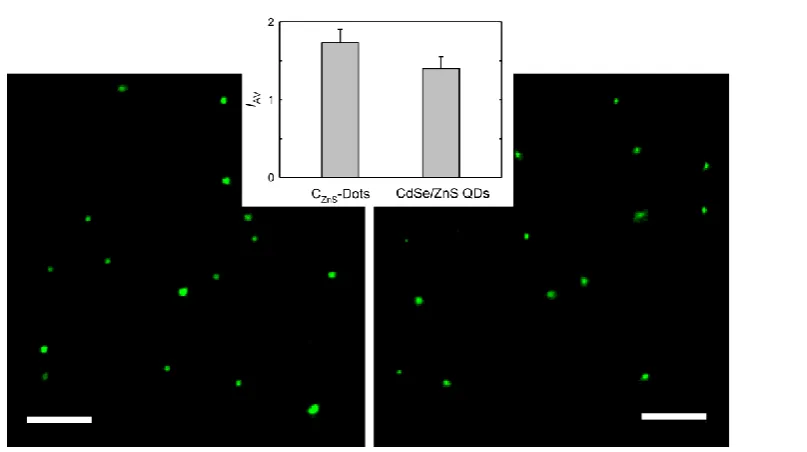
[20], with the observed fluorescence quantum yield in the green of 60% (440 nm excitation, figure 1). These dots were diluted for the preparation of specimens for characterization by AFM and TEM, and the repre-sentative results are shown in figure 3. The vigorously diluted solution was also used to disperse the dots on cover-glass surface for confocal fluorescence imaging under the same specimen and measurement condi-tions as those for commercially supplied CdSe/ZnS QDs (Invitrogen Qdot 525 ITKTM amino (PEG) QDs,
fluorescence quantum yield ~60% verified). As shown in figure 4, the well-dispersed CZnS-Dots and the
CdSe/ZnS QDs are quite similar in fluorescence brightness at essentially the individual dot level.
Figure 3. Representative TEM (left) and AFM (right) images of the ZnS-doped carbon dots (CZnS-Dots) used in the optical imaging
experiments.
Figure 4. Confocal fluorescence images (458 nm excitation, 10 μm for the scale bars) of the CZnS-Dots (left) and the commercially
The highly fluorescent carbon dots without and with the ZnS doping (quantum yields 40% and 60%, respectively) were evaluated in terms of fluorescence imaging in mice [23]. The animal experiments were performed by strictly following the IACUC (Institu-tional Animal Care and Use Committee) approved protocols. Female DBA/1 mice (~25 g) were housed in plastic cages (three mice/cage) at the Godley-Snell Research Center for animal research at Clemson Uni-versity on a 12 h light/dark cycle and provided with food and water ad libitum. Following the acclimation of one week, the mice were randomly divided into groups of three mice per group. For the injection and subsequent imaging, the mice were kept under anes-thesia with 3% isoflurane flow.
Before the subcutaneous injection, the back area surrounding the injection point on the mouse was
shaved to avoid autofluorescence. The injection vol-ume was kept at 20 µL, with the solution concentra-tion adjusted to match the targeted optical density at the excitation wavelength. As shown in figure 5, flu-orescence emissions from the subcutaneously injected dots could readily be detected in a Lumazone FA in vivo imaging system (MAG Biosystems), with a rela-tively shorter fluorescence collection time and im-proved imaging contrast in comparison with those in the use of as-prepared less fluorescent carbon dots [23]. The image brightness was obviously higher for the CZnS-Dots sample, consistent with the
corre-sponding higher fluorescence quantum yield in solu-tion. In mice the subcutaneously injected carbon dots diffused relatively slowly, with the gradual fading of fluorescence signals in about 24 h post-injection.
Figure 5. Top: Subcutaneously injected carbon dots (upper spot) and CZnS-Dots (lower spot) of similar optical densities in mice (470 nm
and 525 nm band-pass filters for excitation and emission, respectively). Bottom: Subcutaneously injected CZnS-Dots (upper spot) and
Invitrogen Qdot 525 ITKTM amino (PEG) QDs (lower spot) of similar optical densities in mice (434 nm band-pass filter for excitation and
In a comparison of fluorescence imaging per-formance with commercially supplied CdSe/ZnS QDs (Invitrogen Qdot 525 ITKTM amino (PEG) QDs),
the concentration of the subcutaneously injected QDs was adjusted such that the optical density was ap-proximately the same as that of the carbon dots in vivo. The resulting fluorescence images for CZnS-Dots
and the CdSe/ZnS QDs in mice were of similar brightness (figure 5), consistent with their similar fluorescence quantum yields in solution and compa-rable fluorescence imaging results at the individual dot level (figure 4).
For potential uses of carbon dots for fluorescence imaging in vivo, a relatively straightforward demon-stration is on tracking the migration of the dots through lymph vessels in mice following the paw injection [23,25,26]. For the highly fluorescent carbon dots without and with ZnS doping (quantum yields 40% and 60%, respectively), they could both migrate along the arm upon their intradermal injection into the front extremity (figure 6). However, the migration of the CZnS-Dots was apparently less pronounced,
with the relative brightness in the fluorescence images
(figure 6) of the migrated dots suggesting less CZnS-Dots (more fluorescent) migrated. The axillary
lymph nodes were harvested and dissected at 24 h post-injection, where strong fluorescence emissions from the carbon dots were observed (figure 6), further confirming the migration of the dots and the preser-vation of their fluorescence properties in vivo.
The improved optical imaging performance of these more fluorescent carbon dots in mice further confirms that the excellent fluorescence properties of carbon dots observed in solutions and on surface at the individual dot level are preserved in vivo, sug-gesting significant application potentials of carbon dots. Particularly encouraging is the fact that the in vivo performance of the carbon dots is competitive to that of the well-established CdSe/ZnS QDs, beyond the obvious advantage of carbon dots being nontoxic according to available experimental evaluations [10,11,21,27-29]. The results from this study justify the further development of carbon dots into a new class of high-performance yet benign contrast agents for op-tical bioimaging.
Figure 6. Intradermally injected carbon dots (upper) and CZnS-Dots (lower) of similar optical densities in mice, with images of dissected
Acknowledgment
This work was initiated and supported by funding from NIH and then from NSF. L.C. was supported by a Susan G. Komen for the Cure Postdoc-toral Fellowship. S.S. was a participant supported by Palmetto Academy, an education-training program managed by South Carolina Space Grant Consortium.
Conflict of Interest
The authors have declared that no conflict of in-terest exists.
References
1. Sun Y-P, Zhou B, Lin Y, et al. Quantum-sized carbon dots for bright and colorful photoluminescence. J. Am. Chem. Soc 2006; 128: 77561. -7757.
2. Cao L, Wang X, Meziani MJ, et al. Carbon dots for multiphoton bioimaging. J. Am. Chem. Soc 2007; 129: 11318-11319.
3. Bourlinos AB, Stassinopoulos A, Anglos D, et al. Surface func-tionalized carbogenic quantum dots. Small 2008;4: 455-458. 4. Bourlinos AB, Stassinopoulos A, Anglos D, et al.
Photolumi-nescent carbogenic dots. Chem. Mater 2008; 20: 4539-4541. 5. Tian L, Ghosh D, Chen W, et al. Nanosized carbon particles
from natural gas soot. Chem. Mater 2009;21: 2803-2809. 6. Hu S-L, Niu K-Y, Sun J, et al. One-step synthesis of fluorescent
carbon nanoparticles by laser irradiation. J. Mater. Chem 2009; 19: 484-488.
7. Peng H, Travas-Sejdic J. Simple aqueous solution route to lu-minescent carbogenic dots from carbohydrates. Chem. Mater 2009;21: 5563-5565.
8. Jiang HQ, Chen F, Kagally MG, Denes FS. New strategy for synthesis and functionalization of carbon nanoparticles. Langmuir 2010;26: 1991-1995.
9. Wang X, Cao L, Yang S-T, et al. Bandgap-like strong fluores-cence in functionalized carbon nanoparticles. Angew Chem. Int. Ed 2010;49: 5310-5314.
10. Li Q, Ohulchanskyy TY, Liu RL, et al. Photoluminescent carbon dots as biocompatible nanoprobes for targeting cancer cells in vitro. J. Phys. Chem. C 2010; 114: 12062-12068.
11. Qiao Z-A, Wang Y, Gao Y, et al. Commercially activated carbon as the source for producing multicolor photoluminescent car-bon dots by chemical oxidation. Chem. Commun 2010; 46: 8812-8814.
12. Li H, He X, Liu Y, et al. One-step ultrasonic synthesis of wa-ter-soluble carbon nanoparticles with excellent photolumines-cent properties. Carbon 2011;49: 605-609.
13. Li H, He X, Liu Y, et al. Synthesis of fluorescent carbon nano-particles directly from active carbon via a one-step ultrasonic treatment. Mater. Res. Bull 2011;46: 147-151.
14. Li X, Wang H, Shimizu Y, et al. Preparation of carbon quantum dots with tunable photoluminescence by rapid laser passivation in ordinary organic solvents. Chem. Commun 2011;47: 932-934. 15. Wang F, Pang S, Wang L, et al. One-step synthesis of highly
luminescent carbon dots in noncoordinating solvents. Chem. Mater 2010;22: 4528-4530.
16. Alivisatos AP. Semiconductor clusters, nanocrystals, and quantum dots. Science 1996;271: 933-937.
17. Bruchez M, Moronne M, Gin P, et al. Semiconductor nanocrys-tals as fluorescent biological labels. Science 1998;281: 2013-2016. 18. Wu X, Liu H, Liu J, et al. Immunofluorescent labeling of cancer
marker Her2 and other cellular targets with semiconductor quantum dots. Nat. Biotechnol 2003;21: 41-46.
19. Resch-Genger U, Grabolle M, Cavaliere-Jaricot S, et al. Quan-tum dots versus organic dyes as fluorescent labels. Nat. Meth-ods 2008;5: 763-775.
20. Anilkumar P, Wang X, Cao L, et al. Toward quantitatively fluorescent carbon-based "quantum'' dots. Nanoscale 2011;3: 2023-2027.
21. Yang S-T, Wang X, Wang H, et al. Carbon dots as nontoxic and high-performance fluorescence imaging agents. J. Phys. Chem. C 2009;113: 18110-18114.
22. Liu R, Wu D, Liu S, et al. An aqueous route to multicolor pho-toluminescent carbon dots using silica spheres as carriers. An-gew. Chem. Int. Ed 2009;48: 4598-4601.
23. Yang S-T, Cao L, Luo P, et al. Carbon dots for optical imaging in vivo. J. Am. Chem. Soc 2009;131: 11308-11309.
24. Sun Y-P, Wang X, Lu F, et al. Doped carbon nanoparticles as a new platform for highly photoluminescent dots. J. Phys. Chem. C 2008;112: 18295-18298.
25. Kim S, Lim YT, Soltesz EG, et al. Near-infrared fluorescent type II quantum dots for sentinel lymph node mapping. Nat. Bio-technol 2004;22: 93-97.
26. Ballou B, Ernst LA, Andreko S, et al. Sentinel lymph node im-aging using quantum dots in mouse tumor models. Bioconjug Chem 2007;18: 389-396.
27. Zhao Q-L, Zhang Z-L, Huang B-H, et al. Facile preparation of low cytotoxicity fluorescent carbon nanocrystals by electrooxi-dation of graphite. Chem. Commun 2008;: 5116-5118. 28. Ray SC, Saha A, Jana NR, Sarkar R. Fluorescent carbon
nano-particles: Synthesis, characterization, and bioimaging applica-tion. J. Phys. Chem. C 2009;113: 18546-18551.
![Figure S1. (Scheme 1) Cartoon illustrations of non-doped (left) and doped (right) carbon dots [20]](https://thumb-us.123doks.com/thumbv2/123dok_us/8743635.1746790/2.612.61.298.204.353/figure-scheme-cartoon-illustrations-doped-doped-right-carbon.webp)