Published by the
Iranian Chemical Society
Anal. Bioanal. Chem. Res., Vol. 6, No. 2, 449-456, December 2019.
Effects of Solvent, pH and Ionic Strength on the Fluorescence Features of Aflatoxin
B1, B2, G1 and G2
Karamali Ghalkhani
a,*, Mohammad Javad Chaichi
a,*, Mahdi Hashemi
band Mohammad
Hossein Fatemi
aa
Faculty of Chemistry, University of Mazandaran, Babolsar, Iran
b
Faculty of Chemistry, University of Bu-Ali Sina, Hamedan, Iran (Received 15 September 2018 Accepted 21 February 2019)
The effects ofenvironmental parameters, including solvent, pH and ionic strength on the fluorescence features of aflatoxin B1, B2, G1 and G2 were investigated. Fluorescence spectral characteristics such as fluorescence emission intensity, stokes shift and maximum emission wavelength were markedly affected by solvent type. The emission fluorescence peak of aflatoxins assessed was between 370 and 500 nm under a 360 nm excitation source. The maximum fluorescence intensities were obtained with ethanol and acetonitrile for all aflatoxins studied. The maximum displacements on emission wavelengths for aflatoxin B1, B2, G1 and G2 were obtained in methanol, dichloromethane, chloroform and acetonitrile, respectively. The maximum signal intensity was obtained in relatively low acidity values. Also, the study of ionic strength revolved that the maximum signals are obtained at 0.1 M NaCl. This study also shows that there is no need for another fluorophore for the study of investigated aflatoxins.
Keywords: Aflatoxin, Spectrofluorimetric, Solvent effect, Ionic strength, Mycotoxin, Carcinogen, Stokes shift
INTRODUCTION
Aflatoxins (AFs) are a group of mycotoxins produced as secondary metabolites by the spoilage of fungi Aspergillus, particularly Aspergillus flavus and Aspergillus parasiticus. The most important members of AFs are aflatoxin B1 (AFB1), aflatoxin B2 (AFB2), aflatoxin G1 (AFG1) and aflatoxin G2 (AFG2). The chemical structures of these AFs are shown in Fig. 1. They are highly toxic and carcinogenic compounds causing several diseases in livestock and humans [1].
AFs have been recognized by the International Agency of Research on Cancer (IARC) as a group 1 carcinogen for animals and humans [2]. The US FDA acceptable guideline for total AFs (B1, B2, G1 and G2) in food and feed products is 20 ng ml-1, the European Union limits the total of AF to only 4 ng ml-1, and Japan’s limit is 10 ng ml-1 [3]. Among
*Corresponding authors. E-mail: karamalighalkhani@ yahoo.com; [email protected]
Ghalkhani et al./Anal. Bioanal. Chem. Res., Vol. 6, No. 2, 449-456, December 2019.
expert hands. The intrinsic fluorescence of AFs, which is due to the presence of a chain of conjugated bonds and heteroatoms, can be used for their determination. The fluorescence peaks of AFs have been observed between 418-440 nm with a 360-370 nm excitation source [22-26]. The use of spectrofluorimetric analysis is difficult due to overlapping of a fluorescence spectra of each AF with components of the sample matrix and other AFs. This situation demands tedious separation steps to enable selective AFs determination. Different approaches can be used to avoid these inconveniences and increase the sensitivity of the spectrofluorimetric methods such as chemical modification of the molecule with chlorine or bromine [27], the use of β-cyclodextrin as fluorescence enhancer [28] or organized media based on surfactants [29,30], and the possibility of working with photochemically induced fluorescence (PIF). Sensors may be a good choice for the analysis of AFs due to their fast, simple, and low-cost detection capabilities. Nevertheless, to date, only electrochemical sensors [31-33] have been reported in the literature for the determination of some AFs. To the best of our knowledge, no optical sensors have been developed for this purpose. Development of fluorescence sensors needs a knowledge of fluorescence behavior of AFs. The fluorescence feature of AFs depends on the
environmental effects. In this paper, we evaluate the effect of solvent, pH and ionic strength on the fluorescent emission spectra of AFs (B1, B2, G1 and G2). The result of this study can be used for the design and decoration of a fluorescence sensor for AFs.
EXPERIMENTAL
Materials
All reagents used, including salts, solvents, acids, and bases, were of analytical grade and purchased from Merck (Darmstadt, Germany). Crystalline AFs (B1, B2, G1 and G2) were purchased from Sigma Aldrich (Chemical Co., Milwaukee, WI, USA). The 10 ppm stock standard solutions of AFs were prepared in different solvents. The other solutions were prepared by diluting the stock solutions by each solvent. Each solution was protected from light by aluminum foil, and it was kept at 4 °C. All other reagents and solvents were of analytical grade and used without further purification unless otherwise noted. All aqueous solutions were prepared using fresh double-distilled water.
Instrumentation
A Cary-Eclipse 300 Bio UV-Vis luminescence spectrometer (Varian, Australia) was used for recording
spectra and making fluorescence measurements with Xenon lamp pulsed at 80 Hz. All measurements were performed in 1 cm quartz cell, at room temperature (25.0 ± 0.1 °C). All spectrophotometric spectra were measured with a Cary 100 Spectrophotometer (Varian, Australia), centrally controlled by PC with Windows NT operating system. The AFs fluorescence intensity was measured by emission wavelength of 370-500 nm with 1 nm increment and excitation wavelength of 360 nm. The excitation and emission slits were maintained at 5 and 10 nm, respectively and photomultiplier voltage was adjusted to 630 V. The pH of aqueous solution was measured by a digital pH meter (Metrohm, model 692, Herisau, Switzerland) equipped by a glass combination electrode, at room temperature (25.0 ± 0.1 °C).
RESULTS AND DISCUSSION
Wavelength Selection
The technical limitations on detectors have made the “excitation” studies more complicated. In order to achieve the maximum fluorescence intensity, the fluorochrome is usually excited at the optimum wavelength based on the maximum peak wavelength of the excitation curve, and the emission intensity is detected at the peak wavelength of the
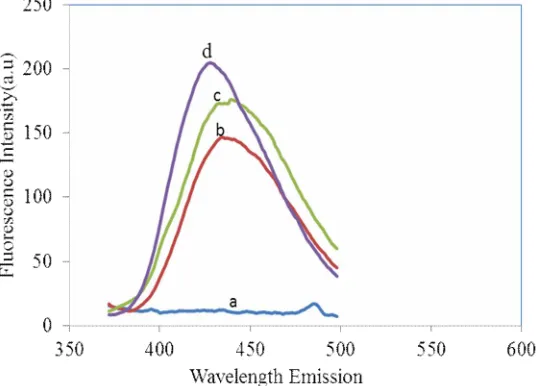
emission curve. The fluorescence spectra of the AFB1 in acetonitrile with different excitation wavelengths are shown in Fig. 2 as a typical sample. The excitations are between 240 and 370 nm with emission spans from 370 to 600 nm. Similar results were observed for the other solvents and AFs, indicating severe overlapping of fluorescence peaks of AFs. The wavelength of 360 nm was chosen as the excitation wavelength. The total integrated fluorescence intensity between 370 and 600 nm was defined as the fluorescence intensity for each sample solution. In this study the effect of various environmental parameters on fluorescence intensity of AFs was investigated.
Effect of Solvent on Intensity
The effects of solvent on fluorescence spectra are complex due to several factors. The factors affecting the fluorescence emission and quantum yields include: solvent polarity and viscosity, rate of deactivation in solvents, fluorophore conformational changes, rigidity of the local environment, internal charge transfer, proton transfer and excited state reactions, solvent-solvent interactions and changes in irradiative and non-irradiative decay rates. These multiple effects provide many opportunities to search for the probe as the local environment surrounding a fluorophore. However, it can be difficult to know which
Ghalkhani et al./Anal. Bioanal. Chem. Res., Vol. 6, No. 2, 449-456, December 2019.
effect is dominant in a particular experimental system. Typically more than one factor should be investigated for studies of the effect of different parameters of each investigated solvent. The results show that each solvent has different effects on the intensity of the fluorescence emission of the investigated AFs.
Table 1 and Fig. 3 show the effect of solvents on the signal intensity for each of the four target AFs. Signal intensity changes are one of the reasons for the effect of solvents on the electron density of aromatic ring and delocalized electrons as well as other functional groups on the rings in the AFs structure. As can be seen, due to the different structures of four different types of AF, solvents do not have the same effect on them. Also, it was observed that the fluorescence intensities in protic solvents were lower than those of the other ones. These solvents can release proton, and therefore, the protonated excited fluorescer (AFs) can be produced in these solvents. After protonation of heteroatoms such as oxygen in the fluorescer, the new bond can increase the vibrational and maybe rotational modes in the exited fluorescer molecules. Also, the protonated heteroatoms cannot participate properly in the electron resonance forms of the excited fluorescent molecules. Therefore, protic solvents show the quenching effect on the fluorescence intensity.
Effect of Solvent on Spectral Shifts
Generally, a fluorophore has a larger dipole moment in the excited state (μE) compared to the ground state (μG).
After fluorophore was excited, the solvent dipoles could reorient or relax around μE leading to decrease in the energy
of the excited state. As the solvent polarity is increased, its effect becomes larger, resulting in emission at lower energies or longer wavelengths. In general, only more polar
fluorophores display a large sensitivity to solvent polarity. Nonpolar molecules, such as unsubstituted aromatic hydrocarbons, are much less sensitive to solvent polarity. Acetonitrile generally is used for dissolution of AFs and also widely applied as mobile phase for RP-HPLC, therefore, it is selected as the base solvent. The wavelength
shift is defined as the difference of AF wavelength in the solvent and acetonitrile:
λShift = λmax (solvent) - λmax (acetonitrile)
Table 2 shows the shift in the maximum emission wavelength for each solvent. Maximum emission
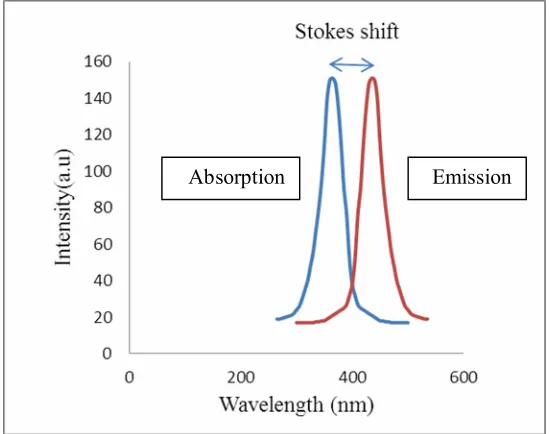
wavelength shift for AFB1, AFB2 and AFGs were observed for 2-propanol, oleic acid and methanol, respectively. Stokes shift is defined as the difference between positions of the band maxima of the absorption and emission spectra (Fig. 4). This shift is the result of two
actions: Vibrational relaxation or dissipation and solvent reorganization. A fluorophore is a dipole, surrounded by solvent molecules. The dipole moment of a fluorophore changes when it is excited, while solvent molecules are not able to adjust so quickly. Only after vibrational relaxation
there will be a realignment of their dipole moments. Stokes shift was obtained as the following formula:
Stocks shift = λmax (emission) - λmax (excitation) Table 1. The Effect of Solvent on the Fluorescence Intensity of AFs (20 ng ml-1)
Solvent
aflatoxin
Dichloro-methane
Oleic acid THF Ethanol Methanol 2-Propanol Acetonitrile Aceton
AFB1 105.67 39.00 31.70 20.16 11.43 9.65 9.36 22.83
AFB2 68.82 32.67 28.22 126.40 97.00 117.83 22.00 27.00
AFG1 232.82 36.73 97.44 66.00 44.43 70.20 168.00 131.00
The results of stokes shift studies are presented in Table 3. As can be seen, AFB1 exhibits the highest stokes shift with methanol. Also, AFB2 and AFGs have the highest stokes shifts in oleic acid and methanol, respectively.
Effect of pH
The acidity of solutions was adjusted by using HCl and NaOH. For this study, fluorescence intensity of four AFs at
different pHs were measured. The obtained results showed similar behavior for AFs investigated. The result for AFB1 as a typical sample is shown in Fig. 5. As can be seen, maximum fluorescence intensity was observed in the pH range of 5-6.
In acidic media, the protonation of heteroatom in AFs rings leads to a reduction in ring conjugation and an increase in the vibration and rotation modes which in turn
Ghalkhani et al./Anal. Bioanal. Chem. Res., Vol. 6, No. 2, 449-456, December 2019.
Table 2. The Shift of the Mmaximum Emission Wavelength (nm)
Solvent
aflatoxin
Dichloro-methane
Oleic acid THF Ethanol Methanol 2-Propanol Aceton λmax
Acetonitrile
AFB1 -2 +7 -7 -1 +12 -37 0 427
AFB2 -4 +11 +6 +3 +4 -2 +1 423
AFG1 +8 -10 -9 +12 +19 +3 -3 437
AFG2 -14 -12 -10 +6 +18 +5 -3 436
All results = λmax (solvent) - λmax (acetonitrile).
Fig. 4. The absorption and emission spectra of stokes shift.
Table 3. The Stocks Shift for the Wavelengths (nm) of AFs in Different Solvents
Solvent
aflatoxin
Dichloro-methane
Oleic acid THF Ethanol Methanol 2-Propanol Acetonitrile Aceton
AFB1 65 74 60 66 79 32 67 67
AFB2 59 74 69 66 67 61 63 64
AFG1 69 67 68 89 96 80 77 74
AFG2 63 64 66 82 94 81 76 73
All results = λmax (emission) - λmax (excitation).
Absorption
reduces the fluorescence intensity. On the other hand, by reducing the acidity, the pair electrons of oxygen atoms in AFs participate in conjugation, and therefore, cause an increase in fluorescence intensity.
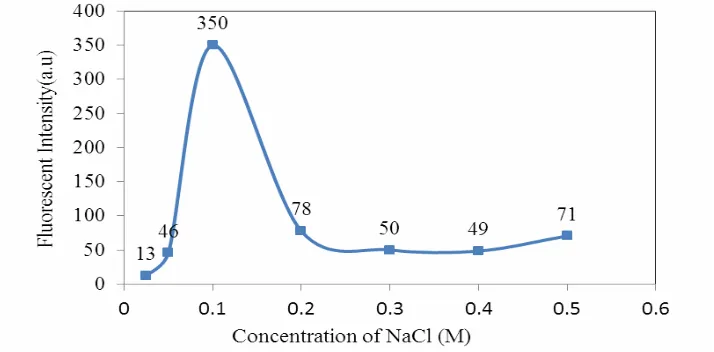
Effect of Ionic Strength
Ionic strength is one of the factors affecting the AF fluorescence intensity. The effect of ionic strength on the fluorescence intensity of target AFs was studied by adding different amounts of NaCl into the AFs solutions. The results showed that the effects of ionic strength on the
fluorescence intensity of target AFs in different solvents are
the same. The typical results for acetonitrile is shown in Fig.
6. The results showed that fluorescence intensity increased
with increasing of NaCl concentration up to 0.1 M and then
decreased at higher concentrations.
The presence of ions in solution of AFs can cause
rigidity in the structure of AFs, and therefore, an increase in
the fluorescence intensity of AFs. At higher concentration
of salts, ions can absorb the energy of the excited state, and
therefore, reduces the fluorescence intensity.
Fig. 5. The effect of pH on the fluorescence intensity of AFB1 (20 ng ml-1) in acetonitrile.
Ghalkhani et al./Anal. Bioanal. Chem. Res., Vol. 6, No. 2, 449-456, December 2019.
CONCLUSIONS
Fluorescence spectroscopy is a suitable tool for monitoring the AFs due to inherent fluorescence properties of AFs and high sensitivity and selectivity of fluorescence measurements. Therefore, investigation of environmental parameters on the fluorescence intensity of AFs is important. In this study, the effect of environmental parameters such as solvent type, ionic strength, and pH on the fluorescence intensity of some targeted AFs was studied. The results of this study can be used for development of analytical procedures for determination of AFs by fluorescence spectroscopy and also for construction of fluorescence sensors for AFs.
REFERENCES
[1] B. Huanga, Z. Hanb, Z. Caia, Y. Wub, Y. Ren, Anal. Chim. Acta 62 (2010) 662.
[2] International Agency for Research on Cancer (IARC). Monographs 6 on the Evaluation of Carcinogenic Risks to Humans. Lyon: IARC, 1993.
[3] B. Guo, Z.Y. Chen, R. Dewey Lee, B.T. Scully, J. Integr. Plant Biol. 50 (2008) 1281.
[4] J.W. Bennett, M. Klich, Clin. Microbiol. Rev. 16 (2003) 497.
[5] H. Gourama, L.B. Bulleman, J. Food Prot. 58 (1995) 1395.
[6] J.D. Miller, Food Addit. Contam. 25 (2008) 219. [7] S. Nawaz, R.D. Coker, S.J. Haswell, J. Planar
Chromatogr. 8 (1995) 4.
[8] Z. Fu, X. Huang, S. Min, J. Chromatogr. A 1209 (2008) 271.
[9] N.W. Turner, S. Subrahmanyam, S. Piletsky, Anal. Chim. Acta 632 (2009) 168.
[10] A.R. Pen, M.C. Alcaraz, L. Arce, A. Rios, M. Valcarcel, J. Chromatogr. A 967 (2002) 303.
[11] H.K. Abbas, R.M. Zablotowicz, M.A. Weaver, B.W. Horn, W. Xie, W.T. Shier, J. Microbiol. 50 (2004) 193.
[12] W.S. Khayoon, B. Saad, C.B. Yan, N.H. Hashi, A.S.M. Ali, M.I. Salleh, B. Salleh, Food Chem. 118 (2010) 882.
[13] S.M. Herzallah, Food Chem. 114 (2009) 1141. [14] C.A.F. Oliveira, N.B. Gonc, R.E. Rosim, A.M.
Fernandes, Int. J. Mol. Sci. 10 (2009) 174.
[15] V.S. Sololev, J.W. Dorner, J. AOAC Int. 85 (2002) 642.
[16] A. Korde, U. Pandey, S. Banerjee, H.D. Sarma, S. Hajare, M. Venkatesh, A.K. Sharma, M.R.A. Pillai, J. Agric. Food Chem. 51 (2003) 843.
[17] C.M. Maragos, V.S. Thompson, Nat. Toxins 7 (1999) 371.
[18] A.Y. Kolosova, W. Shim, Z. Yang, S.A. Eremin, D. Chung, Anal. Bioanal. Chem. 384 (2006) 286. [19] B. Sarimehmetoglu, O. Kuplulu, T. Haluk Celik, Food
Control 15 (2004) 45.
[20] S. Sforza, C. Dall’Asta, R. Marchelli, Mass Spectrom. Rev. 25 (2005) 54.
[21] C. Cavaliere, P. Foglia, C. Guarino, M. Nazzari, R. Samperi, A. Lagana, Anal. Chim. Acta 141 (2007) 8. [22] A. Tarín, M.G. Rosell, X. Guardino, J. Chromatogr. A
1047 (2004) 235.
[23] Y. Wang, T. Chai, G. Lu, C. Quan, H. Duan, M. Yao, Environ. Res. 107 (2008) 139.
[24] D. Chan, S.J. MacDonald, V, Boughtflower, P. Brereton, J. Chromatogr. A 1059 (2004) 13.
[25] J. Blesa, J.M. Soriano, J.C. Moltó, R. Marín, J. Mañes, J. Chromatogr. A 1011 (2003) 49.
[26] I.K. Cigić, H. Prosen, Int. J. Mol. Sci. 10 (2009) 62. [27] M. Mably, M. Mankotia, P. Cavlovic, J. Tam, L.
Wong, P. Pantazopoulos, P. Calway, P.M. Scott, Food Addit. Contam. 22 (2005) 1252.
[28] J. Hashemi, G.A. Kram, N. Alizadeh, Talanta 75 (2008) 1075.
[29] S.N. Shtykov, J. Anal. Chem. 57 (2002) 859.
[30] I.Y. Goryacheva, T.Y. Rusanova, K.E. Pankin, J. Anal. Chem. 63 (2008) 751.
[31] N.H.S. Ammida, L. Micheli, G. Palleschi, Anal. Chim. Acta 520 (2004) 159.
[32] J.H.O. Owino, O.A. Arotiba, N. Hendricks, E.A. Songa, N. Jahed, T.T. Waryo, R.F. Ngece, P.G.L. Baker, E.I. Iwuoha, Sensors 8 (2008) 8262.