Human-Centric Situational Awareness and Big
Data Visualization
Sri Teja Bodempudi
1Sharad Sharma
1Atma Sahu
2and Rajeev Agrawal
31 Department of Computer Science, Bowie State University, Bowie, MD, 20715, USA 2 Department of Mathematics and Computer Science, Coppin State University, Baltimore, MD,
21216, USA
3 U.S. Army Engineer Research and Development Center, 3909 Halls Ferry Rd, Vicksburg, MS
39180, USA
[email protected], [email protected], [email protected], [email protected]
Abstract
Human-centric situational awareness and visualization are needed for analyzing the big data in an efficient way. One of the challenges is to create an algorithm to analyze the given data without any help of other data analyzing tools. This research effort aims to identify how graphical objects (such as data-shapes) developed in accordance with an analyst's mental model can enhance analyst's situation awareness. Our approach for improved big data visualization is two-fold, focusing on both visualization and interaction. This paper presents the developed data and graph technique based on force-directed model graph in 3D. It is developed using Unity 3D gaming engine. Pilot testing was done with different data sets for checking the efficiency of the system in immersive environment and non-immersive environment. The application is able to handle the data successfully for the given data sets in data visualization. The currently graph can render around 200 to 300 linked nodes in real-time.
1
Introduction
Early hands-on experience with the augmented/ mixed reality devices like HoloLens and Oculus has given better results in data visualization. Analyzing data is one task, on another hand analyzing data based on the user requirement and situational awareness is a tough task. Situational awareness will work by taking in consideration user search history and preferences of the user in the past. There have been many efforts in data mining and visualization to create effective ways to improve analysis and achieve better understanding of the data. Visualization plays a key role in exploring and understanding of Big data and large datasets. Big data could include anomalies and abstract information that are not easily recognizable. The goal of performing analytics and visualization is to discover underlying patterns and
Volume 64, 2019, Pages 51–60
display it to the user effectively. The exploration of Big Data can be improved by integrating human intuition and perception for situational awareness. Therefore, the key idea of effective data visualization is to represent the complex raw data in a way that is more manageable for the user to understand.
Nowadays the data collection unities are growing, and they are collecting so much of data from different resources like security cameras, grocery store, transactions from bank, social network, etc. this data is called raw data. There are so many challenges in big data collection, collaborating, searching, analyzing and visualizing [1]. Just by looking into the raw data will not make any sense. For making raw data a valuable and meaning full data, it must undergo several changes. There are so many tools available for modifying raw data, but the data generated from those tools required certain knowledge about the data for reading the processed data. The aim of this project is to make easy to understand the data.
From the processed data one can create so many visual models. If any model is generated by taking the user requirements, users view into consideration [2] then that view will be more helpful and will succeed. There are so many tools available in the market for filtering the data but all those are created for analyzing certain data, one tool cannot use for analyzing all kinds of data. For each type of data, there will be so many types of human requirements, so all these tools are created based on user requirements. By having human requirements in a very detailed manner will help to improve the effectiveness and efficiency of the tool [3]. There is one more important factor need to be the focus on other than visualizing is situational awareness. Nowadays all these tools are pretty much preprogrammed for getting information about user requirements and processing data displaying results but if systems are able to analyze what is going on with current data and able to give suggestions to the user, that would make situational awareness enabling the system.
In this system the processed data is loaded into the excel sheet or XML file, after making several changes to the raw data, even excel is a powerful tool that can do some modifications to the data if necessary, in runtime. The main tool is generated in unity 3D because it enables wide options to choose 3D glasses for displaying output in the 3D world. Using unity 3D, one can use the same application in many 3D visualize devices. For this project, Oculus is chosen as an output device because it has two
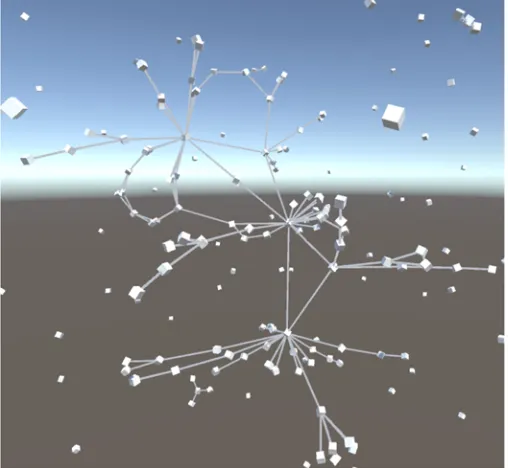
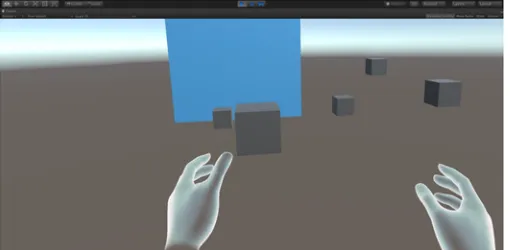
hands for interacting with the virtual environment, which gives a real feeling to interact with objects in the environment (figure 2 shows how hand controls are helpful in interacting with the environment). Now, the main project for visualizing data is created in Unity 3D and the code is deployed to run in Oculus. While running the application it will ask to load excel data file into unity for analysis, after few moments system will generate force directed graph with cubes in the Oculus as an output (figure 1 shows how the output will appear from Oculus). Those cubes are loaded with data so that the user can read data on the cube and the links between the cubes represents the relationship to the other data in the field. By this way, user can get a better idea about the data. When the user squeezes the trigger then the hands in the virtual environment (3D environment) will hold the object in the virtual environment. These oculus controllers aid in grabing the required cube for examining or to have a close look at it in the 3D view.
2
Related Work
2.1
Human-Centric:
A good analysis of data requires the incorporation of both qualitative and quantitative data from the users’ perspective and context, [8] In most instances, the analysis of data is done using a data-aggregation mechanism which entails that acts of feeding raw data into analytical tools. However, despite the convenience of these tools to process and analyze raw data, they don't account the diverse perspectives and historical contexts of the users, [11]. Gacek [8] and Livi et al. [10] have used a human-centric approach that integrates data machine, historical context, and societal effects to develop a city resiliency strategic plan. Additionally, Pedrycz et al. [13] have used the human-centric model to analyze and interpret time series data. Consequently, Craig et al. [6] found out that the constructs developed using human-centric model were more accurate and highly interpretable than any other model. Another notable finding was the fact that the human-centric model is user-friendly as it deals with perceptions and process rather than numeric entities.
People play a vital role in the data life cycle. The role of people in the life cycle of big data can be classified into four categories. These include data producers, data curators, data consumers, and community members. Virtually anyone can generate a vast amount of data. For instance, simply using the mobile phone or social network platforms leads to the generation of a vast amount of data. The major challenge is to create algorithms and incentives that guide people on how to produce and share useful data while maintaining data privacy. In the contemporary world, there is less central control of data. Data is not just under the control of database administrators and curated by the IT department. Data is generated by various people who can also curate it. Crowdsourcing is one of the most popular
curation solutions [16]. Data consumers are usually people who know how to write SQL queries. However, data consumers in the contemporary world may not know how to formulate a query. Use of new query interfaces would improve the ability of data consumers to ask queries. There are various online communities in the modern world. Communities usually create, share, and manage data [17].
2.2
Situational Awareness:
Situational awareness is the ability to assess the huge volume of raw data with an aim of determining its relevancy, synthesizing and acting on it [6]. The ability of the users to deduct the desired content from the raw data not only depends on the visualization of data but also the manner in which data is synthesized. The situation awareness-enabled system gives suggestion to the users about the current data, an act that enabled to make an informed and accurate decision. Timonen et al. [14] used a situational awareness approach in public healthcare emergency to collect and synthesize patients' information. Using this approach, they argued that healthcare providers are in a better position to collect the correct information and take necessary medical actions on the patients. Falco [7] and Aragon et al. [4] have advocated for the use of situation awareness by government agencies working under pressure to derived desired content from complex ministerial data.
Situational awareness refers to a three-part process that comprises of perception, comprehension, and projection, which leads to decision-making and actions [18]. Building situational awareness involves getting actionable insight from a system to influence the future. Reason about the current state is the main activity required in the perception and comprehension of a task. Stages of situational awareness are related to the visual analytic loop that requires analysts to undertake information foraging and sense making [19]. Exploring mitigation strategies or identification of unknown signatures to facilitate defense against cyber threats are some common sense-making tasks.
2.3
Big Data Visualization:
In this era of big data, the experts’ focus is on the visualization of these datasets. Currently, there are various sources through which big data are generated, [14]. For this reason, approaches, technologies, and paradigm have been developed to represent the big datasets [9]. Additionally, Caldarola et al. [5] have used Inforgram software to represent companies’ designs and brands. Their study found out that the Inforgram software presented the data in a pleasant manner that appealed to the readers and users of data.
The complexity of big data poses a significant challenge to data analysts. It necessitates the improvement of data visualization techniques and methods. The establishment of new interactive platforms and supporting research in this field would help in tackling the challenges of big data visualization. An increase in the rates of data processing may lead to a situation where analytical methods are not up to data since the amount of data is growing continuously. This provides a suitable environment for the development of big data technologies [20].
3
System Architecture
Visualizing data on the 2D surface like computer monitors, charts, etc., has a dimensional limit (X and Y axes) and presents space limitations. Whereas visualizing the data in 3D equipment enables more options to the presenter such as the use of 3-dimensional graphs, which enables to refer more attributes at a time. Moreover, by using 3D visualization the user can visualize the data in 3600. The data can be
inputs. The aim of this project is to create a universal flexible data visualizing module in immersive and non-immersive environment. This will give a flexibility to the user to load users excel data sheet or XML sheet into the application. The application will then generate a report and display in the targeted 3D display equipment. This project is built using Unity 3D gaming engine. Unity has a feature to connect major 3D visualizing equipment without any other extra tools or software necessity. Figure 3 shows the non-immersive project in unity and figure 2 shows the immersive project to visualize the XML data.
3.1
Force-Directed Graph
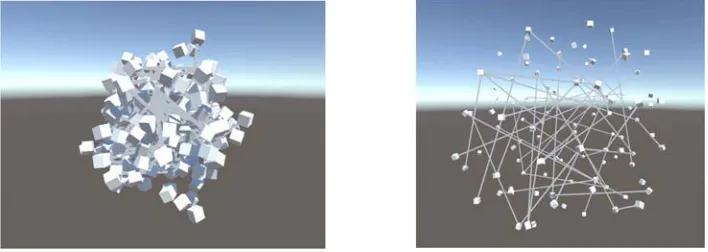
The force directed graph is a special kind of graph with many nodes and links. In this, the nodes have repulsive force between them. This force helps to maintain the distance between each node. If this force is disabled, the graph collapses, and all nodes group together and form one single big node (as shown in figure 4). The links used to connect the two nodes are flexible. When the user tries to grab and pull the node, the links attached to that node start expanding up to a certain extension. After a certain extension, the whole graph starts moving towards the pulled node to retrieve its original position. As this whole graph is based on the force between nodes, the nodes maintain space between them. This helps the user to have a clear view of the observed node and its links.
Figure 3: View of XML data in non-immersive environment
In this project, the first challenge was to read the data from excel / XML sheet and analyzing it. For this purpose, in Unity a C# script was prepared. This script grabs the excel data sheet from the user and loads it into unity 3D gaming engine. The Excel / XML sheet script implementation was divided into two parts. The first part for creating cubes in the environment and second part for creating links between cubes. Based on these coordinates the cubes were created in the environment when the program gets executed. The script also involved layers for group name or ID, text display, colors for cubes. In the second part of excel / XML sheet script describes the connectivity between cubes. It includes the link ID, which makes the connectivity between two cubes unique as well as source node and targeted node respectively. The source node gives the starting point of the link and targeted node locates endpoint of the cube. Based on these two points the link is established between two cubes in the environment. When the user loads the excel / XML data sheet into the application, the C# script extracts the coordinates for creating the cubes in the environment. Based on the coordinates, cube is named and a group Id assigned to it. After creating cubes system moves to creating the links between the cubes. Based on the source node Id and destination node Id the link is established. Each link created in this stage is named with a unique Id provided from of the sheet. Figure 5 shows the visualization of data from excel sheet.
Initially, the front view is designed in unity with the side toolbar and input data file loader bar at the middle of the view (refer figure 3). 3D asserts, images, sounds, textures, materials, etc., are collected and loaded into the unity project. The C# code script is added for the input module in such a way that it uses input excel / XML file. For creating cubes and links between them. the cube size is designed dynamically to get the 3D effect.
4
Implementation and User Interaction
The application is designed in two modes: training mode and analyzing mode. In training mode, the user gets a chance to use the equipment and interact with the application to get familiar with the 3D environment. In the analysis mode, the user analyzes the given data and visualizes it in a simple meaning full way. In training mode, the user has a chance to play with the application without loading the data into the application. The user can create cubes randomly in the space. The cubes can be grabbed and dragged for examining the cube. The links can be made by drawing lines between the cubes or by clicking the button connect, will connect the cubes randomly.
In analysis mode, the user is able to load the data file in XML/excel format for visualization. The C# code script is developed that is responsible for reading the input data file for analysis. The input file
contains columns and rows of data. Based on the number of rows available in the datasheet, number of cubes are created in the environment. The linking of cubes is done based on the code. If any two cubes are linked, it means they both have data that are related to each other rows. In this way, the user can identify the similarity of the data.
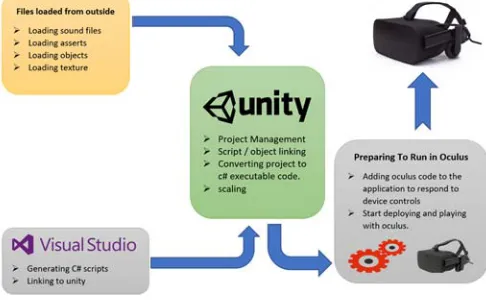
The life cycle of the project can be explained with the help of the figure 6. Initially, unity is loaded with different asserts from its asserts store. With the help of the visual studio, the C# scripts are created and loaded in unity. These scripts are responsible for animations and sounds in unity. After pulling all asserts and scripts in a perfect manner the application is tested in the unity. After it successful run in unity game view, the Oculus is integrated into the system.
4.1
Navigation/Exploration
In this project, the XML data is loaded into the Unity3D game engine. Unity 3D includes the physics engine and allows flexibility in multi-platform support. This application is developed for both immersive (refer figure 2) and non-immersive environments (refer figure 3). The immersive environment is integrated through the use of oculus rift and touch controllers. In the immersive environment (via Oculus), the user can walk around in the VR environment similar to walking in the real world. Also, the user can use the oculus touch controllers to navigate inside the 3D environment. On the other hand, in non-immersive environment, the can move around by using the keyboard and mouse.
4.2
Identification/Selection
The data in the XML sheet is represented in the 3D world with several cubes and links between them. When the XML file is loaded in the application each row data is loaded for each cube and connection between the data is represented by the links between nodes. When the user is using non-immersive environment, the user can use the mouse to select the cube and drag it closer to the user for observation. On other hand, if the user is using oculus touch controllers, they look like hands (as shown in figure 2) inside the VR environment. The user is able to move closer and grab the cubes (nodes) to have a closer look. The user can also create new links between the nodes through the user interface.
4.3
Interaction
One of the challenges with Big Data today is coming up with an appropriate solution for effective analysis and visualization. As data is complex, visualization is the key in helping the user to find pattern for data analysis. These patterns can enhance analyst's situation awareness. Virtual reality creates an immersive environment for the user to interact in the 3D space such that as data is overlaid within a geographical domain, an enhanced situational awareness and cognition is achieved. Advances in VR lead to the growth of computation and processing becoming faster on both the hardware and software fronts. As a result, the VR hardware is becoming more powerful, available, and affordable for visual data exploration and interaction.
5
Simulation and Results
A limited user study was conducted to evaluate the effectiveness of the proposed application. The study illustrated its success and demonstrated the effectiveness of the application in data visualization. Responses were collected from 5 participants, 80% of whom were male and 20% were female. The post-test part of the questionnaire measured the participant's perceptions of motivation, usability, educational and training effectiveness, appropriateness.
Figure 7 shows that most of the users (60%) felt that Oculus was more suitable for displaying the data than in 2D data representation. The following questions were asked in the user study:
• Do you consider this system useful in understanding unknown complex data?
• While using this application the features like dragging cubes are use full to understand data? • Did hand controls are able to interact with data without any interruption?
• Used for educational or training purposes in data visualization and understanding. • Do you recommend this application?
The data visualization project got a positive response to the survey. Most of the participants are interested in it, most of them are able to handle the device successfully with taking the training. All of them able to Load the data and able to interact with data. The application is perfectly responding to user actions.
6
Conclusions and Future Work
This project reveals the great potential of how utilizing the immersive VR platform can bring a more effective visual experience. We have effectively visualized the data sets for checking the efficiency of
80.00%
60.00%
40.00%
20.00%
0.00%
2D presentation 3D presentation
2D 3D
40.00% 60.00%
the system in both immersive environment and non-immersive environment. As this tool is prepared for all kind of excel/XML files, it is easy to load data sheet into the application. Implementing Unity’s UI system allows for 3D nodes, text and more engagement through touch controllers. The controllers of oculus are used to create a hand input that helps the user immerse the player and manipulate the data more effectively. This research has shown (1) virtual reality can be used as a data visualization platform, (2) a more immersive environment with oculus integration offers human-centric situational awareness and visualization that is needed for analyzing the big data in an efficient way, (3) big data visualization can be represented in two-fold, focusing on both visualization and interaction.
Although we have useful analytics developed, we intend to add more features that allow further user engagement. Some potential future features we plan to implement in the user interface include multi-selection, annotation, and collaborative virtual reality environment. We plan to continue to find other ways to enable user interaction and improve usability.
7
Acknowledgments
This work is funded in part by the ARL Award: W911NF1820224.
References
[1] C.L. P. Chen, C.-Y. Zhang, "Data-intensive applications, challenges, techniques and technologies: A survey on Big Data", Information Sciences, 275 (10), pp. 314-347, August 2014.
[2] I. DIS. "Ergonomics of human-system Interaction-Part 210: Human-centered design for interactive systems”, International Organization for Standardization (ISO). Switzerland, 2010.
[3] S. Miksch and W. Aigner., "A matter of time: Applying a data-users tasks design triangle to visual analytics of time-oriented data", Computers & Graphics, 38:286–290, Feb. 2014.
[4] C. R. Aragon, S. S. Poon, G. S. Aldering, R.C. Thomas, & R. Quimby, "Using Visual Analytics to Develop Situation Awareness in Astrophysics", Information Visualization, 8(1), 30-41. doi:10.1057/ivs.2008.30. 2009
[5] E. G. Caldarola, & A. M. Rinaldi, Big Data Visualization Tools: A Survey - The New Paradigms, Methodologies and Tools for Large Data Sets Visualization", Proceedings of the 6th International Conference on Data Science, Technology and Applications. doi:10.5220/0006484102960305. 2017.
[6] R. Craig, T. Tryfonas, & J. May, "A viable systems approach towards cyber situational awareness. 2014 IEEE International Conference on Systems, Man, and Cybernetics (SMC). doi:10.1109/smc.2014.6974112. 2014.
[7] G. J. Falco, "City Resilience through Data Analytics: A Human-centric Approach", Procedia Engineering, 118, 1008-1014. doi: 10.1016/j.proeng.2015.08.542. 2015
[8] A. Gacek, "Signal processing and time series description: A Perspective of Computational Intelligence and Granular Computing", Applied Soft Computing, 27, 590-601. doi: 10.1016/j.asoc.2014.06.030. 2015.
[9] P. A. Legg, "Enhancing cyber situation awareness for Non-Expert Users using visual analytics", International Conference On Cyber Situational Awareness, Data Analytics And Assessment (CyberSA). doi:10.1109/cybersa.2016.7503278. 2016.
[11]W. Lu, J. Yang, & X. Liu, "Numerical Prediction of Time Series Based on FCMs with Information Granules", International Journal of Computers Communications & Control, 9(3), 313. doi:10.15837/ijccc.2014.3.210. 2014.
[12]J. McManus, K. Huebner, & J. Scheulen, "The Science of Surge: Detection and Situational Awareness", Academic Emergency Medicine, 13(11), 1179-1182. doi: 10.1197/j.aem.2006.06.038. 2006.
[13]W. Pedrycz, W. Lu, X. Liu, W. Wang, & L. Wang, "Human-centric analysis and interpretation of time series: a perspective of granular computing", Soft Computing, 18(12), 2397-2411. doi:10.1007/s00500-013-1213-5. 2014.
[14]J. Timonen, "Improving situational awareness of cyber physical systems based on operator's goals", International Conference on Cyber Situational Awareness, Data Analytics and Assessment (CyberSA). doi:10.1109/cybersa.2015.7166121. 2015.
[15]D. Whelan, D., Galasso, D. A., Smith, B., & Ryan, M. "A network-centric approach to space situational awareness", Defense Transformation and Network-Centric Systems. doi:10.1117/12.670557. 2006.
[16]E. Simperl, B. Norton, and D. Vrandečić, “Crowdsourcing tasks in linked data management,” In Proceedings of the Second International Conference on Consuming Linked Data. Vol. 782, pp. 61-72, October 2011.
[17]A. Dasgupta, D. L. Arendt, L. R. Franklin, P. C. Wong, and K. A. Cook, “Human factors in streaming data analysis: Challenges and opportunities for information visualization”, Computer Graphics Forum, Vol. 37, No. 1, pp. 254-272, February 2018.
[18]M. R. Endsley, "Toward a theory of situation awareness in dynamic systems", Human Factors: The Journal of the Human Factors and Ergonomics Society, vol. 37, no. 1, pp. 32–64, 1995.
[19]A. M. Maceachren, A. Jaiswal, A. C. Robinson, S. Pezanowski, A. Savelyev, P. Mitra, X. Zhang, J. Blanford, “SensePlace2: GeoTwitter analytics support for situational awareness,” In Proceedings of IEEE Conference on Visual Analytics Science and Technology (VAST), pp. 181–190, 2011. [20]M. Kaur, “Challenges and issues during visualization of Big Data,” Int J Technol Res Eng., Vol.