ISSN (Online): 2348 – 3539
IMPLEMENTATION OF BRAIN TUMOR IMAGE ANALYZE USING FLICM
ALGORITHM
1
P.SPriyanka ,
2S.Priya ,
3S.Vasudevan ,
4M.Manojprabu
B.E Student of (Dept. of ECE) Angel college of Engineering and Technology Assistant Professor of (Dept. of ECE) Angel college of Engineering and Technology
Abstract: Image segmentation is an important and challenging factor in the medical image segmentation.. In this paper, a brain tumor segmentation method has been developed in medical image. This method can segment a tumor provided that the desired parameters are set properly. To give variation of fuzzy c-means (FCM) algorithm that provides image clustering using MRI Brain Tumor database. We introduce a new technique called as Fuzzy Local Information C-means (FLICM) Algorithm for segmentation, which overcomes the limitations of FCM technique & at the same time enhances the clustering performance. The input MRI image is preprocessed and loaded into MATLAB workspace. The major characteristic of FLICM is the use of a fuzzy local (both spatial and gray level) similarity measure, aiming to guarantee noise insensitiveness and image detail preservation.The diagnostic test image is segmented by applying the segmentation algorithm in order to separate the tumor pixels and non-tumor pixels The separate tumor pixels are considered as True positive (TP) clusters. If non tumor pixels segmented, those pixels are considered as True negative (TN).
Keywords: MRI, FCM, FLICM, True positive, True negative.
Reference to this paper should be made as follows, 1 P.SPriyanka , 2 S.Priya , 3 S.Vasudevan , 4 M.Manojprabu „Implementation Of Brain Tumor Image Analyze Using Flicm Algorithm‟ ‟International Journal Of Inventions in Computer Science and Engineering, Volume 4 Issue 3Mar 2017.
I.INTRODUCTION
The human body is comprised of many sorts of cells. Each type of cell has special functions. Most cells in the body develop and afterward separate in an organized approach to frame new cells as they are expected to keep the body sound and working legitimately. The extra cells form a mass of tissue called a tumor. Brain tumors can be primary or metastatic, and either malignant or benign. A metastatic mind tumor is a growth that has spread from somewhere else in the body to the cerebrum. Normally, the anatomy of brain can be viewed by the MRI scan or CT scan. In this paper, MRI scanned image is taken for the entire process. Magnetic Resonance Imaging (MRI) is the state of the art medical imaging technology which allows cross sectional view of the body with unprecedented tissue
contrast. Segmentation is an important process to extract information from complex medical images. The image segmentation can be divided into four categories: thresholding, clustering, edge detection and region extraction. In this paper, a clustering method for image segmentation will be considered. Clustering is a process for classifying.
ISSN (Online): 2348 – 3539
well on most noise-free images, it is very sensitive to noise and other imaging artifacts, since it does not consider any information about spatial context. To compensate this drawback of FCM, a pre-processing image smoothing step has been proposed in. However, by using smoothing filters important image details can be lost, especially boundaries or edges. Moreover, there is no way to control the trade-off between smoothing and clustering. Pre-processing of MRI images is the primary step in image analysis which perform image enhancement and noise- reduction techniques which are used to enhance the image quality, then some morphological operations are applied to detect the tumor in the image.
II.RELATED WORK
A. K-means clustering:
K-means clustering process for segmentation of the image tracked by morphological filtering is used for tumor detection from the brain MRI images. MRI scans of the human brain forms the input images for our method where the grey scale MRI input images are taken as the input. The preprocessing stage will transform the RGB color input image to grey scale image. Noise present if any, is being removed using the median filter. The preprocessed image is taken for image segmentation using K-means clustering method. As there are risks of occurrence of misclustered regions after the application of K-means clustering algorithm, a morphological filtering have been proposed which is executed after the image is segmented by using K-means clustering algorithm. Thresholding is the simplest method of image segmentation. From a gray scale image, thresholding can be used to create binary images.
B. Fuzzy C-means Algorithm:
Fuzzy C-means (FCM) algorithm is a clustering methodology introduced by Dunn, enhanced by Bezdek and further titivated by Matteo Matteucci and it groups the voxels (data) of the magnetic resonance (MR) brain images as „n‟ number of clusters. The neigh-boring pixel of least mean distance from the centroid pixel are assigned with low membership grade value and are grown around the centroid value, hierarchically. The membership grade and the cluster
centers are iteratively updated to reduce the objective function of grouping the voxels. Brain tumor may be primary or secondary, it will be primary when tumor at origin stage & will be secondary when tumor cells starts spreading to other healthy tissues of brain. Both Primary & secondary brain tumor can be detected using method that uses K-Means clustering, proposes histogram Thresholding & artificial neural network. Modification was done on previous segmentation methods to overcome from drawbacks; ROI (region of interest) parameter is used in diagnosis of MRI images. Noise is removed in pre-processing step using Gaussian filter. Its non-robust results are mainly because of ignoring spatial contextual information in image and the use of non-robust Euclidean distance.
In the existing system, EnFCM as well as FGFCM, share a common crucial parameter (a or µ). This parameter is used to control the tradeoff between the original image and its corresponding mean- or median-filtered image. It has a crucial impact on the performance of those methods, but its selection is generally difficult because it should keep a balance between robustness to noise and effectiveness of preserving the details.
In other words, the value of has to be chosen large enough to tolerate the noise, and, on the other hand, it has to be chosen small enough to pre- serve the image sharpness and details. Thus, we can conclude that the determination of is in fact noise-dependent to some degree. Since the kind of image noise is generally a priori unknown, the selection is, in practice, experimentally made, usually using trial-and-error experiments.
ISSN (Online): 2348 – 3539
DRAWBACKS OF EXISTING SYSTEM:
The existing system has following disadvantages, Conventional hard clustering methods classify each point of the data set just to one cluster.
Poor contrast, overlapping intensities and noise reduce the segmentation efficiency. It does not consider about any spatial
context.
IV.METHODOLOGY USED
The brain is the anterior most part of the central nervous system. Brain tumor is an intracranial solid neoplasm. Tumors are created by an abnormal and uncontrolled cell division in the brain. In this work, we have used axial view of the brain image (2D) from MRI scan because MRI scan is less harmful than CT brain scan.
The shortage of radiologists and the large volume of MRI to be analyzed make these readings labor intensive and also cost expensive. It also depends on the expertise of the technician examining the images. Estimates also indicate that between 10 and 30% of tumors are missed by the radiologists during the routine screening.
Image segmentation is the main significant process in the majority of medical image analysis. Image segmentation methods can be classified as threshold, region based, supervised and unsupervised classification techniques.
A. MAGNETIC RESONANCE IMAGING:
A magnetic resonance imaging (MRI) scanner uses powerful magnets to polarize and excite hydrogen nuclei (single proton) in human tissue, which produces a signal that can be detected and it is encoded spatially, resulting in images of the body. The MRI machine emits radio frequency (RF) pulse that specifically binds only to hydrogen.
MRI uses three electromagnetic fields: static field which is a very strong static magnetic field which polarizes the hydrogen nuclei and gradient field
which is a weaker time-varying field used for spatial encoding and a weak radio frequency field for manipulation of the hydrogen nuclei to produce measurable signals, which are collected through radio frequency antenna.
B.
BINIRIZATION
Binarization is the process of converting a pixel image to a binary image. Therefore, the special document characteristics, like textual properties, graphics, line-drawings and complex mixtures of their layout-semantics should be included in the requirements. We use a rapid hybrid switch that dispatches the small, resolution adapted windows to textual (1) and non-textual (2) threshold evaluation techniques,
C.
MEDIAN FILTERING FOR NOISE
REMOVAL
Median filter is a non-linear filtering technique used for noise removal. Median filtering is used to remove salt and pepper noise from the converted gray scale image. It replaces the value of the center pixel with the median of the intensity values in the neighborhood of that pixel. Median filters are particularly effective in the presence of impulse noise. Impulse noise is also called as salt and pepper noise because of its appearance as white and black dots covered on image. The median filter is used for remove salt and pepper noise from MRI images.
D. THRESHOLDING
The simplest method of image segmentation is called the Thresholding method. This method is based on a clip-level (or a threshold value) to turn a gray-scale image into a binary image. The key of this method is to select the threshold value (or values when multiple-levels are selected). Several popular methods are used in industry including the maximum entropy method, Otsu's method (maximum variance), and k-means clustering.
ISSN (Online): 2348 – 3539
to a segment is based on multi-dimensional rules derived from fuzzy logic and evolutionary algorithms based on image lighting environment and application.
E. EDGE DETECTION
Edge detectionis a well-developed field on its own within image processing. Region boundaries and edges are closely related, since there is often a sharp adjustment in intensity at the region boundaries. Edge detection techniques have therefore been used as the base of another segmentation technique. Edge detection methods can be applied to the spatial-taxon region, in the same manner they would be applied to a silhouette. This method is particularly useful when the disconnected edge is part of an illusory contour. Segmentation methods can also be applied to edges obtained from edge detectors.
F. IMAGE SEGMENTATION
Image segmentation is the process of partitioning a digital image into multiple segments. Image Segmentation is typically used to locate objects and boundaries in image, image segmentation is the process of assigning a label to every pixel in an image such that pixels with the same label share certain visual characteristics.
The name unsupervised classification because the algorithm automatically classifies objects based on user given criteria. Here K-means clustering process for segmentation of the image tracked by morphological filtering is used for tumor detection from the brain MRI images. MRI scans of the human brain forms the input images for our method where the grey scale MRI input images are taken as the input. The preprocessing stage will transform the RGB color input image to grey scale image. Noise present if any, is being removed using the median filter. The preprocessed image is taken for image segmentation using K-means clustering method. As there are risks of occurrence of misclustered regions after the application of K-means clustering algorithm.These matrices are related to matrix size and its field of view. Images are kept in MATLAB and displayed as a gray level image of size 256*256. The entries of a gray level image are ranging from 0 to 255, where 0 shows complete black
color and 255 shows completely pure white color. Entries within this range vary in intensity from black to white.Most frequently used enhancement and noise reduction methods are applied that can give best possible results. Enhancement will result in more prominent edges and a sharpened image is acquired, noise will be removed thus reducing the blurring effect from the image. In addition to enhancement of image, the image segmentation will also be applied.Edge detection will lead to find the particular location of tumor. Following steps will be monitored in the preprocessing stage: 1) The developed MRI scanned images, kept in database is transformed to gray scale image of size 255*255. 2) Image is processed to remove any noise present. Visual quality of noisy image will not be acceptable. 3) The less noisy, high quality image is then operated by a high pass filter to sharpen and to detect the edge; 4) The sharpened image is then added to original image for further enhancement.Clustering is the process of classifying objects or patterns in such a way that samples belonging to same group are more similar than that of belonging to different group. There are many clustering strategies, such as hard clustering and fuzzy clustering, each having own special characteristics. In hard clustering, approach to segmentation result is crisp i.e. each pixel of image belongs to exactly one cluster.Clustering is a process to obtain a partition P of a set E of N objects Xi (i=1, 2,…, N), using the resemblance or dissemblance measure, such as a distance measured. A partition P is a set of disjoint subsets of E and the element Ps of P is called cluster and the centers of the clusters are called centroid or prototypes. Many techniques have been developed for clustering data. In this paper c-means clustering is used. It consists of the following steps:
Step 1: Choose the number of clusters - K
Step 2: Set initial centers of clusters c1, c2...ck;
Step 3: Classify each vector x [x, x ,....x ] T into the closest Centre ci by Euclidean distance measure |xi-ci ||=min || xi -ci||
ISSN (Online): 2348 – 3539
computed by, cim = ∑xli ∈ Cluster(Ixlim) Ni Where, Ni is the number of vectors in the i-th cluster.
Step 5: If none of the cluster centers (ci =1, 2,…, k) changes in step 4 stop; otherwise go to step 3.
G. FLICM Algorithm
This Classification structures the data into different categories and investigates the numerical properties of image features. It has two steps of processing which are: training phase and testing phase. Characteristic properties of image features are collected and a unique definition of each classification category is created in Training phase. These features space partitions are used to categorize image features in testing phase.
It classifies among two classes by creating a hyper plane in high-dimensional feature space that can be used in classification. Hyper planes are represented by
w.x+b=0 (1)
W =weight vector and normal to hyper plane.
B = threshold or bias.
Linear Separable Binary Classifier
Considering N training points, where each input has „A‟ attributes and reside in one of two classes. Training data is of the form:
The main motive of using Support Vector
Machine (SVM) is to align hyper plane in such a
way as to be as far as possible from the closest
members of both classes. Description of Training
data is given by:
(w. a+ b) ≥ 1 for =+1
(w.a + b) ≤ 1 for =-1
Above equation is written as :
(w.a+ b) -1 ≥ 0 ≦
Consider the points as that lie closest to the separating hyper plane, i.e. the Support Vectors; then the two planes; hyper plane 1 and hyper plane 2 lie on points which can be described as:
For Hyper plane 1, w. + b = +1
For Hyper plane 2, w. + b = -1
Mathematics geometry analysis defined a distance from point P (m, n) to a line ax + by + c = 0
In the same way, the distance from a point x+ on HyperPlane1 to Optimal Hyper plane is given by d1 as
Minimizing ||w|| is equivalent to minimizing ½ (the factor being used for mathematical convenience) and the use of this term makes it possible to perform Quadratic Programming (QP) optimization later on. We therefore need to find:
Whenever any new image comes for classification the trained data features and new image features are given to SVM classifier. In which the testing features are compared with the new features. If the result of comparing the both is highly matched then we put it to class 1, means the new image is Normal image. Else the features are placed into class 2, means the new image is infected image or abnormal image.
ALGORITHM
The algorithmic steps involved for brain tumor shape detection is as follows;
ISSN (Online): 2348 – 3539
Step 2: Provide the MRI scan image in JPEG format as input.
Step 3: Check the input image format is as specified or not and go to step 4, display error message if not in specified format.
Step 4: Covert image into gray scale image if it is in RGB format else move to next step.
Step 5: Find the gray scale image edge.
Step 6: Calculate the total number of white points in the image.
Step 7: Using the formula calculate the size of the tumor.
Step 8: Display the tumor size and stage.
Step 9: Stop the process. The stage determination of tumor is based on the area of tumor. The proposed work uses techniques to calculate the tumor stage.
H. ACCURACY CALCULATION AND
COMPARISON
The diagnostic test image is segmented by applying the segmentation algorithm in order to separate the tumor pixels and non-tumor pixels. The goal of MRI image segmentation is to cluster pixels into salient image pixels partitioning. . The segmentation of MRI brain image should be classified based on the pixels partition (not based on the databases).
The separate tumor pixels are considered as True positive (TP) clusters. If non tumor pixels segmented, those pixels are considered as True negative (TN).If tumor pixels are not segmented properly, those missed pixels are considered as False positive (FP). If the unusual pixels are segmented (low intensity pixels) ,those pixels are considered as False negative (FN).
1. True positive (TP): Tumor effected people correctly diagnosed as Abnormal.
2. False positive (FP): Normal people incorrectly identified as Abnormal means Tumor effected.
3. True negative (TN): Normal people correctly identified as healthy or Normal. 4. False negative (FN): Tumor effected
people incorrectly identified as healthy or Normal.
Accuracy= (TP+FP) / (TP+TN+FP+FN).
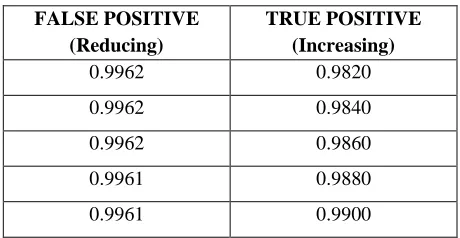
TABLE FOR TRUE POSITIVE AND TRUE NEGATIVE VALUES
FALSE POSITIVE (Reducing)
TRUE POSITIVE (Increasing)
0.9962 0.9820
0.9962 0.9840
0.9962 0.9860
0.9961 0.9880
0.9961 0.9900
CONCLUSION
ISSN (Online): 2348 – 3539
REFERENCES
1. Rohan Kandwal and Ashok Kumar “ An
Automated System for Brain Tumor Detection and
Segmentation”.
2. Jianping Fan,Yau Elmagarmid & Aref‟s “Detection of brain tumor using threshold value of MRI images”.
3. Dzung L. Pham, Chenyang Xu, Jerry L.
Prince “Brain tumor MRI image segmentation and detection in image processing”.
4. Gauri P. Anandgaonkar1, Ganesh.S.Sable
“Detection and identification of brain tumor in MRI
images usinf fuzzy C-means segmentation”.
5. Rohini Paul Joseph,C. Senthil Singh
“Segmentation Based Detection Of Brain
Tumor”.
6. K .R. Yashodha “Automatic Segmentation of